



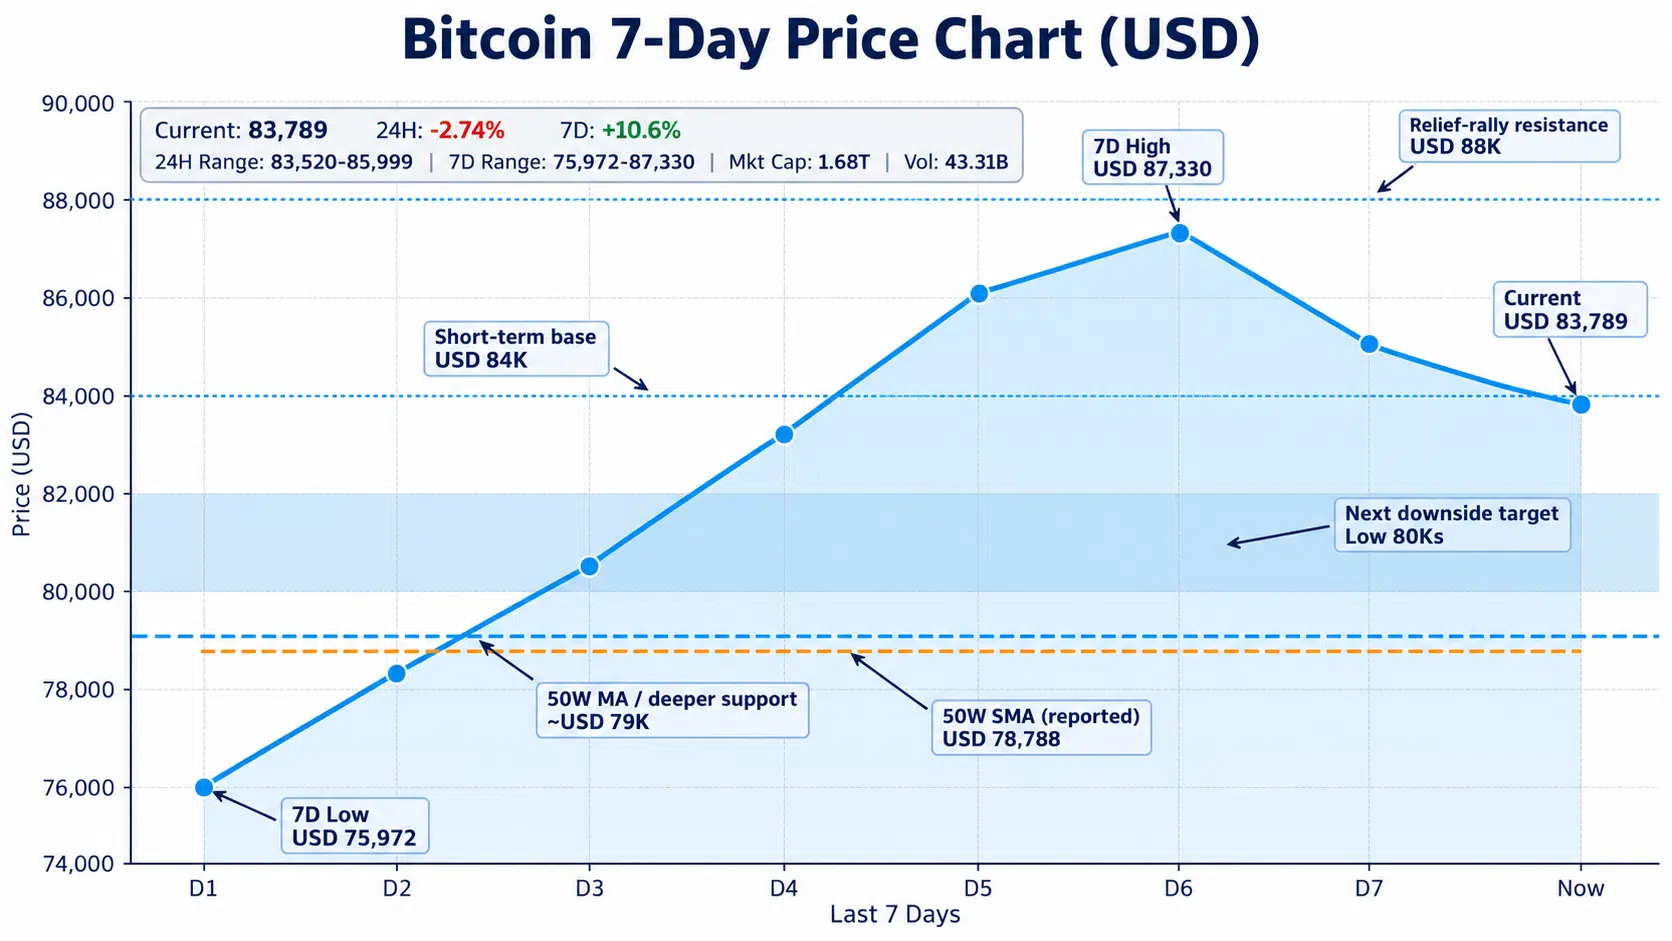
Bitcoin trades near $84,000 after a daily decline, with $88,000 above its weekly high and the 50-week SMA near $79,000 marking a lower reference.
Bitcoin traded near $83,800 on September 24, retreating toward the lower end of its daily range after a 2.74% decline over 24 hours. CoinMarketCap recorded approximately $43.31 billion in trading volume and a market capitalization of $1.68 trillion.
The pullback followed a weekly advance that took Bitcoin above $87,000. CoinGecko reported a seven-day gain of approximately 10.6%, leaving the cryptocurrency higher over the week despite its latest daily losses.
Bitcoin Retreats Toward $84,000 After Weekly Advance
CoinMarketCap quoted Bitcoin at approximately $83,789, slightly below the $84,000 threshold. Its 24-hour low of $83,519.73 showed that trading had already extended beneath that level during the session.
The broader weekly range remained considerably wider. CoinGecko recorded a seven-day low of $75,971.64 and a high of $87,329.89. Bitcoin’s latest price was approximately 4.1% below the upper end of that range, while remaining above the week’s lowest prices.
The daily and weekly readings therefore captured different price movements: a retreat from recent highs within a period that still showed a double-digit percentage gain.
$88,000 Sits Above the Recent Trading Range
A recovery from $84,000 to $88,000 would represent an increase of approximately 4.8%. That upper level is roughly $670, or 0.8%, above CoinGecko’s recorded weekly high.
Reaching $88,000 would consequently extend Bitcoin beyond the top of its recent seven-day range. It would not, however, establish how the market trades afterward; a subsequent rejection or continued advance would require further price action.
On the downside, a move from $84,000 to $82,000 would amount to a decline of approximately 2.4%, while a drop to $80,000 would represent about 4.8%. Both levels remain within the recorded weekly range. Even a decline toward $79,000 would leave Bitcoin above the seven-day low near $75,972.
These distances describe the size of the potential moves, without establishing that a rebound must precede another decline.
Bitcoin’s 50-Week SMA Places a Longer-Term Reference Near $79,000
The area around $79,000 also overlaps with Bitcoin’s recently reclaimed 50-week simple moving average.
In a September 23 analysis, Kathy Lien placed the indicator at approximately $78,788, following a weekly Bitcoin close near $81,159. She reported that this was the first weekly close above the average in 45 weeks.
The 50-week SMA averages 50 weekly closing prices, smoothing shorter-term fluctuations across a period approaching one year. A pullback toward $79,000 would therefore bring Bitcoin close to that longer-term trend reference, around 6% below $84,000.
Lien identified whether the average holds as support during subsequent pullbacks as the next test of the reclaim. Its position below the market does not establish that buying will prevent a break beneath it.
Galaxy Research’s historical analysis provides examples of both outcomes. Its August study documented successful recoveries above the 50-week average after previous bear-market lows, but also identified failed upward crossings in December 2021 and March 2022 that were followed by lower lows. Those episodes show that a moving-average reclaim and a completed broader correction have not always occurred together.