
Bitcoin, Ethereum and XRP hold below resistance as NEAR rebounds and Quant consolidates. Explore technical levels and price scenarios for October 1, 2026.
Bitcoin, Ethereum and XRP opened October with modest rolling 24-hour gains, while NEAR Protocol outperformed the group and Quant remained nearly unchanged. The completed daily charts showed different conditions: Bitcoin remained inside its recent consolidation, Ethereum and XRP stayed below nearby resistance, and NEAR recovered much of its latest pullback.
Quant and NEAR join today’s coverage because both appeared in CoinGecko’s search-trending list and ranked inside its top 100 by market capitalization. NEAR ranked 21st and Quant 32nd in the market snapshot. A trending-search listing measures attention and is distinct from a ranking of price gainers.
| Asset | Price | 24-hour change | Aggregate 24-hour volume |
|---|---|---|---|
| Bitcoin | $83,728 | +0.49% | $35.33 billion |
| Ethereum | $2,695.47 | +0.86% | $13.92 billion |
| XRP | $1.50 | +0.46% | $2.88 billion |
| Quant | $297.20 | Approximately unchanged | $772.29 million |
| NEAR Protocol | $5.39 | +10.48% | $1.51 billion |
Bitcoin Fails to Hold Above the Previous Resistance Zone
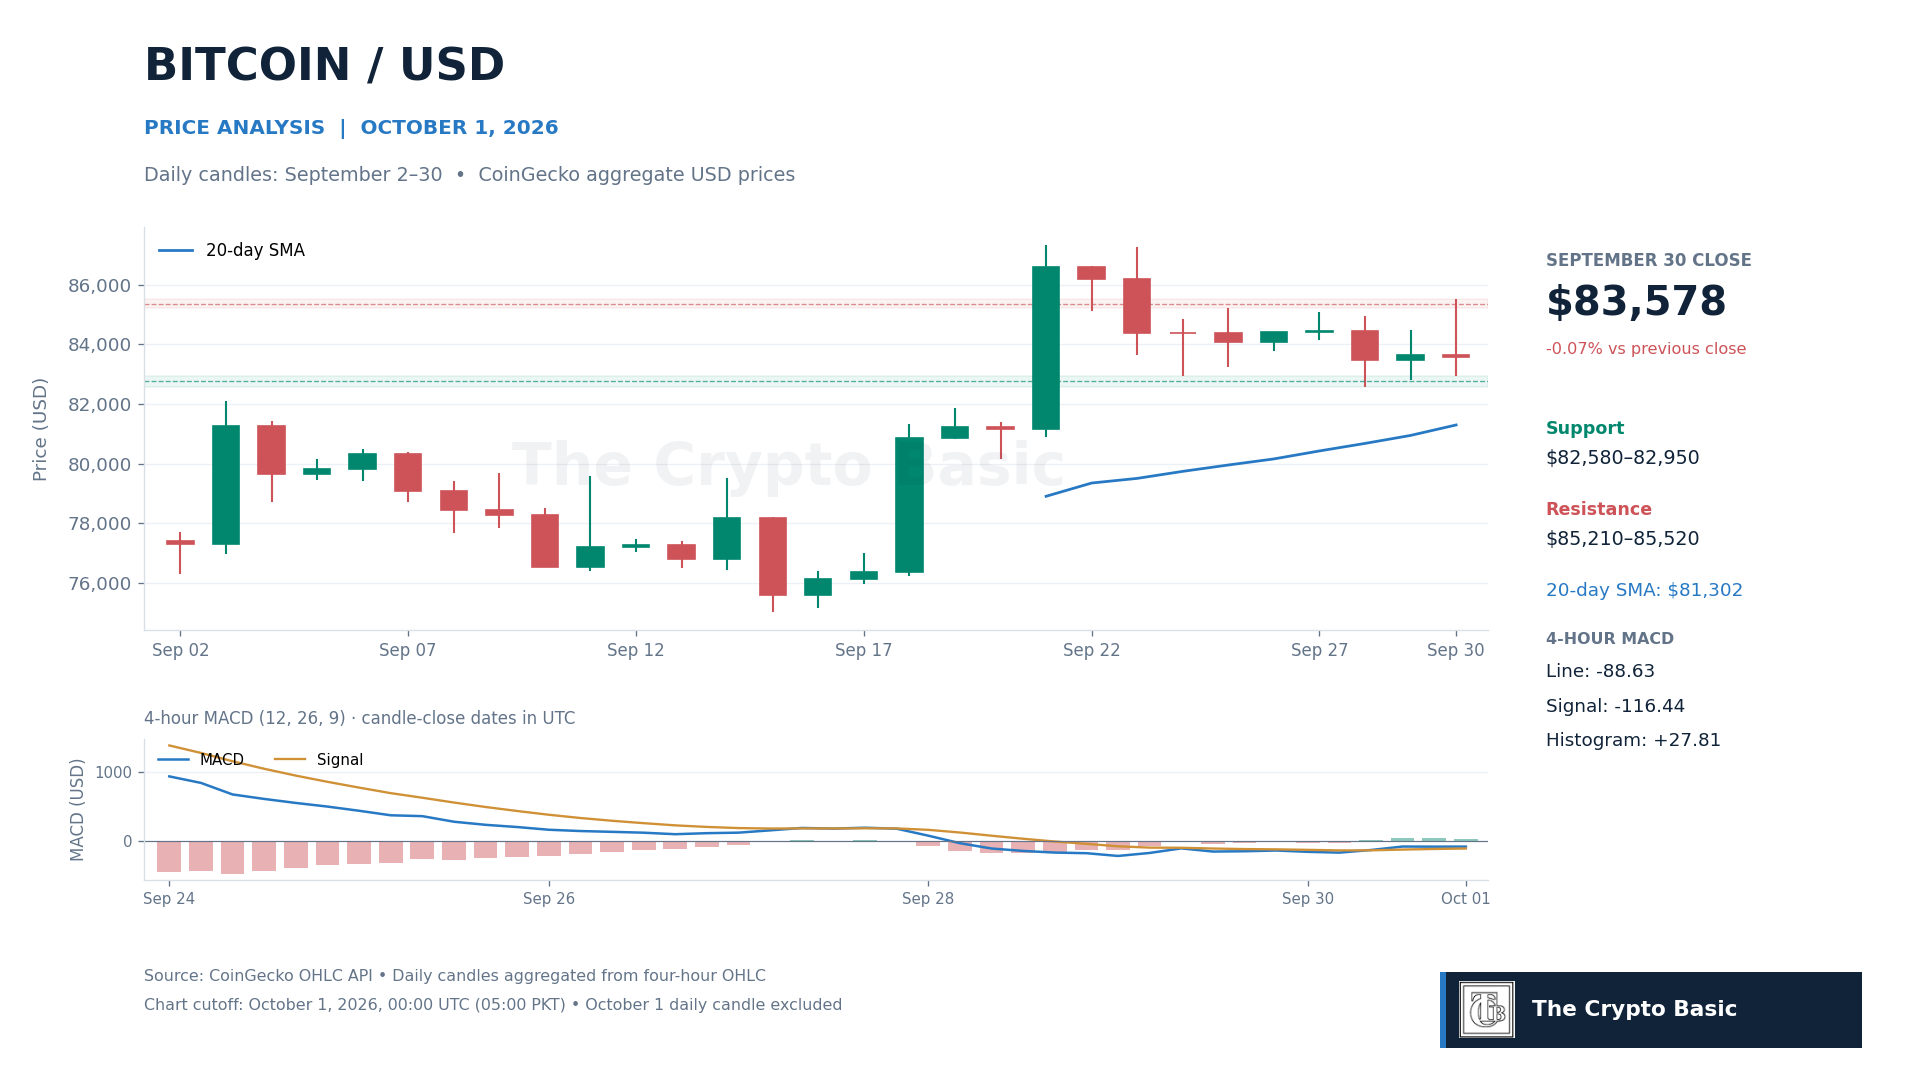
Bitcoin closed September 30 at $83,578, down 0.07% from $83,640 a day earlier. The session reached $85,518, temporarily exceeding the $85,210 upper resistance boundary identified in the previous report, before ending back below it. That intraday move did not become a confirmed daily breakout.
The latest high expands immediate resistance to approximately $85,210–$85,520. A completed daily close above $85,520, followed by a hold of the reclaimed area, would strengthen the case for another test of the September highs around $87,250–$87,330.
Support remains near $82,580–$82,950, encompassing the September 28 and September 30 lows. Beneath it, the rising 20-day simple moving average stood near $81,302. A daily close below $82,580 would weaken the range and bring that average into focus.
Four-hour MACD, using 12,26,9 settings, remained mixed as the candle closed at 00:00 UTC. The MACD line was approximately -88.63, above its -116.44 signal line but still below zero. Its positive histogram narrowed from 34.24 to 27.81, indicating that the latest improvement relative to the signal line was losing pace.
Ethereum Holds Above Its 20-Day Average but Below $2,743
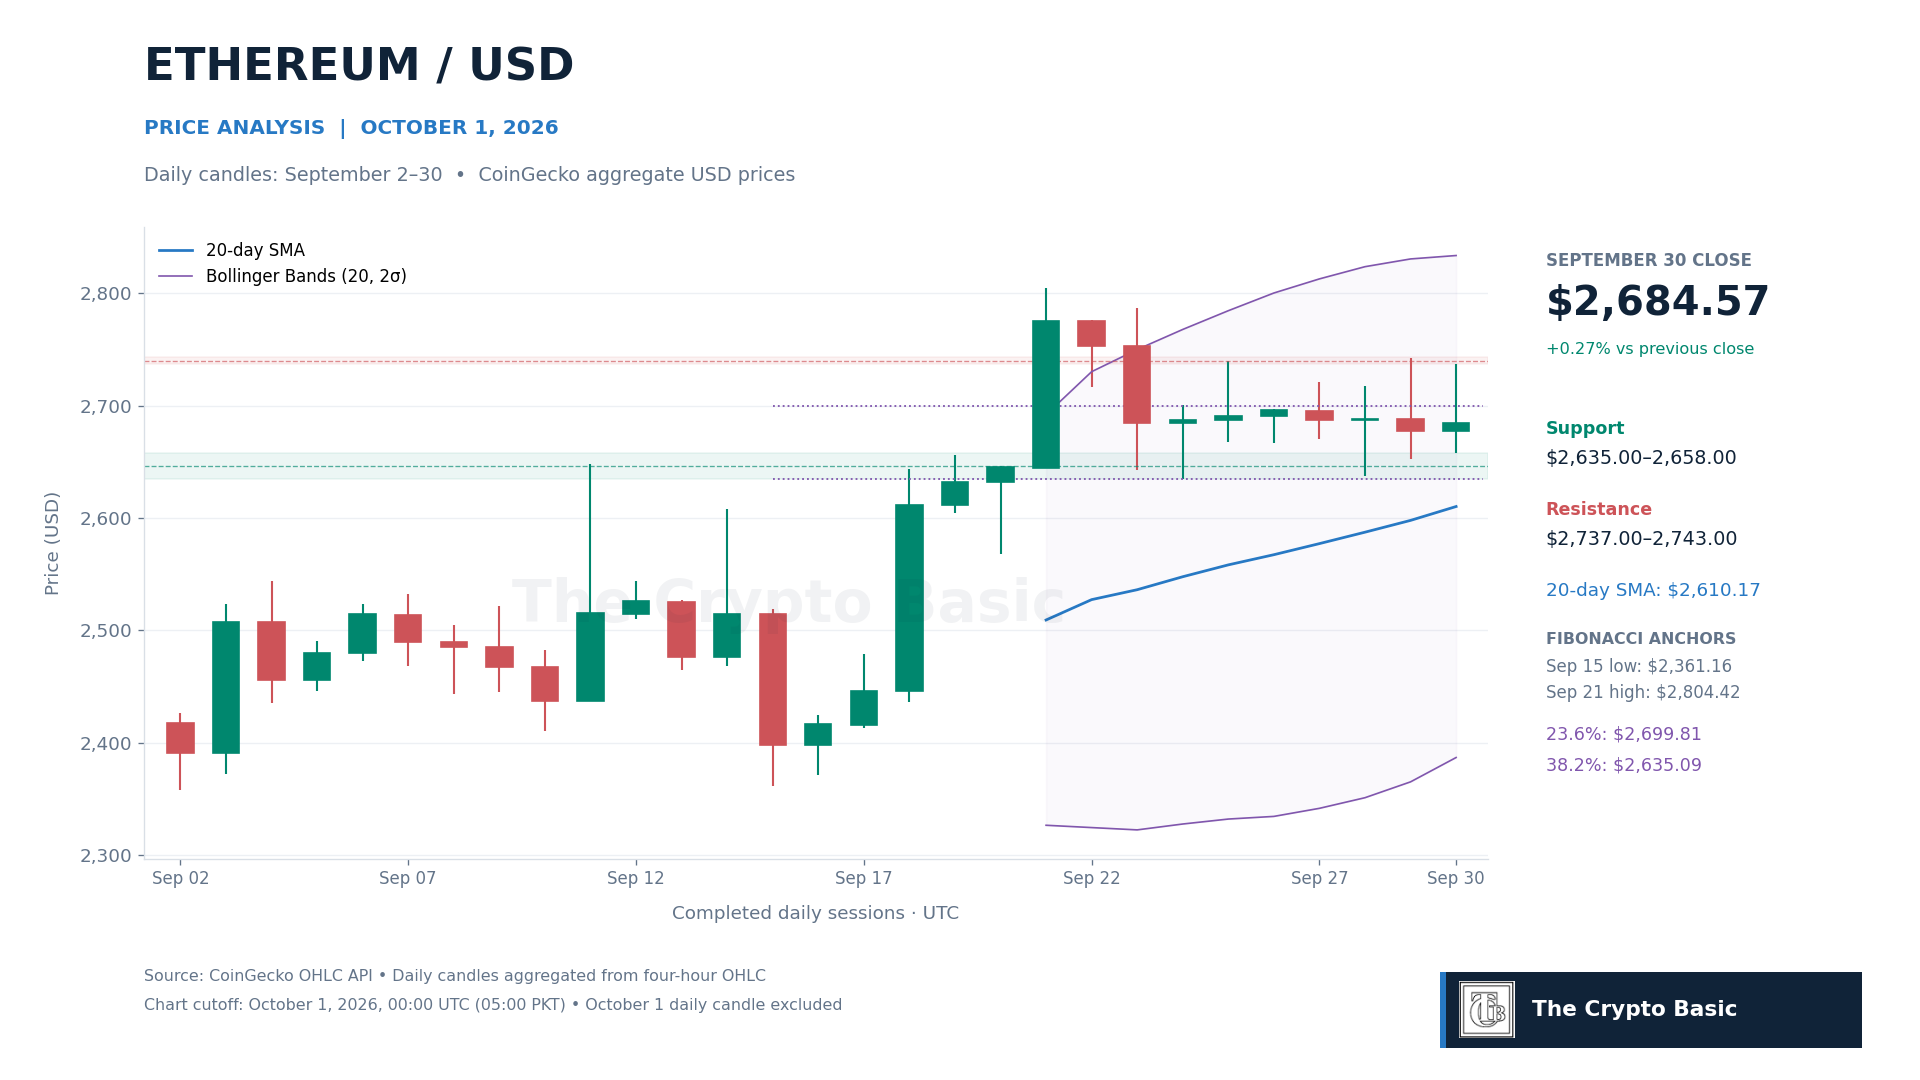
Ethereum closed September 30 at $2,684.57, gaining 0.27%. Its $2,736.98 session high remained below the approximately $2,743 resistance level highlighted in the previous report.
Daily Bollinger Bands, calculated using a 20-day simple moving average and two standard deviations, had a midpoint near $2,610.17 and an upper band near $2,833.57. ETH price closed above the midpoint and inside the bands, with nearby horizontal resistance still separating price from the higher band.
Fibonacci retracements of the advance from September 15’s $2,361.16 low to September 21’s $2,804.42 high place the 23.6% level near $2,699.81 and the 38.2% level near $2,635.09. The latter closely matches the recent support floor around $2,635.
A daily close above $2,743 would put the $2,787–$2,804 highs back in view. Only a further break of that area would support an extension toward the upper Bollinger Band, whose value changes with subsequent closes.
Conversely, a close below $2,635 would weaken the consolidation and expose the 20-day average near $2,610, followed by the 50% retracement near $2,583.
XRP’s $1.45–$1.47 Support Remains in Focus
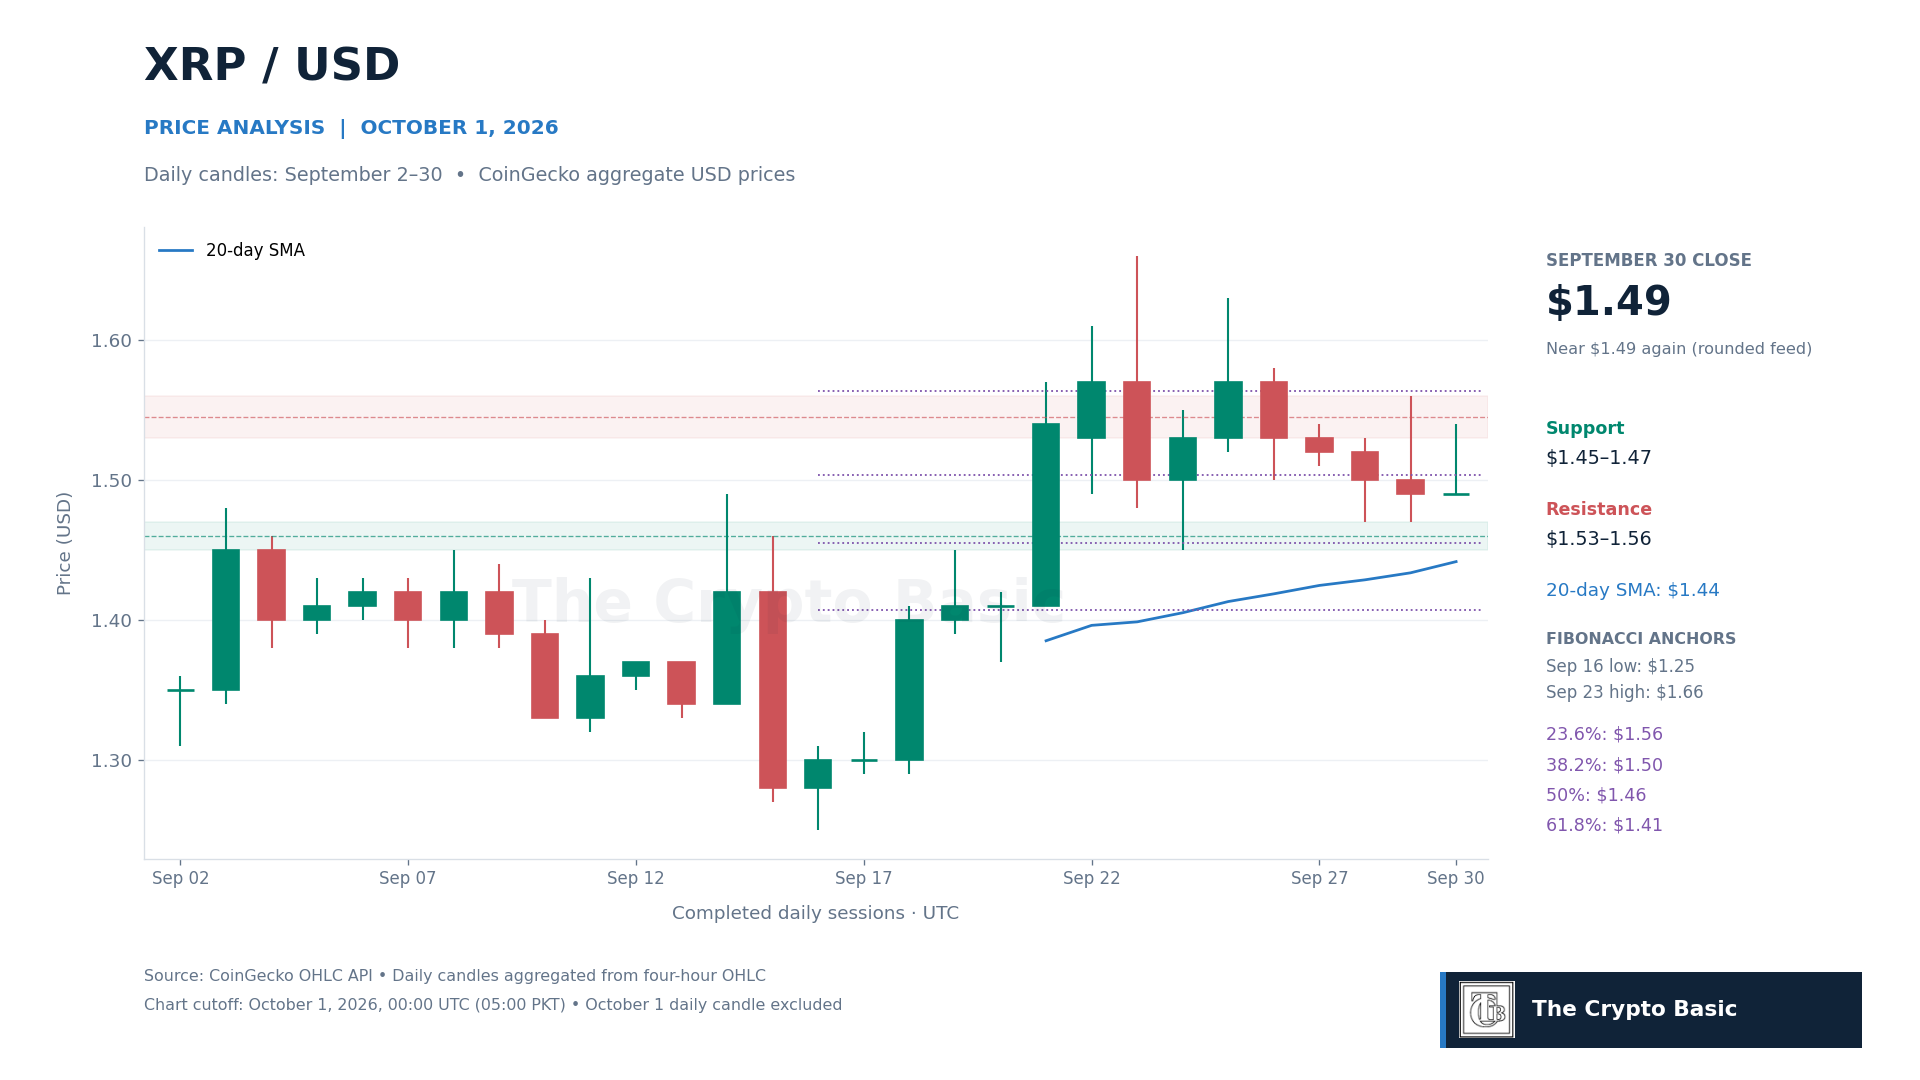
XRP finished September 30 near $1.49 after reaching approximately $1.54. The close remained near the preceding session’s level and below the $1.53–$1.56 resistance band identified in the previous report.
The 20-day simple moving average rose to about $1.44. Fibonacci retracements of the advance from the September 16 low of $1.25 to the September 23 high of $1.66 provide additional reference points: approximately $1.50 at 38.2%, $1.46 at 50%, and $1.41 at 61.8%.
The 50% retracement falls within the established $1.45–$1.47 support area, while the moving average sits just beneath it. A completed close below this support band would weaken the current structure; a further loss of the average would bring the $1.41 retracement into focus.
On the upside, reclaiming $1.50 would be an initial improvement, but a close above $1.56 would be needed to clear the broader resistance band and nearby 23.6% retracement. Holding that reclaimed area would support a retest of $1.61–$1.66. A return below $1.53 after a breakout would weaken that recovery scenario.
Quant’s Daily Recovery Meets Softer Four-Hour Momentum
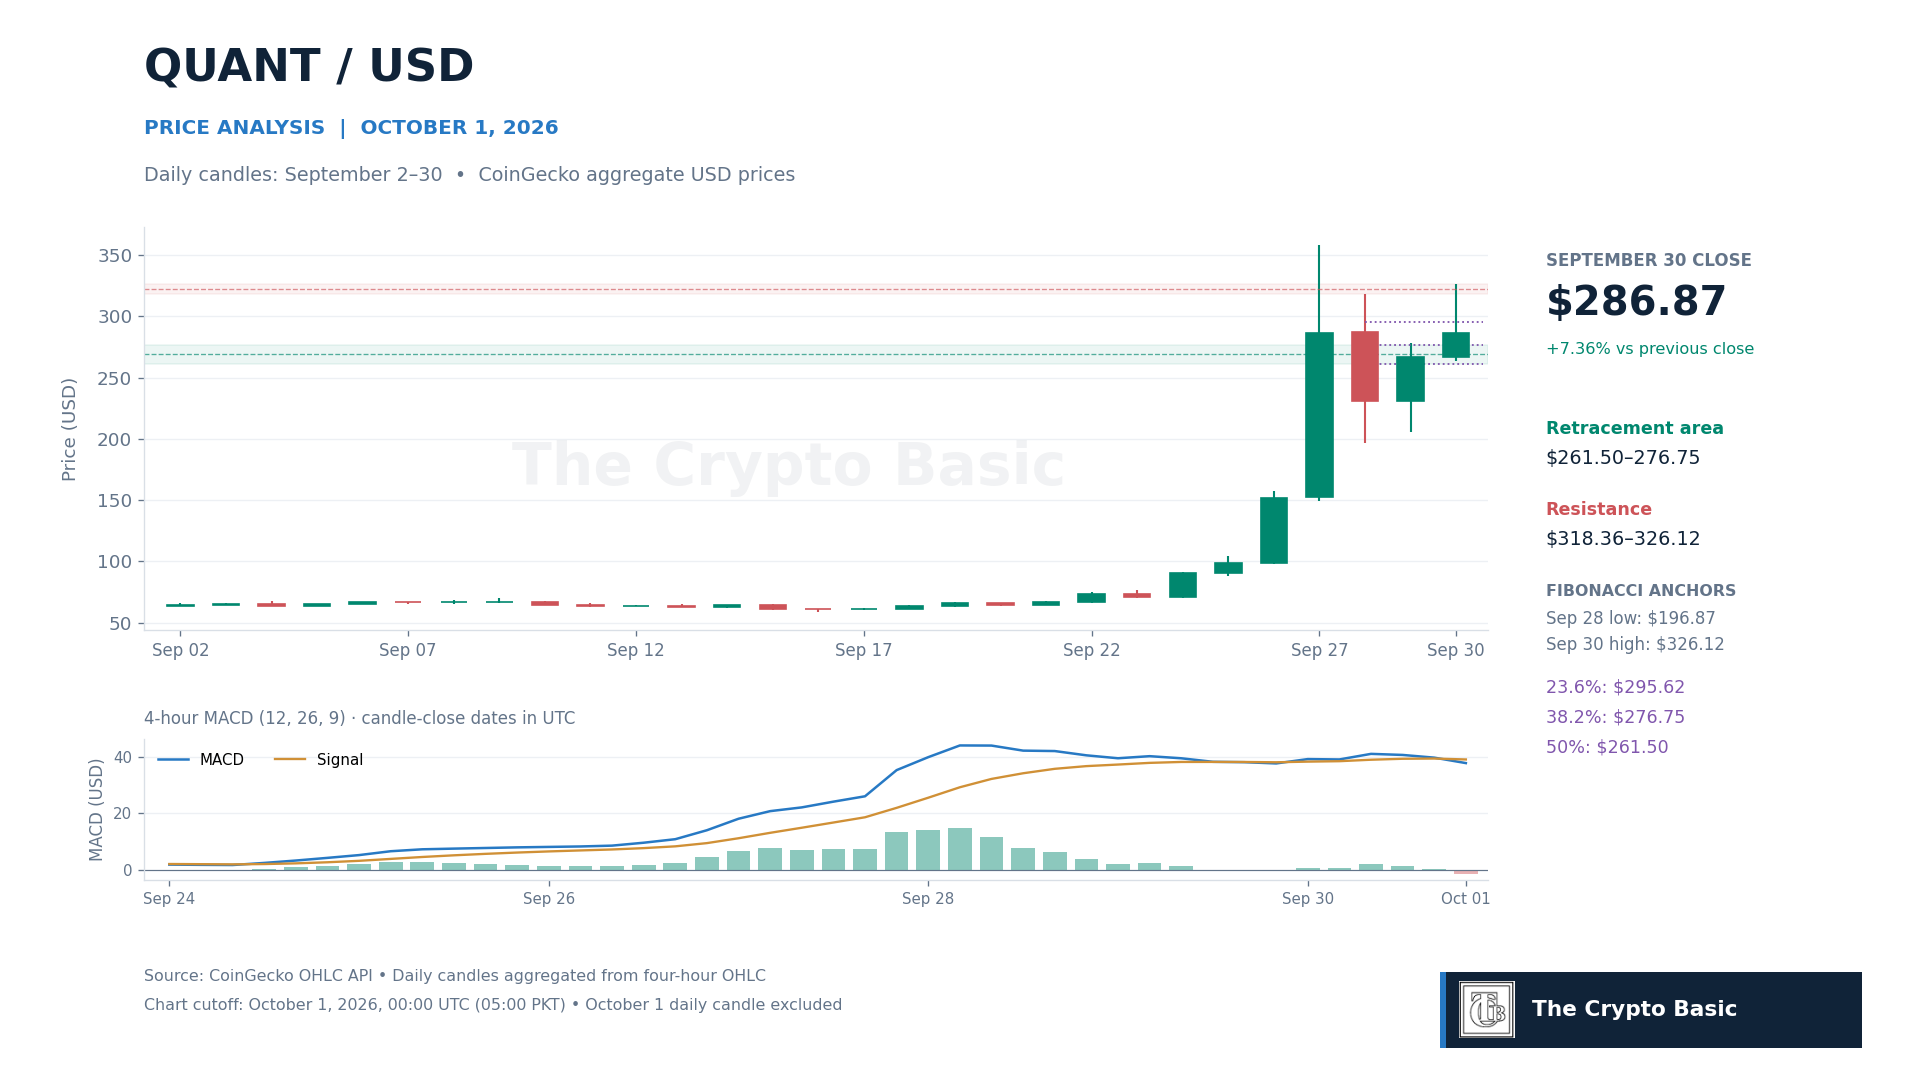
Quant closed September 30 at $286.87, up 7.36% from $267.20. The session climbed to $326.12 before retreating into the close. Its nearly flat rolling 24-hour return at the later snapshot measures a different window from that completed daily gain.
Fibonacci retracements of the rebound from September 28’s $196.87 low to September 30’s $326.12 high place the 23.6% level at $295.62, the 38.2% level at $276.75 and the 50% level at $261.50. The daily close sat between the first two levels, although the subsequent spot quote was back above $295.62.
The latest completed four-hour MACD line fell below its signal line, with the histogram turning from +0.32 to -1.28. Both lines remained above zero, distinguishing the loss of momentum relative to the signal from a move below the MACD baseline.
A daily reclaim of $295.62 would support another attempt at $318.36–$326.12. A confirmed break above $326.12 would reopen the September 27 high near $358.20. Failure to hold $276.75 would instead expose the September 30 low of $263.45 and nearby $261.50 retracement.
NEAR Recovers Toward Its September High
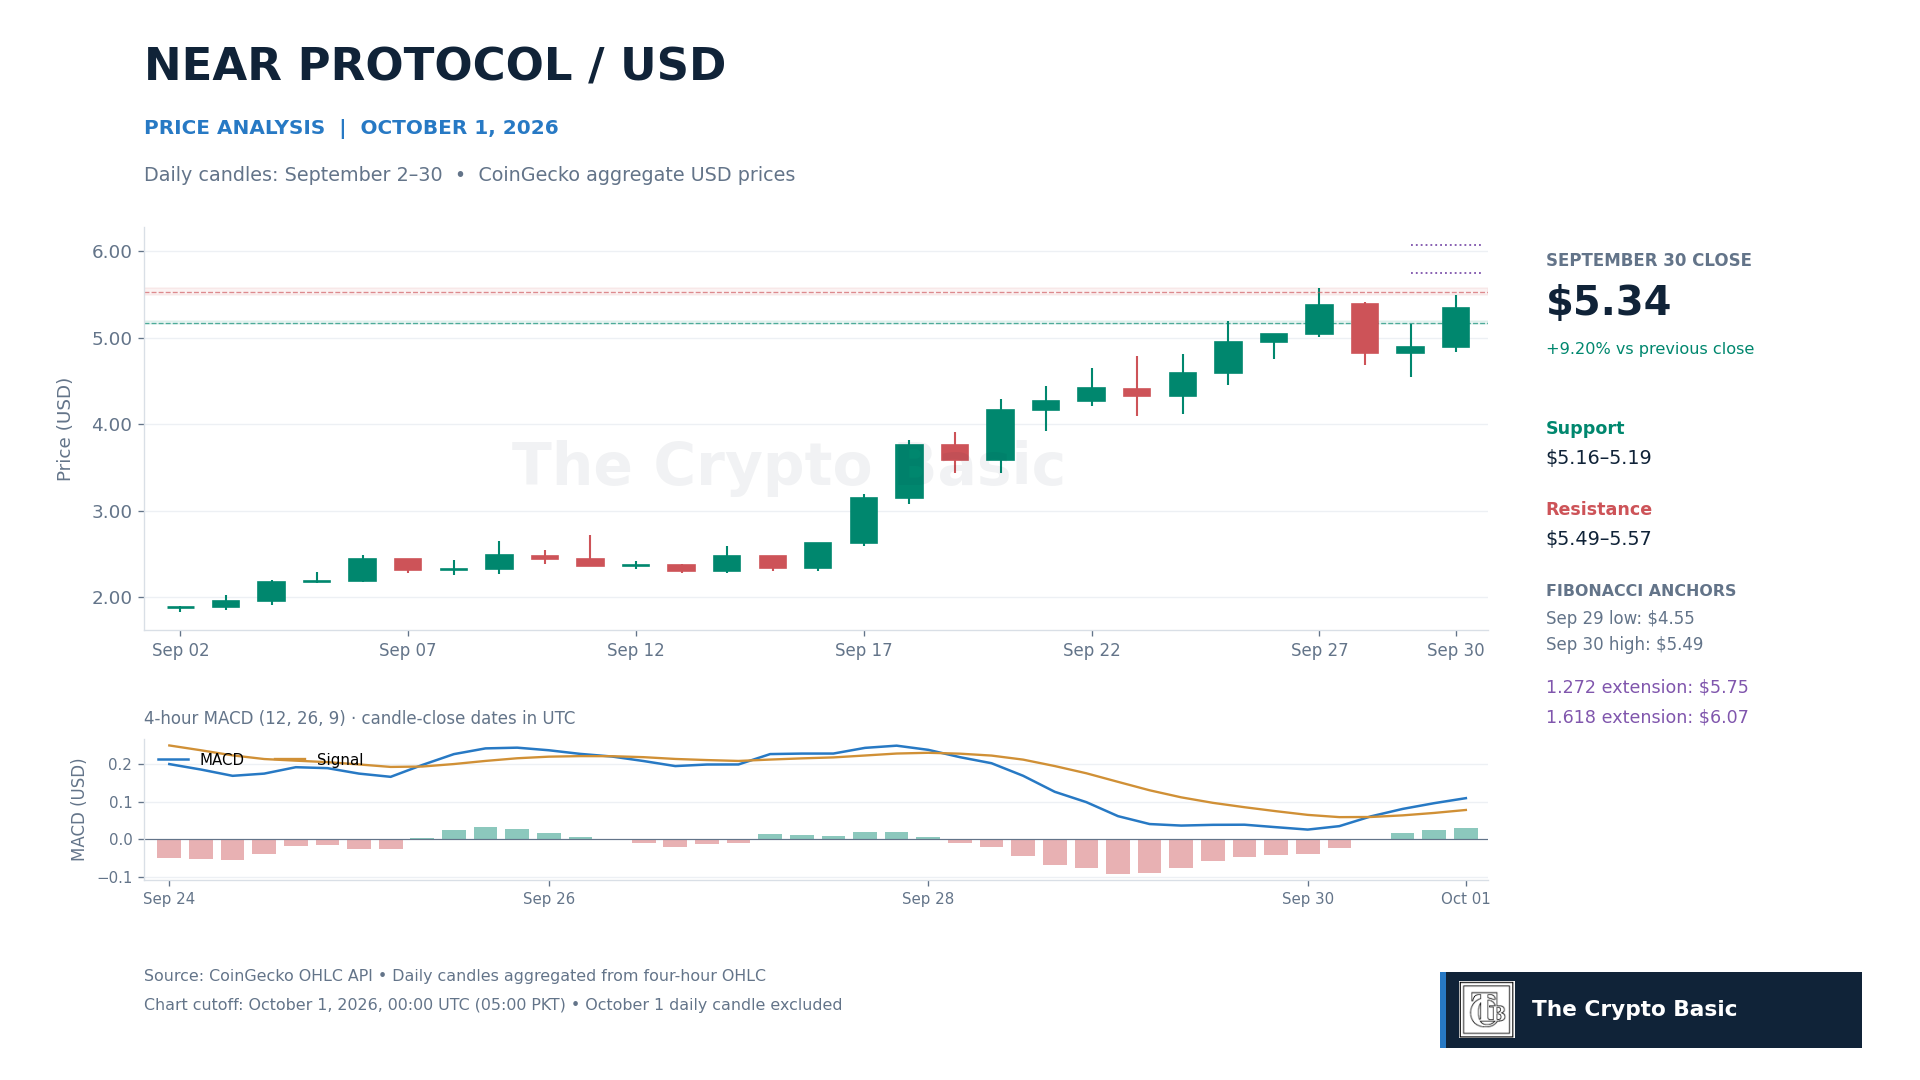
NEAR closed September 30 at $5.34, up 9.20% from $4.89. The session high of $5.49 remained below September 27’s $5.57 peak, so the rebound had not yet produced a confirmed breakout above the recent high.
Four-hour MACD showed improving momentum at the common chart cutoff. Its line stood near 0.109, above the 0.078 signal line, while the positive histogram increased from approximately 0.026 to 0.031. Unlike Bitcoin, both NEAR readings were above zero.
The $5.16–$5.19 area, containing earlier daily highs, is the first area to watch for a successful support retest. Holding above it would preserve the rebound toward $5.49–$5.57. A return below $5.16 would weaken the recovery, with the September 30 low at $4.84 and September 29 low at $4.55 providing lower reference points.
For a conditional upside scenario, two-point Fibonacci extensions of the recovery from September 29’s $4.55 low to September 30’s $5.49 high stand near $5.75 at 1.272 and $6.07 at 1.618. Those levels become relevant if NEAR first closes above $5.57 and holds the breakout area; they are projected extensions, not confirmed price destinations.