



XRP is back at a critical point in its recent price move, with the token trading between two levels that could decide where it goes next.
XRP climbed to nearly $1.70 in the week ending Aug. 17 after a strong run through mid-August. The rally then faded, and the token fell to $1.25 by mid-September.
However, buyers defended this area and helped XRP recover above $1.50, but the rebound hit another roadblock around $1.6569. From here, selling picked up again, pushing XRP to the current price of $1.48 at press time.
The Levels That Matter Most for XRP
Data from the weekly Bollinger Bands show how important the current price area has become. The bands have widened on the weekly chart as XRP has faced larger price swings in recent weeks.
The upper band now sits at $1.5815, just above the current price, which makes it the first major resistance XRP needs to clear if the recovery is to continue. The lower band remains at $1.24, a level that has already acted as support.
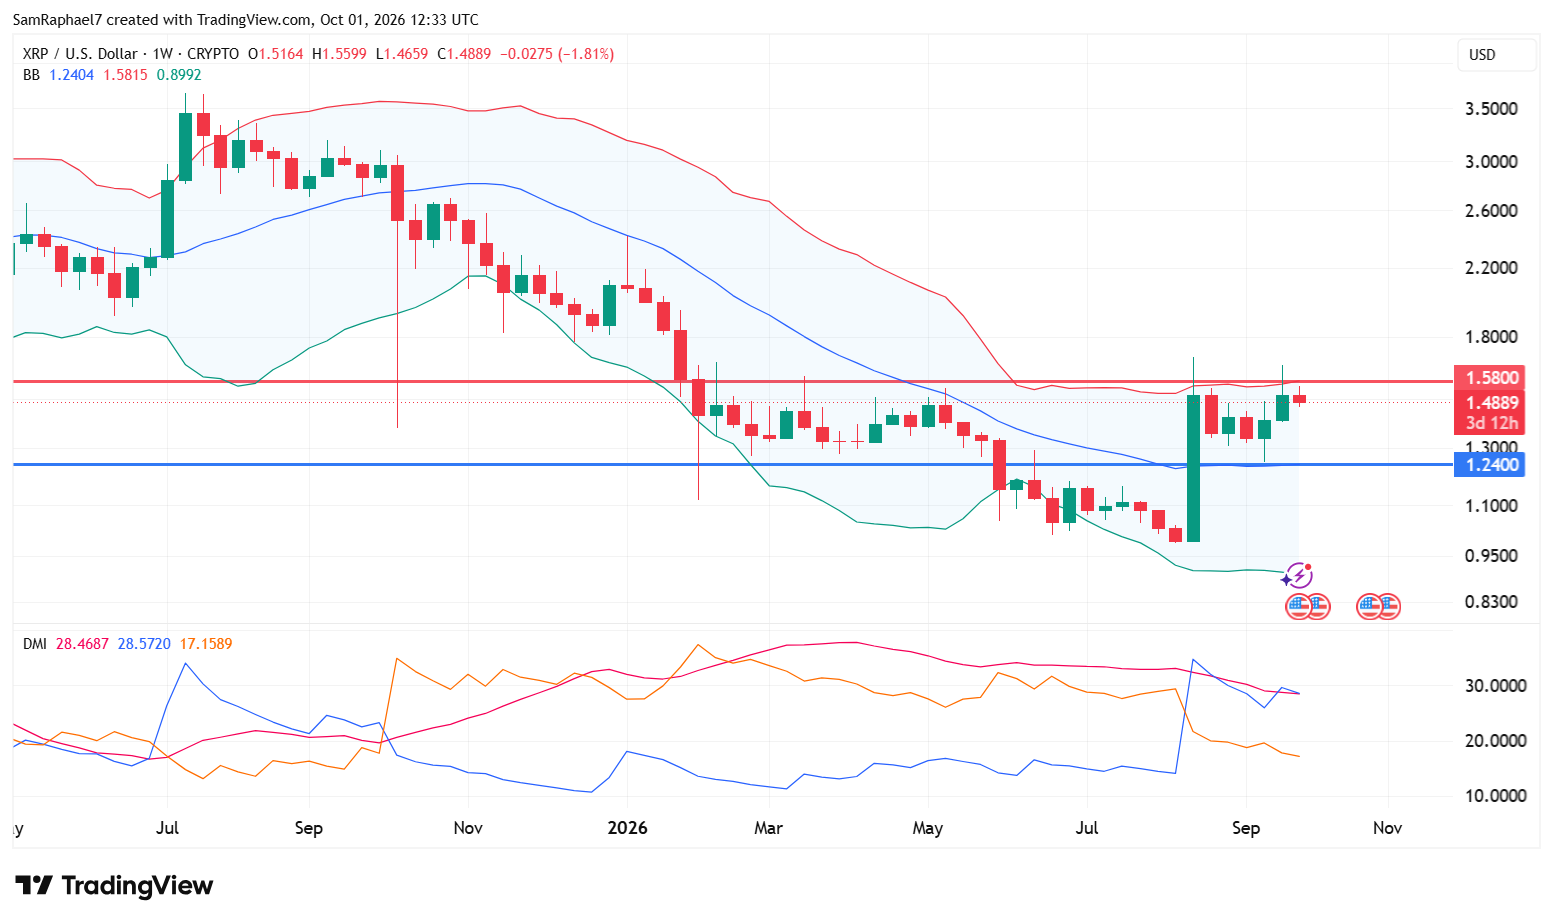
The $1.24 to $1.25 area became important during the selloff that followed the August peak. XRP fell into this range before buyers returned and helped push the token higher during the late-September rebound. This previous reaction makes the zone an important level to watch if XRP comes under further pressure.
For now, the more immediate level is $1.4466, which marks the daily lower Bollinger Band. If XRP falls below $1.4466, the $1.24 to $1.25 area could come back into view. A hold above $1.4466, however, would keep the $1.5815 resistance within reach and give buyers room to attempt another recovery.
XRP Directional Momentum Weakens
The weekly Directional Moving Index (DMI) shows that the strength behind XRP’s upward move has also weakened.
Specifically, the +DI stands at 28.57 and is moving lower, while the ADX sits at 28.46 and is also declining. The -DI, which measures downward pressure, holds around 17.15 and continues to trend lower as well.
The falling ADX suggests that the current trend is losing strength. At the same time, the decline in the +DI shows that buying pressure has weakened from earlier levels. Buyers still have the technical advantage because the +DI remains above the -DI, but that advantage is becoming smaller as XRP moves through the correction.
Momentum and Money Flow Flash Caution
Meanwhile, the daily MACD also shows a change in short-term momentum. The histogram recorded nine consecutive sessions of positive bars before recently turning negative as September came to a close.
Currently, the MACD line stands at 0.0424, while the signal line is at -0.0047. Although the MACD line remains slightly positive, the change in the histogram points to rising bearish momentum.
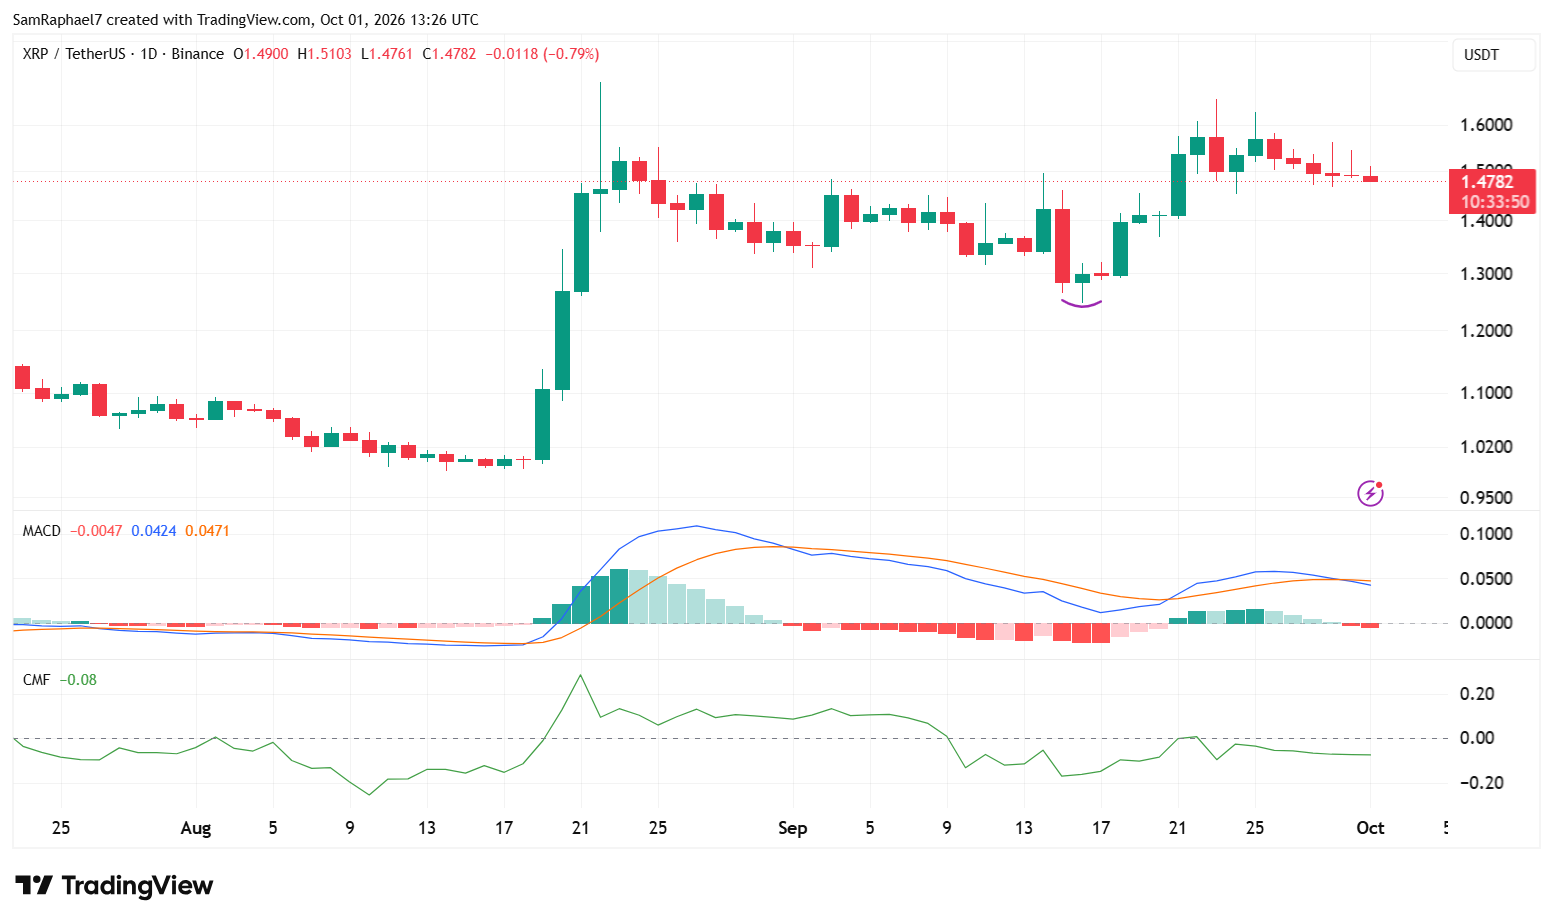
Also, the Chaikin Money Flow (CMF) on Binance’s daily chart reached 0.01 on Sept. 22 as buying pressure briefly improved, but it has since fallen to -0.08. The negative reading indicates stronger money outflows from XRP, adding to the selling pressure around the token.
What XRP Needs
XRP now needs to hold key support while trying to regain the resistance above it. A move back above $1.5815 would give buyers a stronger position and put $1.6569 back in focus. This level stopped the previous recovery and remains the next major barrier above $1.5815.
The risk increases if XRP loses $1.4466. Such a move would shift attention toward the $1.24 to $1.25 area, which has already stopped the token’s decline twice during this broader cycle. How XRP reacts at $1.4466 and $1.5815 should signal whether the current pullback can stabilize or sellers will push the price lower.