




XRP now faces a major test at the weekly Ichimoku Cloud after breaking above a falling channel that had controlled its price for about a year.
The breakout has improved XRP’s mid-term chart structure, but the cryptocurrency still needs to clear key resistance from the Ichimoku Cloud before the long-term trend can turn bullish.
XRP currently trades at $1.5138 and sits between several important technical levels. XRP has moved above two key Ichimoku lines that now provide support. It remains below the weekly Ichimoku Cloud.
XRP Moves Above Key Ichimoku Lines
For the uninitiated, the Ichimoku Kinko Hyo indicator uses five components to assess momentum, trend direction, support, and resistance.
On XRP’s weekly chart, the Tenkan-sen (or Conversion Line) and the Kijun-sen (or Base Line) both sit at $1.3426. This shows that short-term momentum and the medium-term trend are currently balanced.
XRP has moved above both lines and has treated them as support since the August 2026 rally. This represents a change from the falling structure that controlled much of the year.
Meanwhile, the Chikou Span also has a cautious reading. The indicator shows XRP’s closing price at $1.5138, 26 candles ago on the chart. This framing places XRP’s price action within a broader historical context. Its position is cautious to neutral, as XRP still faces resistance before it can confirm a new uptrend.
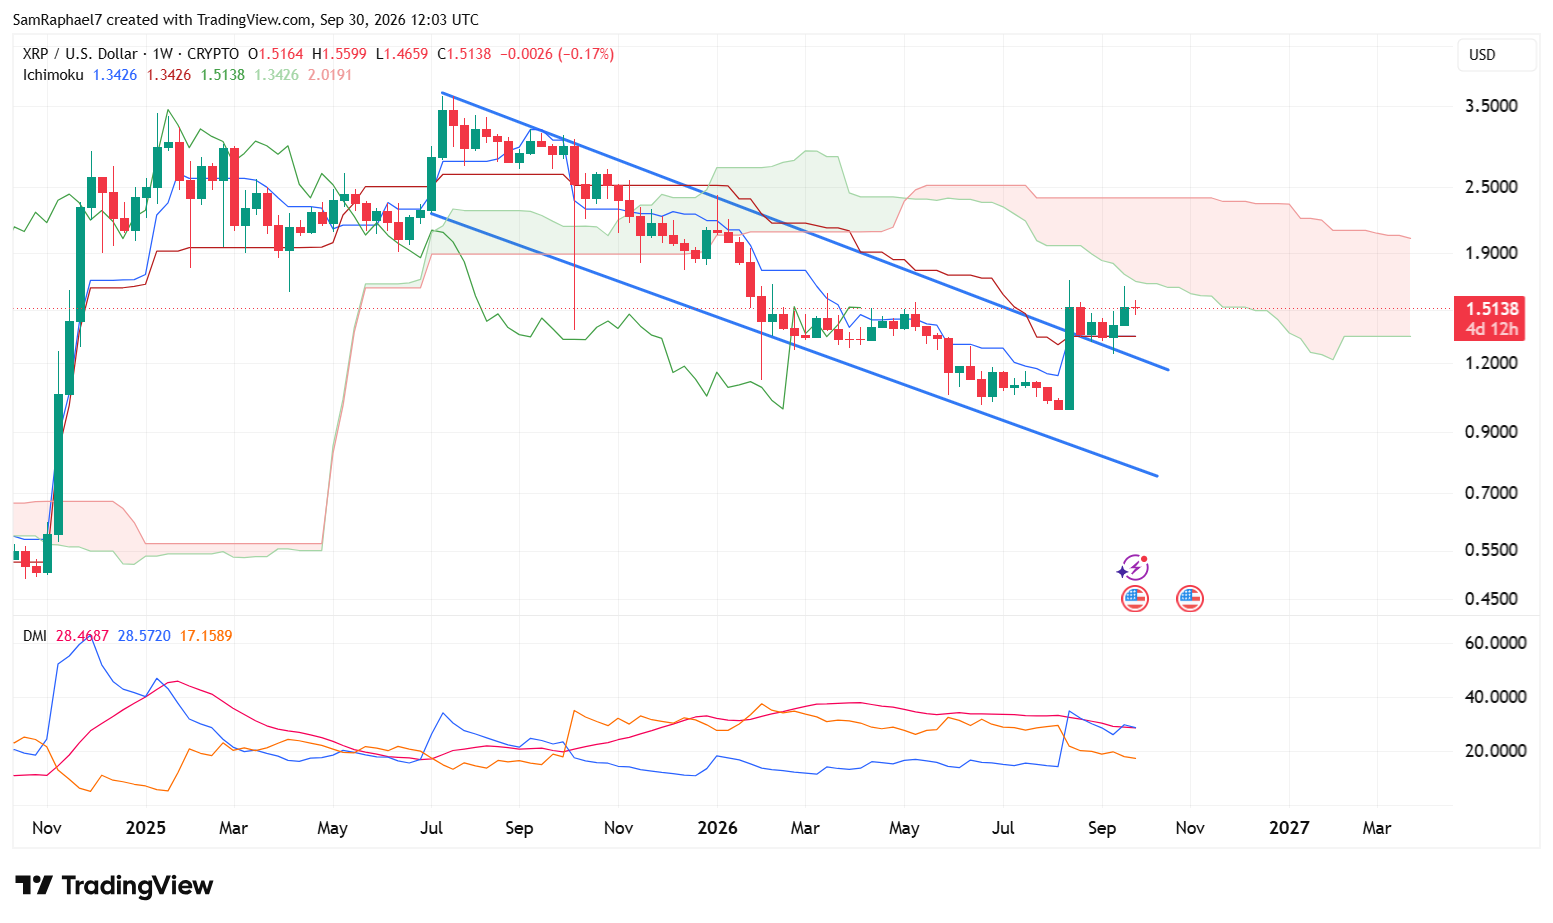
The weekly cloud is now the main obstacle. Senkou Span A and Senkou Span B form its two boundaries, with Senkou Span B currently at $2.0191. The cloud remains red above XRP, showing that the weekly chart still carries a bearish setup.
XRP must first move above the cloud’s lower boundary before it can challenge the $2.0191 Senkou Span B level. A weekly close above $2.0191 would mark an important change in the Ichimoku structure and put the long-term trend in XRP’s favor.
August Breakout Ends Year-Long Falling Channel
XRP’s longer-term chart shows a correction that began after the cryptocurrency reached its all-time high of $3.66 in early 2025.
A descending channel started to form in July 2025, with two falling trendlines containing XRP’s rallies and declines for roughly a year. The pattern produced a series of lower highs and lower lows as the broader crypto market weakened through late 2025 and into 2026.
This changed in August 2026 when XRP jumped 53% in a single week and broke above the channel’s upper trendline. The move ended more than a year of trading within the falling structure.
XRP then pulled back through September and returned to test the former upper trendline from above. The price held this level as support before recovering. This breakout, retest, and recovery sequence gives the channel breakout stronger technical support.
DMI Shows Bullish Pressure Losing Momentum
The Directional Movement Index shows that buyers still have the upper hand, although their momentum has slowed. XRP’s +DI stands at 28.57, above the -DI at 17.15. The gap between the two indicates that buying pressure remains stronger than selling pressure.
Both lines have gradually fallen from their August peaks. However, the -DI has declined alongside the +DI, which suggests that sellers have not taken control.
The ADX, which measures the strength of a trend regardless of its direction, currently stands at 28.46 and is also moving lower. This shows that the strong move XRP recorded in August has lost some of its force as the market enters a consolidation phase.
Essentially, the bullish trend is cooling, not actually reversing. If the ADX finds support and starts rising again while the +DI keeps its lead over the -DI, XRP could see stronger momentum return.
Key Levels to Watch
The $1.3426 area now serves as XRP’s main support zone. Both the Tenkan-sen and Kijun-sen meet at this level, while the broken upper boundary of the former falling channel bolsters support. This makes $1.3426 an important level for the current breakout structure.
A sustained drop below $1.3426 would weaken the breakout and raise doubts about whether XRP can maintain its move above the year-long falling channel.
On the upside, the weekly Ichimoku Cloud remains the next major hurdle. Its lower boundary marks the first significant resistance, while Senkou Span B at $2.0191 remains the key level on the weekly chart.