




Ali Martinez maps a long-term XRP setup toward this price, but the monthly chart first requires a confirmed close above major resistance at $3.66.
XRP is building a long-term ascending triangle on the monthly chart, according to trader Ali Martinez, with $3.66 acting as the level that must give way before the much larger $31.87 projection becomes relevant. XRP currently trades near $1.52, leaving price well below that breakout point.
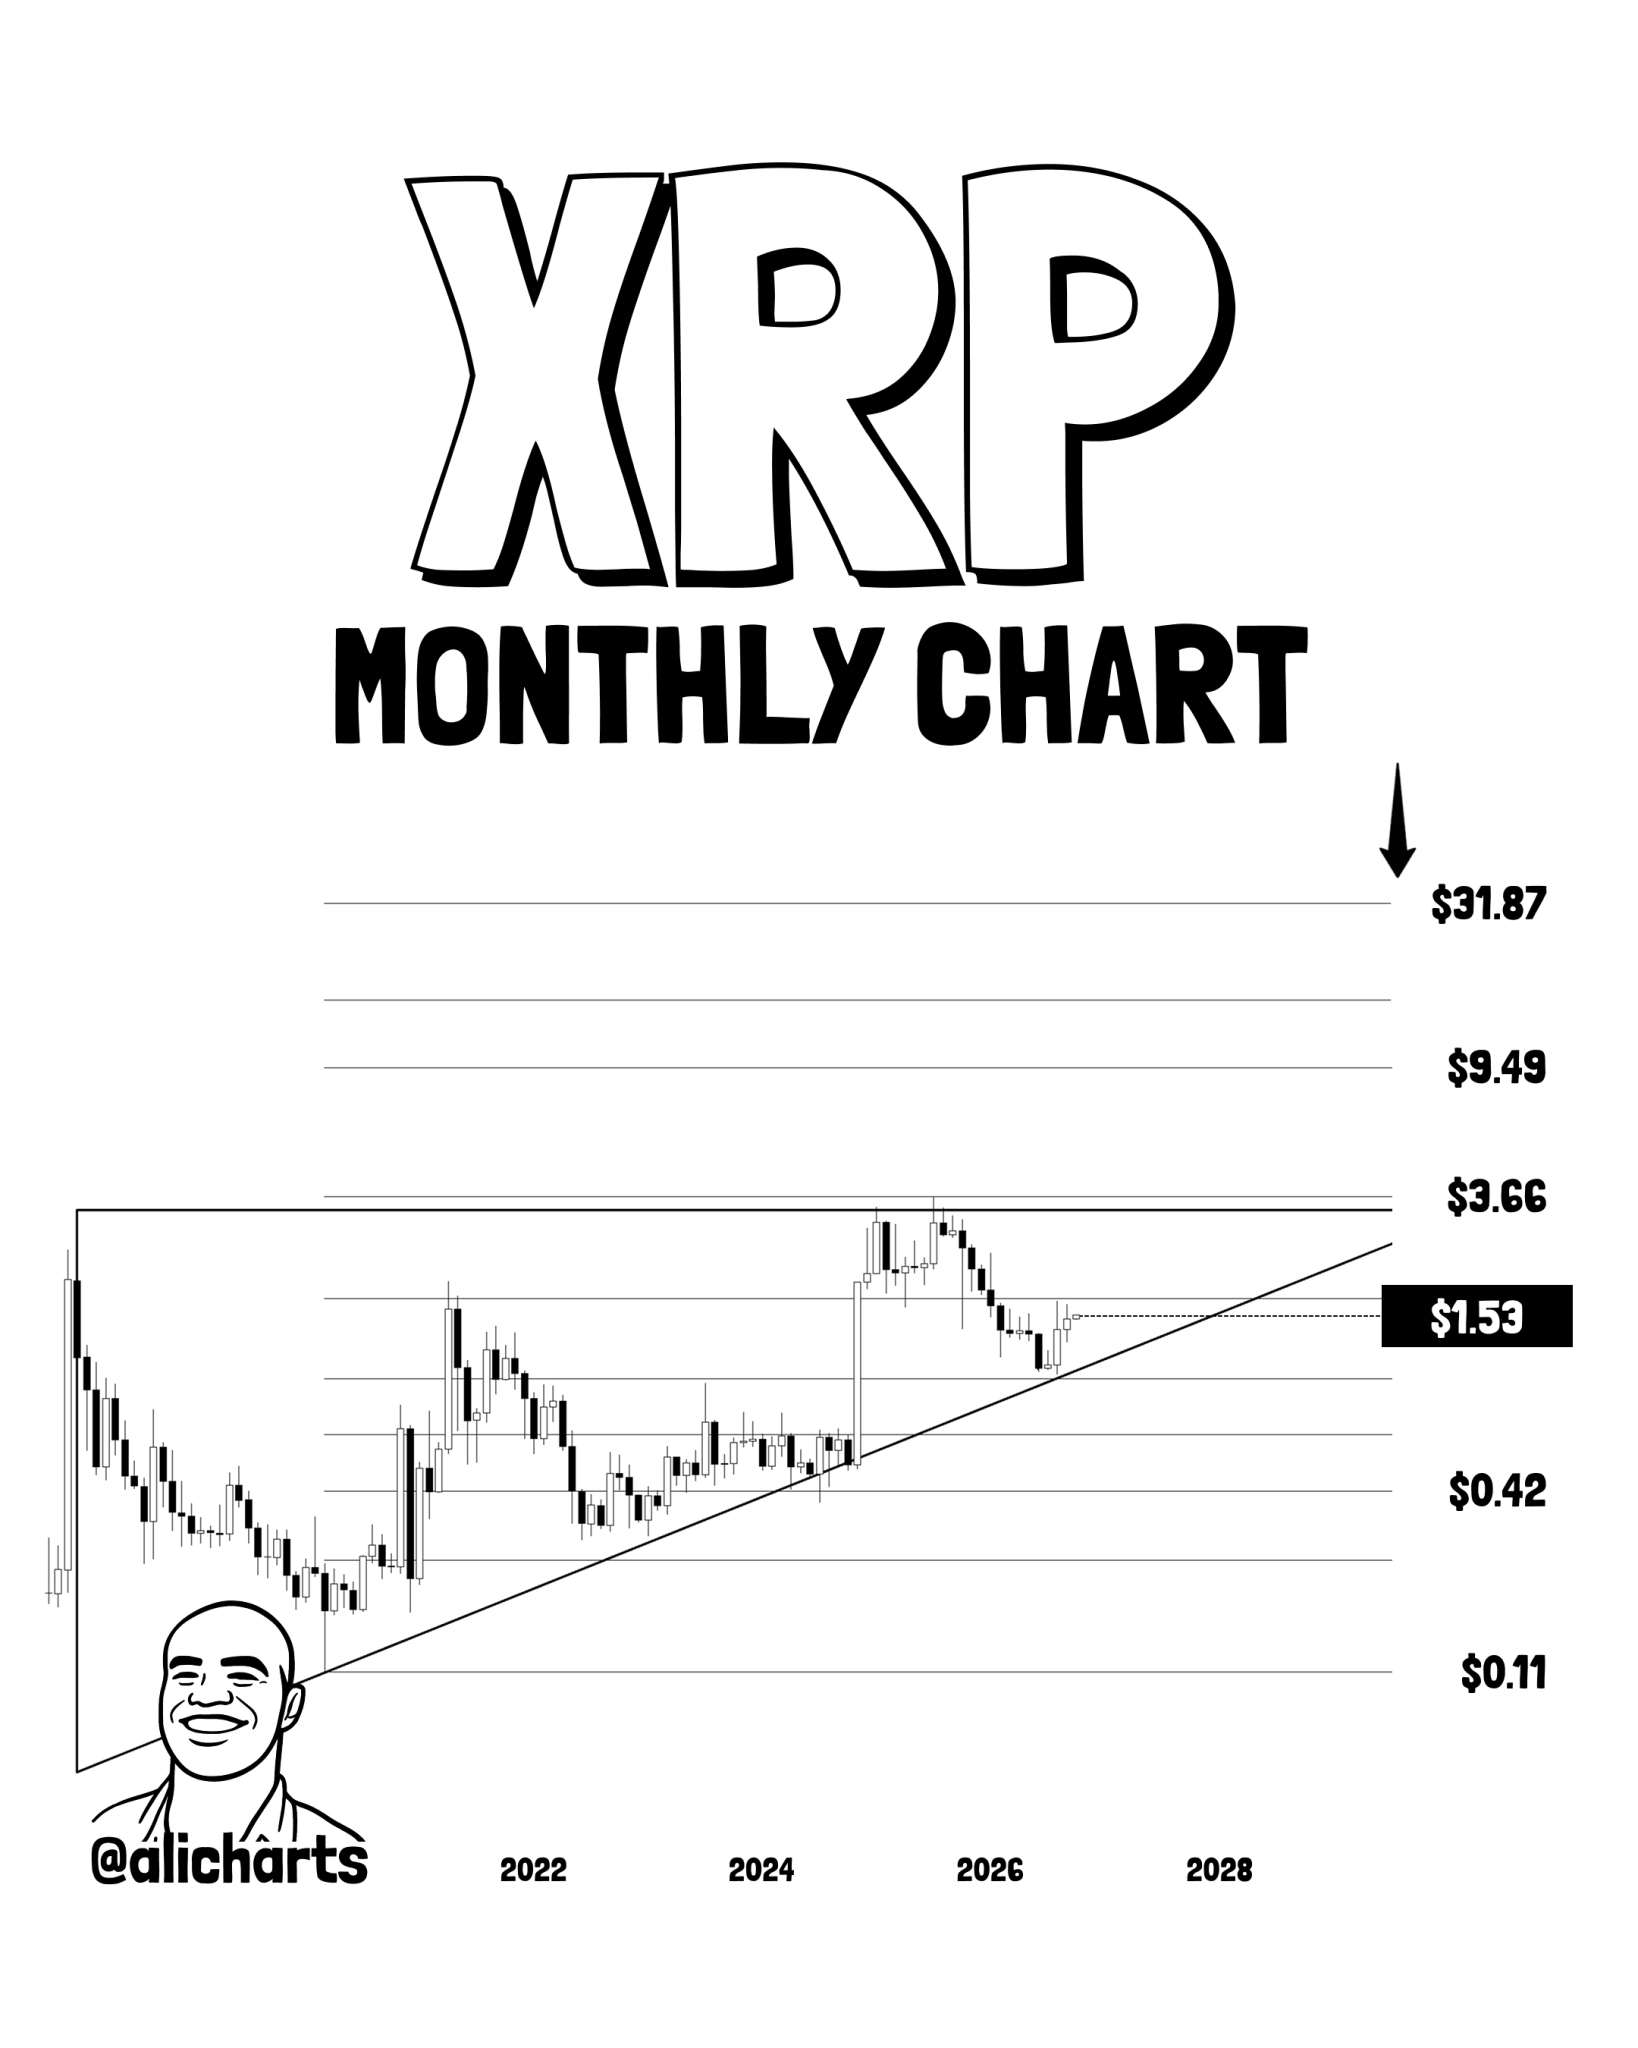
The setup is straightforward. XRP has repeatedly struggled around the same upper boundary while the lower side of the structure continues to rise. That combination — flat resistance and higher lows — is what gives the formation its ascending-triangle shape.
Martinez is not treating an intra-month spike above $3.66 as enough. His condition is a monthly close above the level.
XRP Still Has a Long Way to Reach $3.66
At roughly $1.52 today, XRP would need to climb about 141% to reach $3.66.
That resistance sits around the highs reached during XRP’s 2025 advance and remains the first major test in Martinez’s longer-term setup. Until buyers reclaim it on a monthly closing basis, the triangle has not broken out.
The other side of the formation is the rising support line. Price has continued to make higher long-term lows along that boundary, keeping pressure on the horizontal ceiling.
The chart also marks $0.42 and $0.11, but those are historical reference levels rather than nearby supports for XRP at its current price.
$9.49 Sits Between the Breakout and $31.87
If XRP eventually confirms the move above $3.66, Martinez’s chart places $9.49 as the next major level before the final projection near $31.87.
From today’s $1.52 price, $9.49 would represent an increase of roughly 524%. Reaching $31.87 would require a gain of about 1,997%, or nearly 21 times the current price.
Those percentages are our calculations from the current market price. Martinez’s chart itself identifies the levels rather than assigning a probability or deadline to them.
The structure therefore has a clear order. XRP first needs to recover more than $2 from current levels and close a month above $3.66. Only after that would the higher levels mapped on the chart begin to matter technically.
For now, the monthly resistance remains the barrier separating a developing long-term pattern from a confirmed breakout.