




Bitcoin and Ethereum retreat while Jupiter, Raydium and NEAR advance. October 8 charts map key support, resistance, and confirmation levels for five coins.
| Asset | Aggregate price | 24-hour change | Aggregate 24-hour volume |
|---|---|---|---|
| Bitcoin | $82,722 | -1.74% | $35.29 billion |
| Ethereum | $2,563.70 | -1.89% | $16.35 billion |
| Jupiter | $0.372271 | +13.64% | $141.87 million |
| Raydium | $2.43 | +9.54% | $218.16 million |
| NEAR Protocol | $5.33 | +7.92% | $1.08 billion |
Bitcoin RSI Falls Toward Neutral as Price Tests $82,720
Bitcoin closed October 7 at $83,276.10 on Kraken, down 2.65% from $85,542.10. The session fell from a $85,588.90 high to $82,720.30, erasing the preceding three completed candles’ recovery.
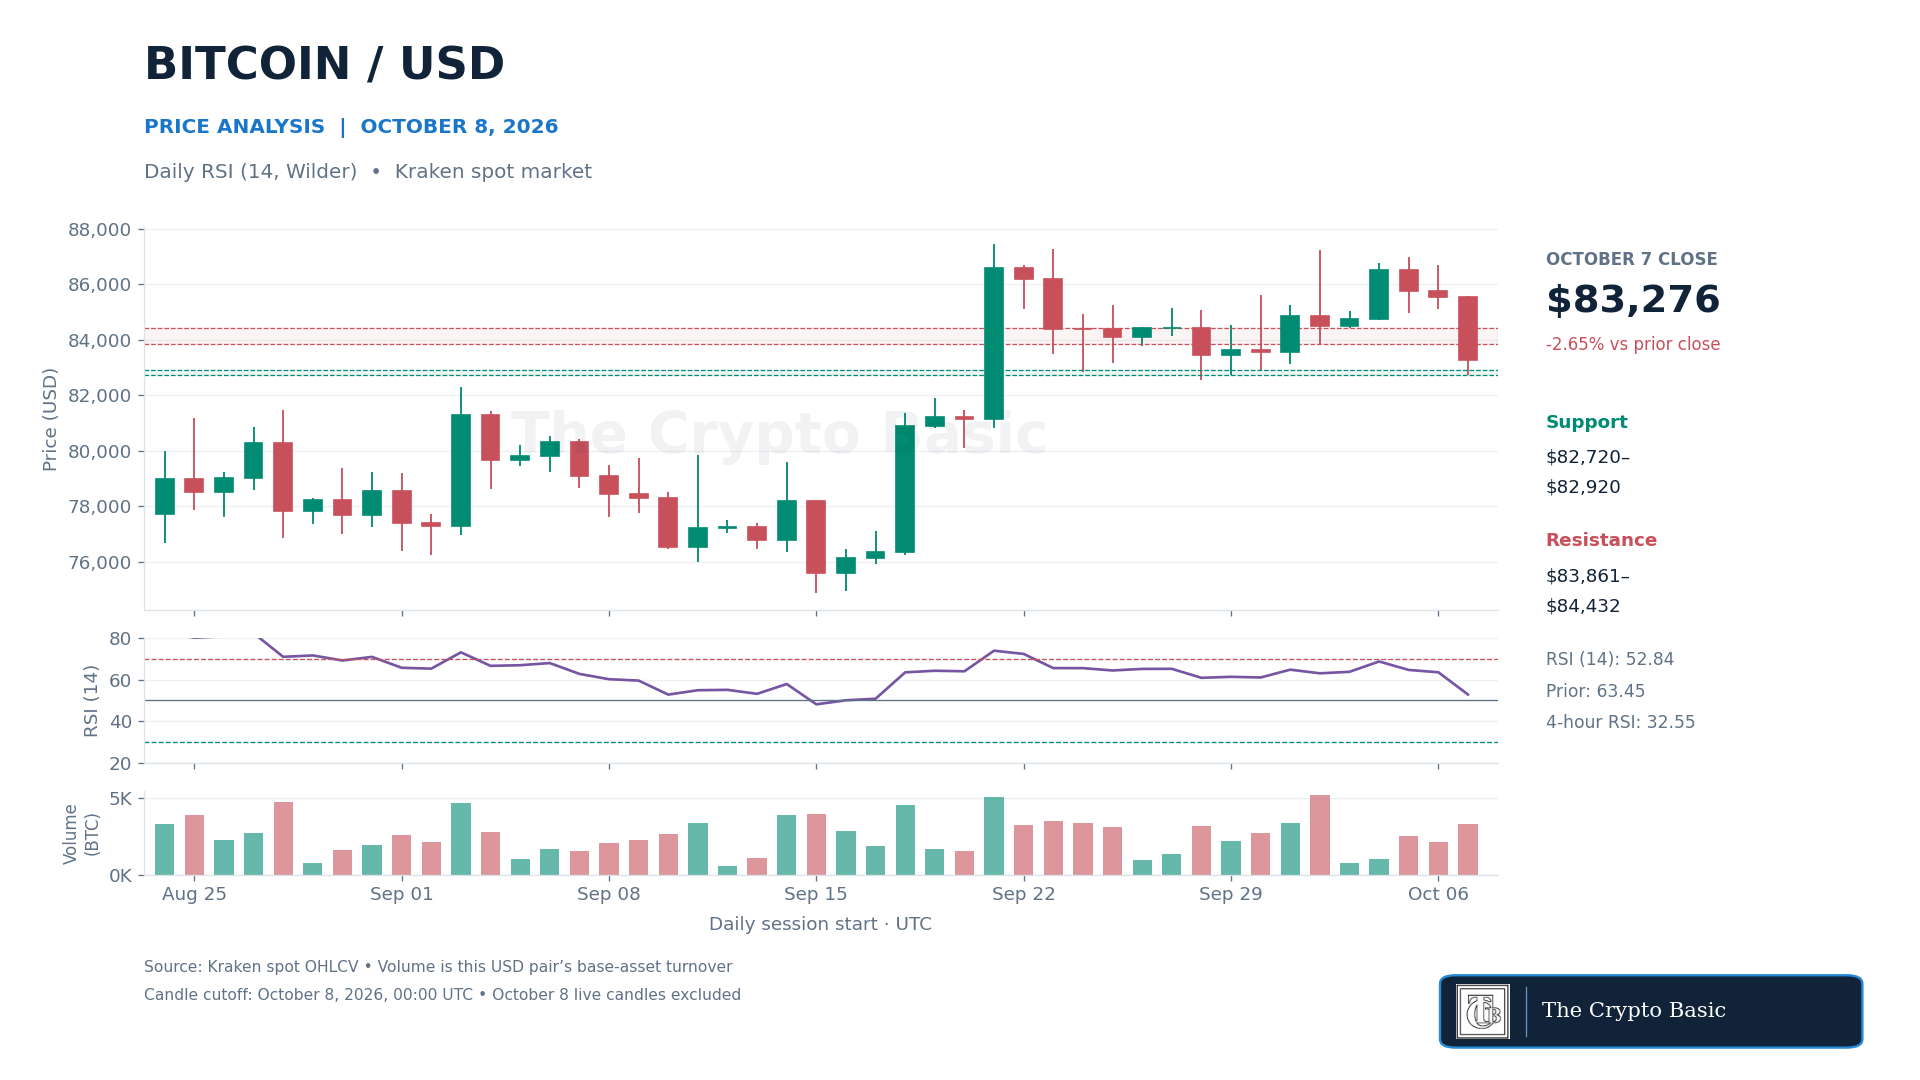
Daily RSI, calculated over 14 periods with Wilder smoothing, fell to 52.84 from 63.45. Momentum therefore remains slightly above the neutral 50 line, but the 10.61-point decline shows a substantial loss of strength.
The final completed four-hour candle carried an RSI of 32.55, placing short-term momentum close to the conventional oversold threshold without confirming a daily oversold condition.
The $82,720–$82,920 zone is the first completed-candle support area. CoinGecko’s $82,722 quote was testing its lower boundary at the cutoff.
A daily close below $82,720 would confirm a break and expose the September 28 low at $82,566, followed by the September 21 low near $80,840.
For recovery, BTC needs to reclaim $83,861–$84,432 on a daily close. Clearing that band would reopen $85,589 and the $86,683–$86,974 resistance cluster.
A move above $84,432 that subsequently closes below $83,861 would weaken the first bullish confirmation.
Compared with the October 6 aggregate snapshot of $85,489, Bitcoin was approximately 3.2% lower at today’s cutoff.
Ethereum Trades Below the First Fibonacci Recovery Level
Ethereum closed October 7 at $2,572.75, down 4.62% from $2,697.24. The candle reached $2,533.10 after opening at $2,697.15, producing the sharpest completed daily decline among today’s two core assets.
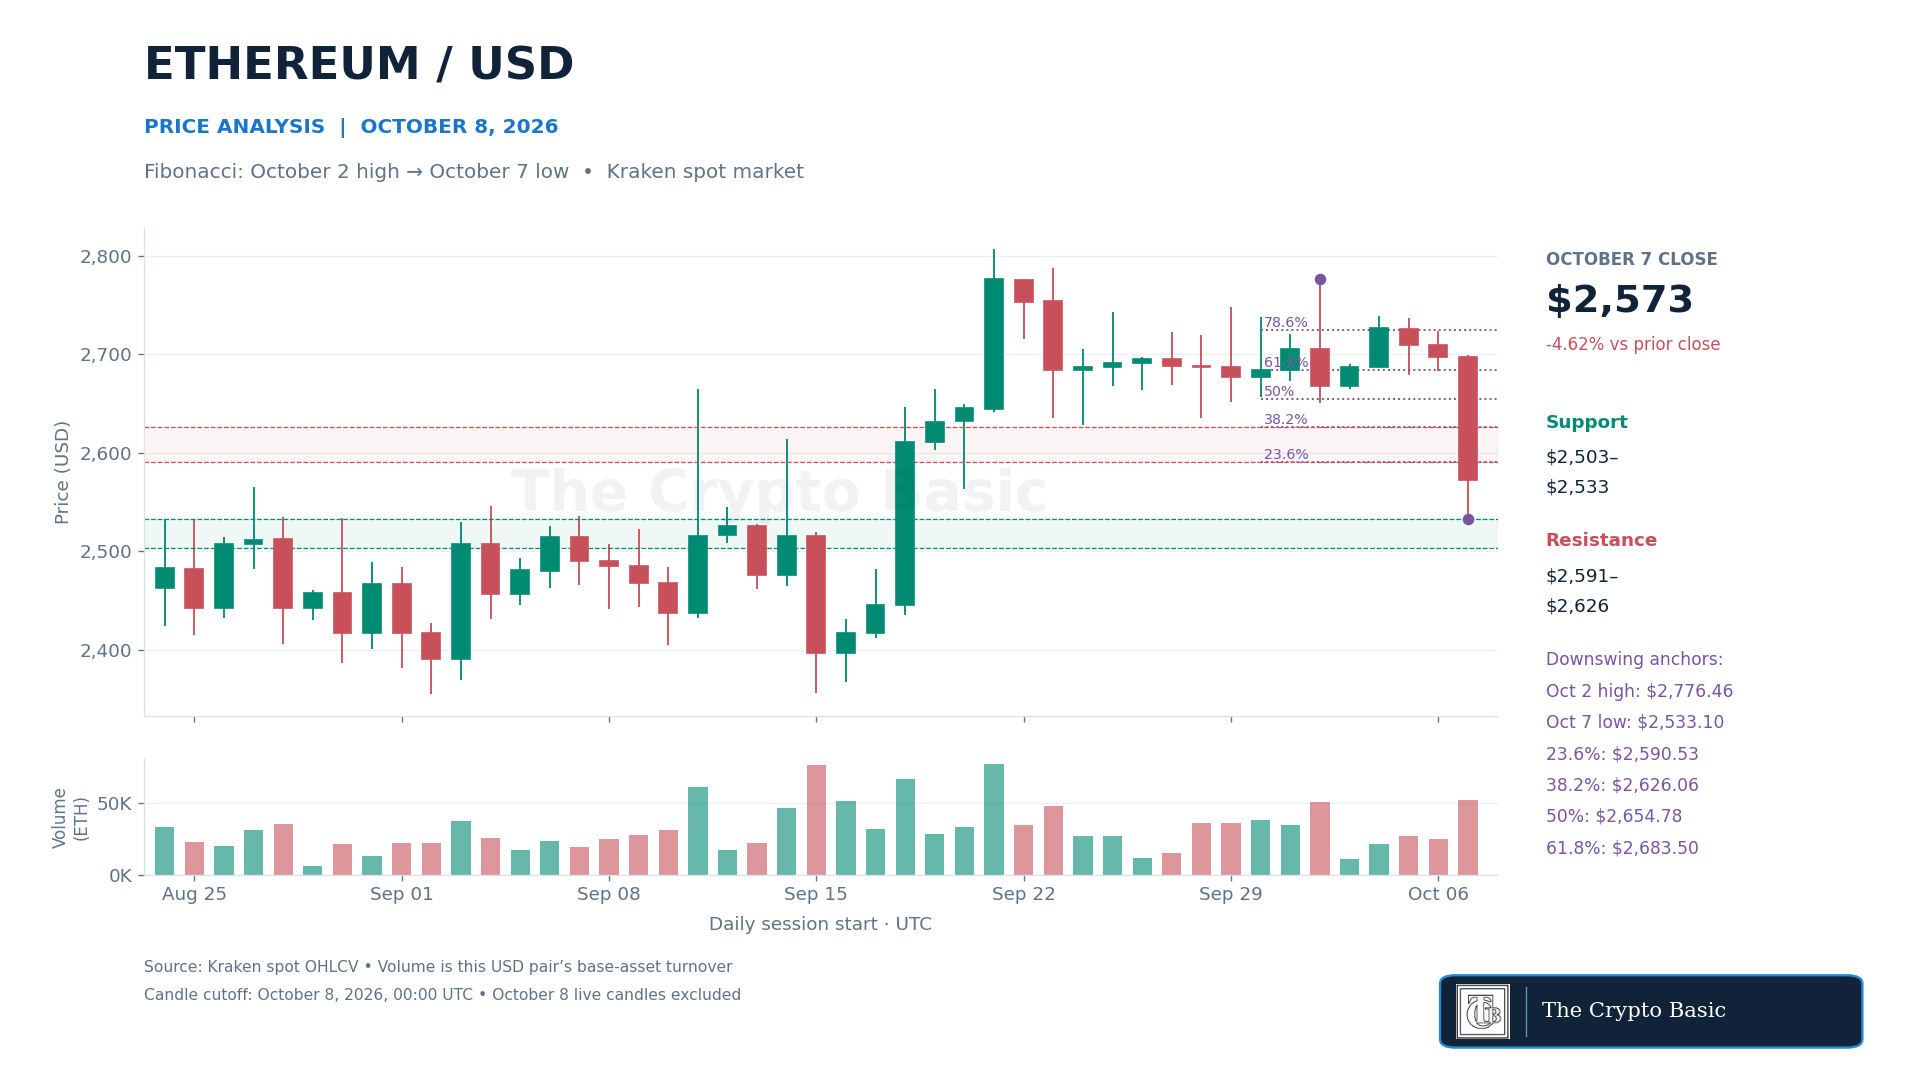
The Fibonacci map measures a prospective recovery of the downswing from the October 2 high of $2,776.46 to the October 7 low of $2,533.10.
The principal retracement levels are:
| Ratio | Price |
|---|---|
| 23.6% | $2,590.53 |
| 38.2% | $2,626.06 |
| 50% | $2,654.78 |
| 61.8% | $2,683.50 |
The completed close and the later $2,563.70 aggregate quote remained below the 23.6% level. A daily close above $2,590.53 would mark the first recovery step, while clearing $2,626.06 would strengthen the rebound toward the midpoint at $2,654.78.
A close back below $2,590 after an upside break would invalidate the initial signal.
On the downside, $2,533.10 is the immediate closing-confirmation level. Losing it would expose the $2,500 area, followed by the September 14–16 price structure around $2,465–$2,480.
The Fibonacci levels describe conditional recovery resistance; they are not projected outcomes.
ETH has declined about 1.9% from Wednesday’s $2,613.93 aggregate snapshot.
Jupiter Approaches Its Upper Bollinger Band Intraday
Jupiter closed October 7 at $0.35866, up 2.06% from $0.35142. The completed candle ranged from $0.31257 to $0.36006, recovering from an early decline but stopping below the September 27 high at $0.37472.
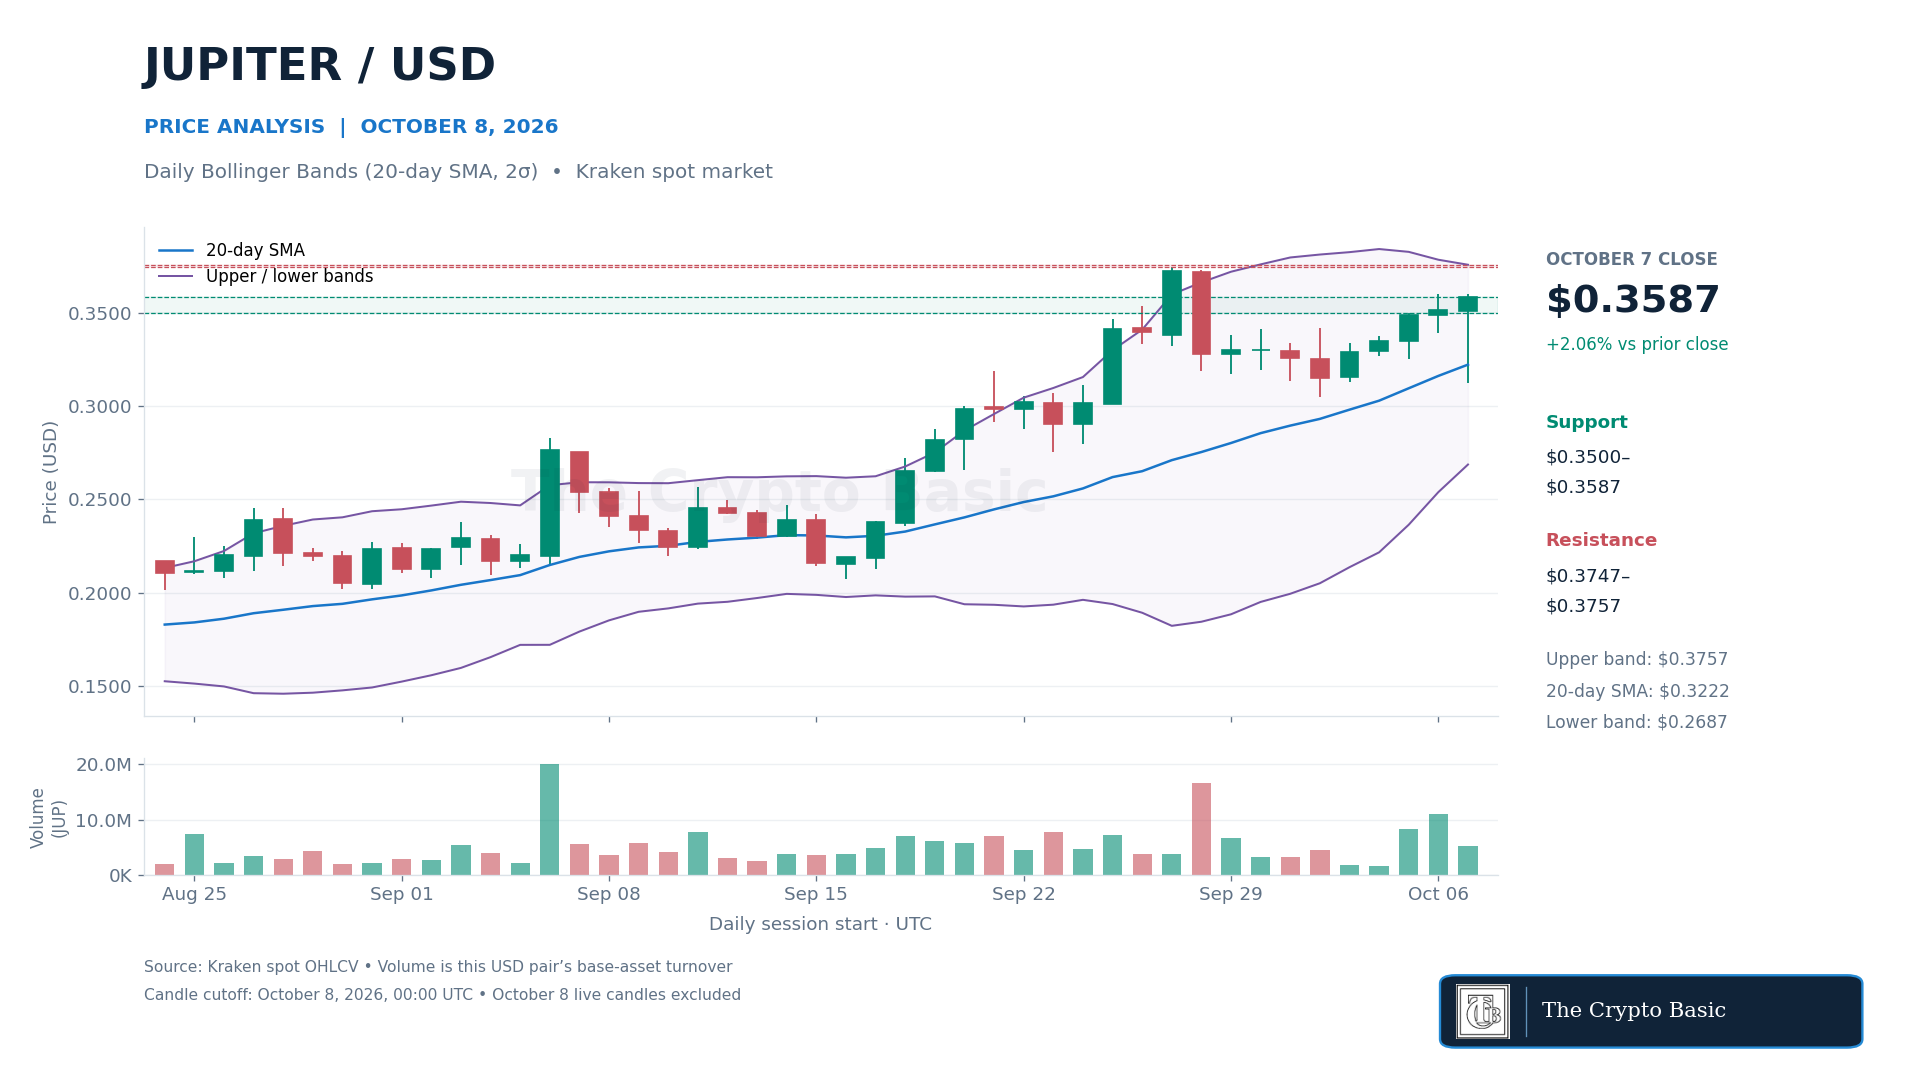
Daily Bollinger Bands, calculated with a 20-day simple moving average and two population standard deviations, place the midpoint at $0.32219, the upper band at $0.37571, and the lower band at $0.26867.
CoinGecko’s later $0.372271 quote approached the upper band, but that move remained intraday and does not confirm a daily breakout. CoinGecko placed JUP at rank 71 and reported a 24-hour range of approximately $0.3126–$0.3746 around the report window.
A daily close above the $0.37472–$0.37571 resistance cluster would clear both the recent swing high and the current upper band.
That would establish a new 30-day high and place the psychological $0.40 area in focus. Because Bollinger Bands change with every close, the band should be recalculated before treating it as a later target or invalidation level.
Failure to close above resistance would keep JUP range-bound. Initial support lies at $0.35000–$0.35866. A close below $0.350 would expose $0.32901 and the 20-day midpoint near $0.32219.
Losing the midpoint would invalidate the latest upper-range advance and shift attention toward $0.305.
Raydium Confirms a Bullish Daily MACD Crossover
Raydium closed October 7 at $2.469, up 12.74% from $2.190. The session traded as high as $2.568, establishing a new 30-day high before giving back part of the advance.
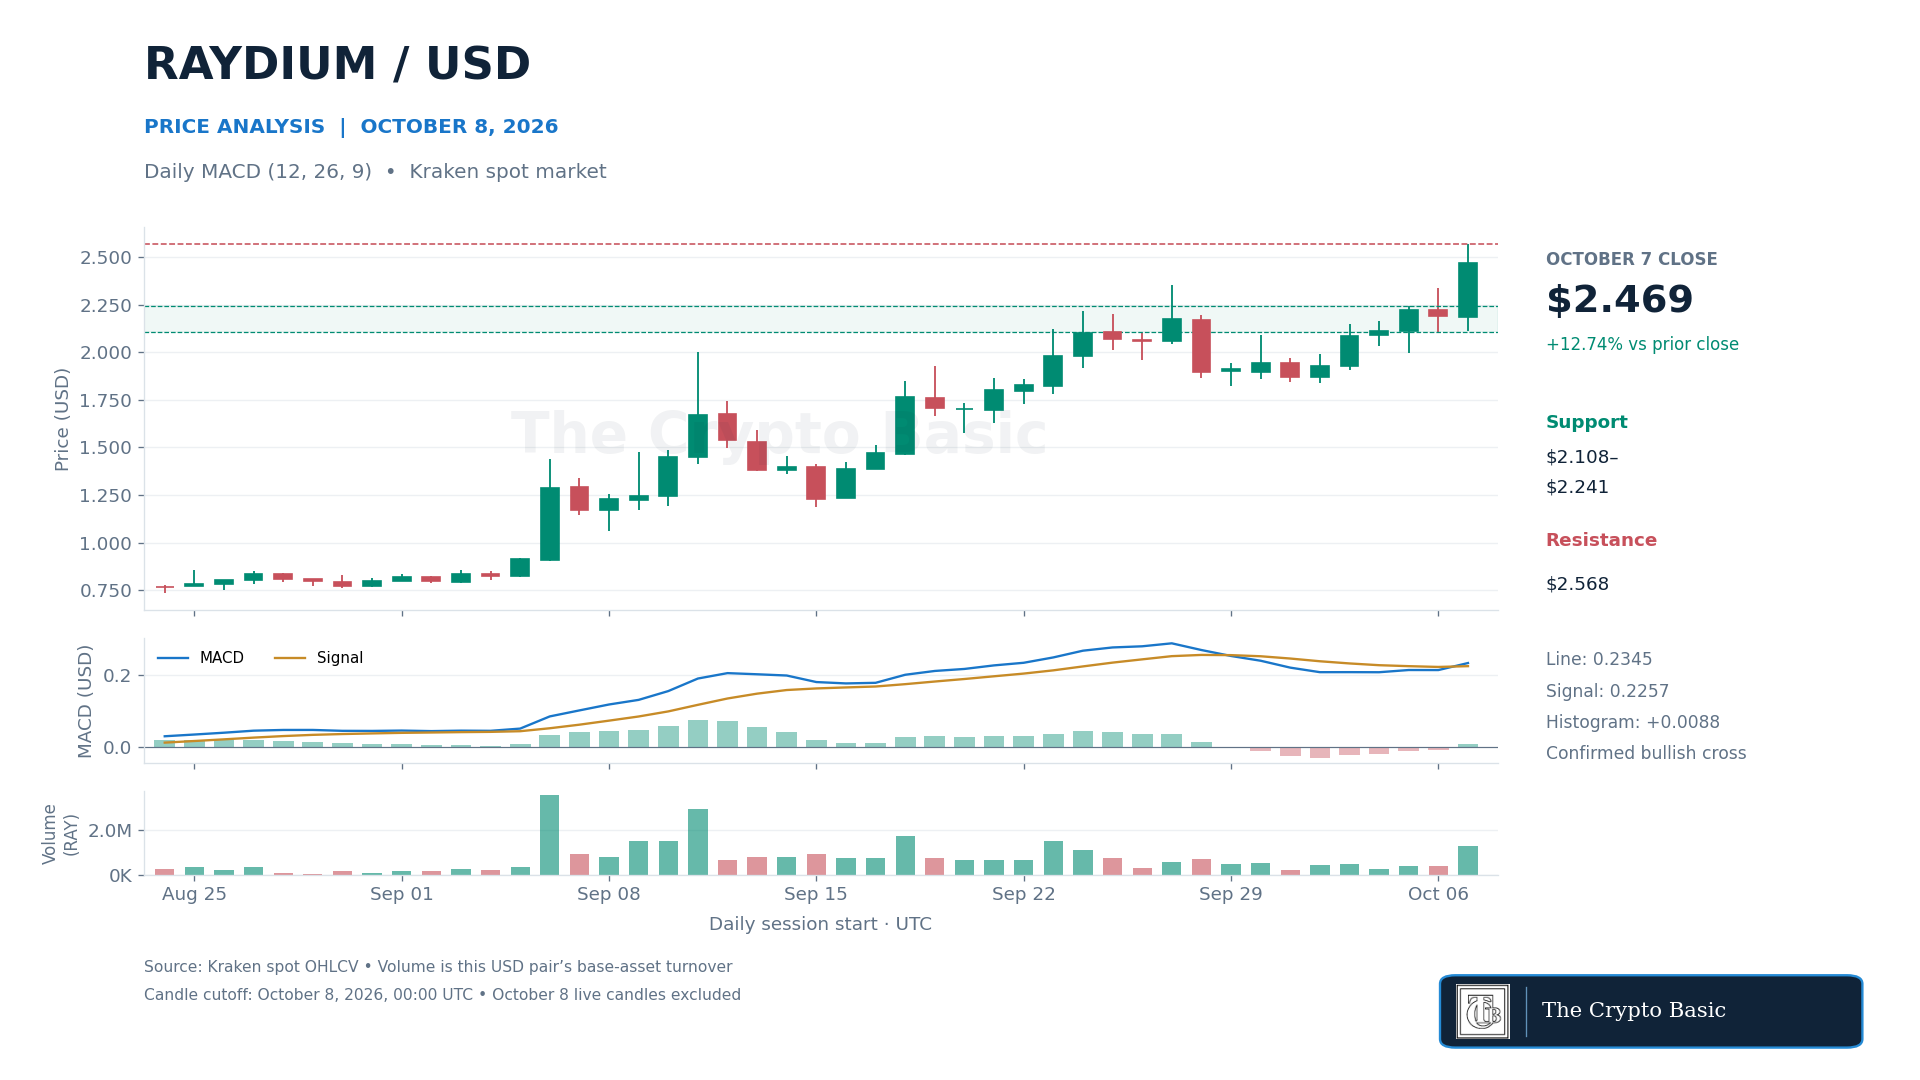
Daily MACD, using 12- and 26-period exponential moving averages with a nine-period signal line, confirmed a bullish line-signal crossover on the completed candle.
The MACD line rose to 0.2345 above the 0.2257 signal line, while the histogram changed from -0.0088 to +0.0088.
Both lines remain above zero, supporting a positive medium-term momentum reading.
The completed crossover does not confirm a price breakout above $2.568. RAY needs a daily close above that high to extend the structure.
Such a close would leave limited recent resistance and bring the older $2.65–$2.72 area into consideration. A return below $2.568 after a breakout would weaken that confirmation.
Support spans $2.108–$2.241, covering the latest two sessions’ lows and the October 5 close. A daily close below $2.108 would weaken the crossover’s price confirmation and expose $1.996, followed by $1.846–$1.868.
Raydium’s rank of 100 places it exactly at the eligibility boundary at the report cutoff; later ranking changes do not alter its cutoff qualification.
NEAR Holds Above Rising 20-Day and 50-Day EMAs
NEAR closed October 7 at $5.3349, up 5.18% from $5.0723. The candle traded between $4.89 and $5.4612, recovering from an intraday break below the preceding session’s low.
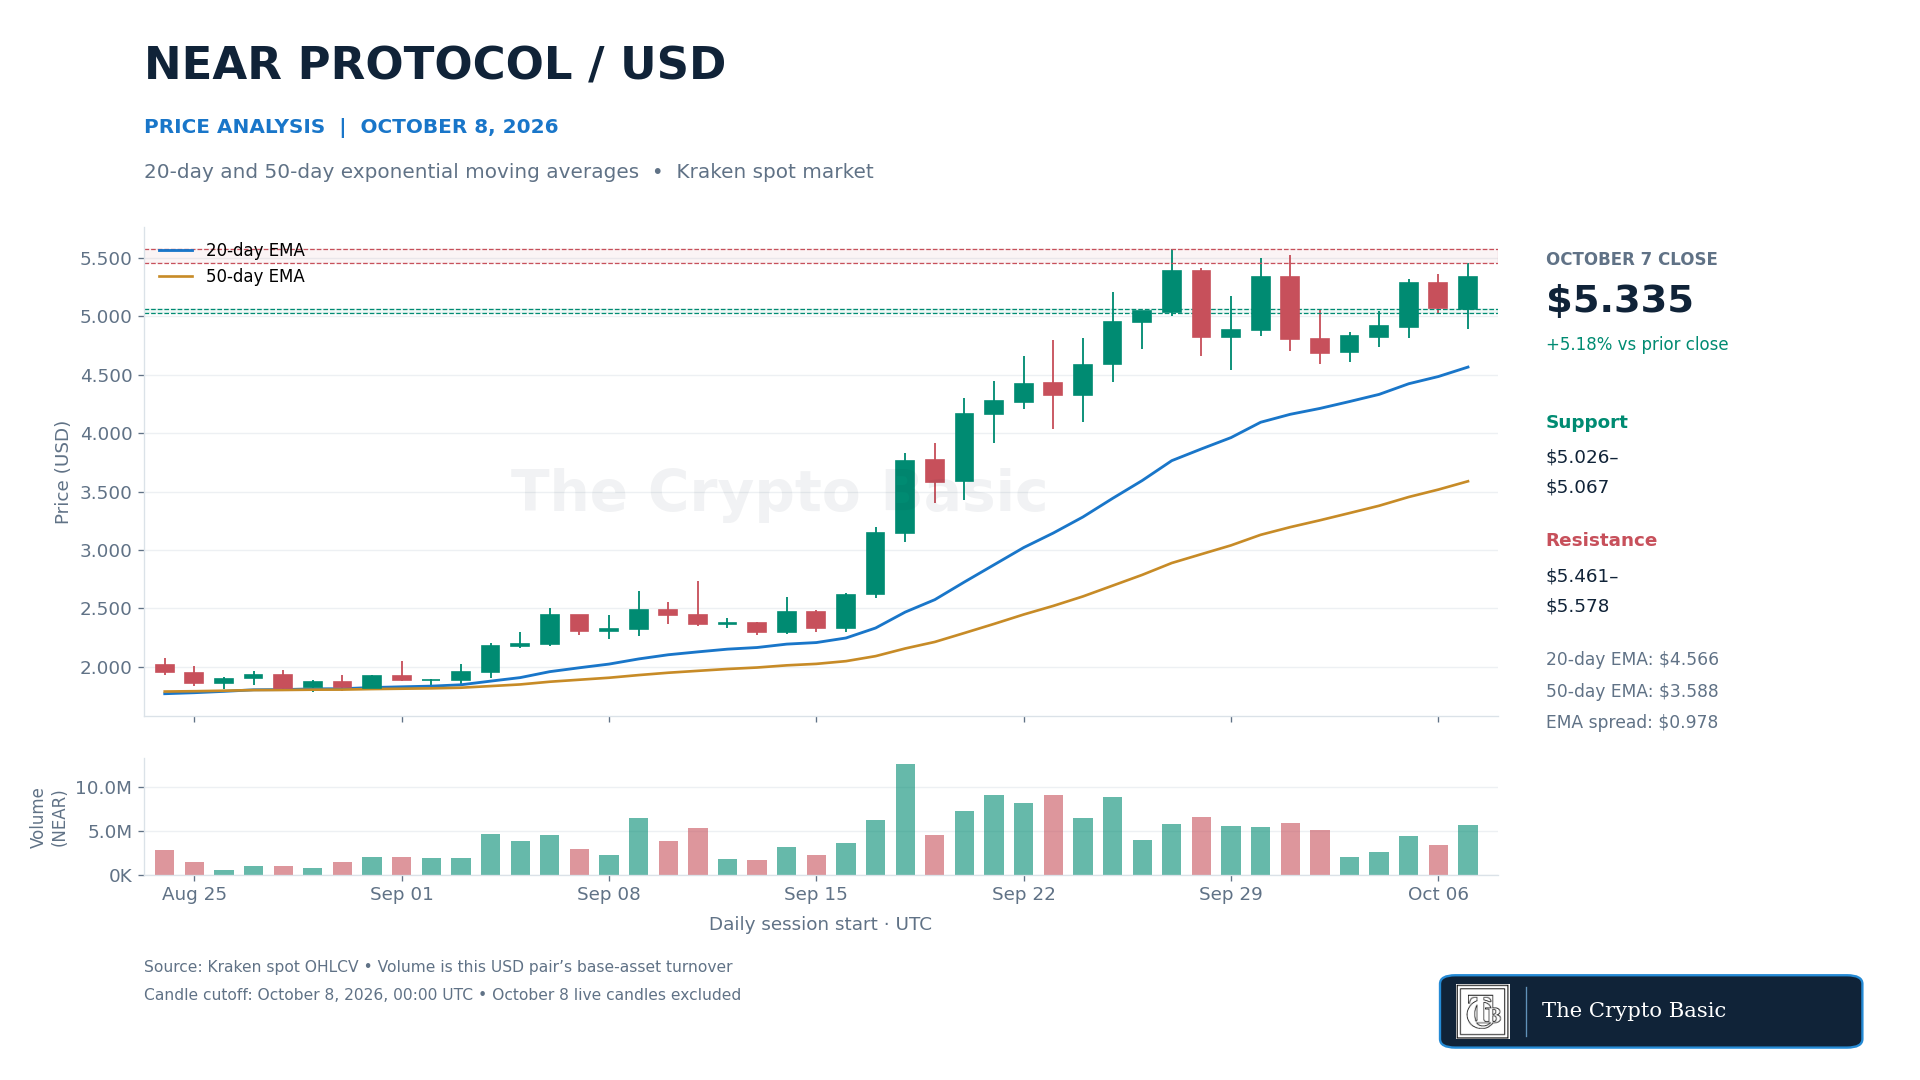
The 20-day exponential moving average rose to $4.5664, while the 50-day EMA advanced to $3.5883. Price remains above both rising averages, and the shorter average maintains a positive $0.9782 spread over the longer one.
On the four-hour chart, the latest completed close also held above the 20-period EMA at $5.1051 and the 50-period EMA at $4.9842.
Immediate resistance lies at $5.4612, followed by the September 27 high at $5.5778. A daily close above $5.5778 would establish a new 30-day high and reopen the $6 area.
A breakout that subsequently closes below $5.461 would lose its first layer of confirmation.
Support begins at $5.0258–$5.0674. A close below that zone would expose $4.89, followed by the October 2–3 lows at $4.5901–$4.6068. The rising 20-day EMA near $4.566 provides a deeper dynamic reference.
NEAR’s aggregate price has increased from $5.25 in the October 6 report to $5.33 today, while the late-September high remains unbroken.