




Cardano Monthly Chart Shows ADA Rebounding From Major Support as $0.59 Pivot Comes Into Focus.
Cardano is attempting to recover from one of its most important long-term support areas after ADA briefly fell toward the low-$0.13 to $0.15 region in June 2026.
The monthly chart shows price back near $0.22, but the broader structure remains under pressure, with ADA still trapped beneath a multi-year descending resistance line and well below the $0.594 pivot needed to strengthen a larger recovery.
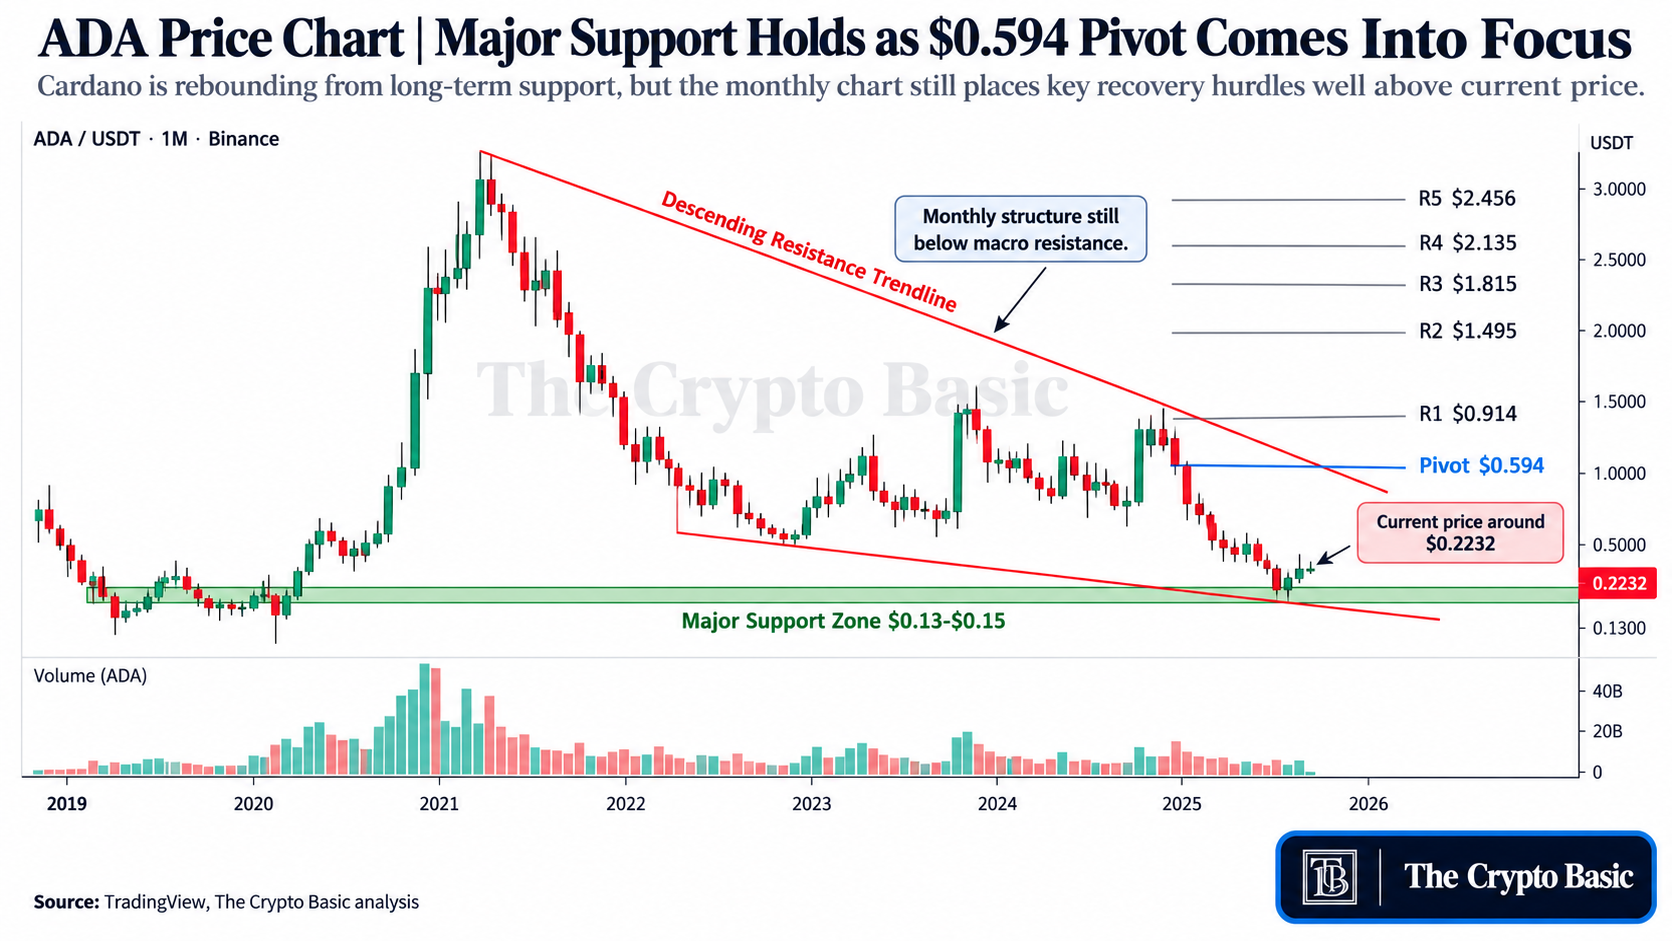
The Binance ADA/USDT monthly candle shown on the chart opened at $0.2465, reached a high of $0.2824, and fell as low as $0.2111 before trading around $0.2232. That leaves the candle down roughly 9.5%.
Despite the latest weakness, the more important development sits underneath price. ADA recently tested the lower portion of its long-term structure and has so far avoided breaking the major support established around the $0.13-$0.15 region.
ADA Is Still Inside a Multi-Year Descending Structure
The larger chart remains defined by lower highs.
A descending resistance line begins around Cardano’s 2021 peak above $3 and continues through subsequent cycle highs.
ADA’s 2025 recovery toward roughly $1.20 failed beneath this broader structure, after which price resumed its decline.
A second falling trendline underneath price forms the lower boundary of the structure. ADA recently approached this area before rebounding, leaving the current move looking more like an attempt to establish a long-term floor than a confirmed trend reversal.
For bulls, holding above the $0.13-$0.15 area is therefore important. Another sustained move below that region would expose the lower boundary and weaken the current base.
$0.594 Is the First Major Recovery Pivot
The chart’s traditional pivot levels provide a clear roadmap above current price.
The central pivot sits at $0.594. From $0.2232, ADA would need to gain roughly 166% just to reach that level.
That shows how much technical damage still needs to be repaired.
Above $0.594, the chart identifies:
- R1: $0.9141
- R2: $1.495
- R3: $1.815
- R4: $2.135
- R5: $2.456
These are not immediate price targets. They are progressively higher pivot resistance levels that would only become relevant if ADA first builds a durable recovery and breaks through the descending macro resistance.
The $0.91 area is especially notable because it overlaps with a region that previously attracted significant price activity.
Beyond that, $1.49 would mark a much larger recovery into the upper half of the long-term range.
Momentum Is Improving, but Not Yet Bullish
ADA’s monthly RSI is around 40.9, slightly below its accompanying average near 41.8.
That keeps momentum below the neutral 50 level, showing that the broader trend has not yet turned convincingly bullish.
The Stochastic RSI offers a slightly more constructive signal. Its readings sit around 22 and 15, with the indicator beginning to turn higher from the lower end of its range.
That can accompany an early rebound, but price confirmation is still required.
The volume profile also shows substantial historical activity below current price, particularly across the lower price bands, reinforcing the importance of the broader base.
For now, ADA’s monthly setup remains a support-recovery story rather than a breakout story. Holding the low-$0.10 support area would preserve the possibility of a larger bottom, while reclaiming $0.594 would be the first substantial sign that the multi-year decline is beginning to reverse.