




XRP’s 8.5-year cup-and-handle is nearing a key test, with support intact and $3.30 separating the current setup from a larger breakout.
XRP’s long-term chart is developing an approximately 8.5-year cup-and-handle structure, with Fibonacci extensions mapping potential upside levels at $8.47, $13.70 and $27.31 if the formation eventually confirms.
However, the chart does not suggest XRP can move directly toward those levels from its current price.
The developing handle remains incomplete, lower support zones are still relevant, and XRP would ultimately need to overcome the roughly $3.30 neckline before the larger bullish structure could be considered confirmed.
XRP is currently trading near $1.29, below the approximately $1.47 price shown when the attached chart was captured.
XRP’s Cup Has Been Developing Since the 2018 Peak
The blue structure on the chart traces XRP’s long decline and recovery following its 2018 cycle high.
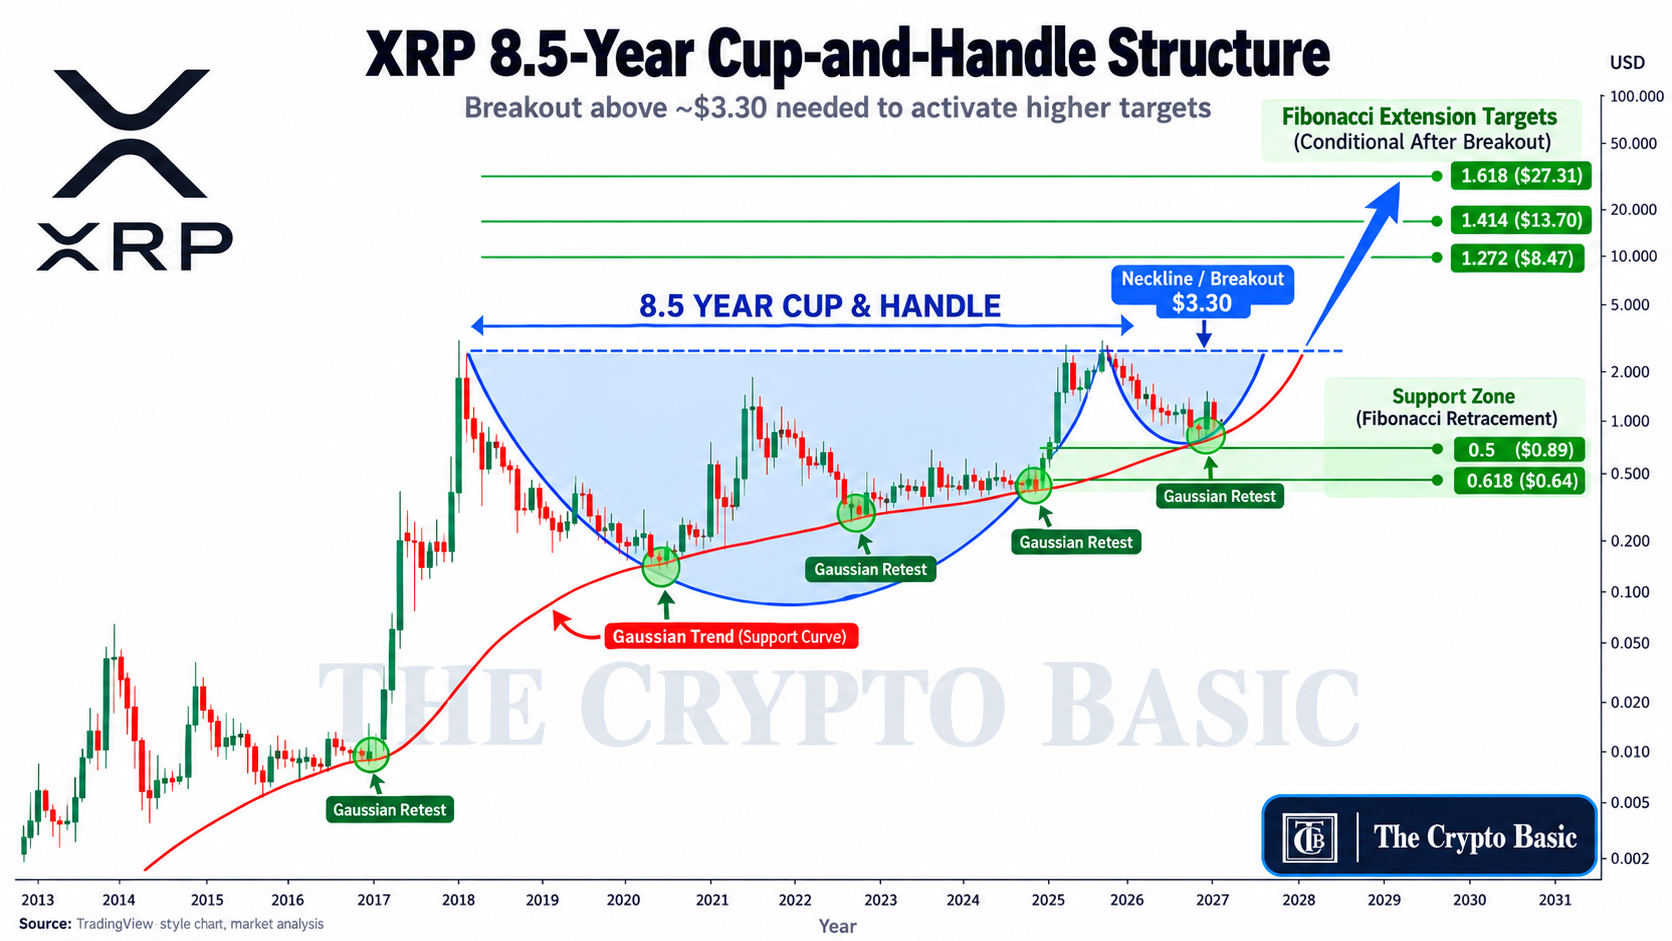
Prices initially collapsed from the previous peak before spending several years establishing a rounded base. XRP then gradually recovered through subsequent cycles, eventually returning toward the same upper price region during the 2025 advance.
That creates the broad cup portion of the formation.
The upper boundary sits around the $3.30 region. In a conventional cup-and-handle interpretation, that level functions as the neckline or breakout barrier. Until XRP clears that area convincingly, the chart remains a developing structure rather than a completed bullish breakout.
The decline following the 2025 peak represents the potential handle.
Rather than requiring price to move immediately higher, a handle normally involves a retracement or consolidation beneath the previous high before another breakout attempt.
$0.89 and $0.64 Form the Main Support Zone
The chart identifies two Fibonacci retracement levels beneath the current market.
The first sits at the 0.5 Fibonacci retracement near $0.89426, while the deeper 0.618 retracement appears near $0.64245.
These levels form the green support zone highlighted on the right side of the chart.
From XRP’s current price around $1.29, a move to $0.89 would represent approximately 31% downside, while a decline to $0.64 would amount to roughly 50%, based on our calculations.
A drop into this region would therefore be substantial, but under the chart’s interpretation, it would not automatically destroy the multi-year cup-and-handle setup. Instead, the zone is presented as a possible area where the handle could establish its eventual low.
A decisive failure below the deeper support would weaken the structure considerably.
Gaussian Retests Have Repeated Across XRP’s Long-Term Trend
Another important element is the rising red curve running beneath XRP’s long-term price action.
The chart highlights several historical interactions with this Gaussian trend measure, including retests around the 2017, 2020, 2022-2023 and 2025 periods.
Green circles mark areas where XRP approached or interacted with this long-term support before subsequently moving higher.
The current projection suggests XRP could again approach the rising Gaussian area while completing the handle.
This does not establish that another rebound must occur. Rather, the repeated historical retests are being used to identify a potential confluence between the long-term trend line and the Fibonacci support region.
XRP Must Break $3.30 Before $8.47 Comes Into Play
The most important bullish confirmation lies well above current prices.
XRP would first need to recover from the developing handle and break through the approximately $3.30 neckline.
At today’s price near $1.29, XRP would need to gain roughly 156% just to reach that region.
Only after a sustained neckline breakout would the Fibonacci extension levels become meaningful as technical upside objectives.
The chart maps:
- 1.272 extension: $8.47291
- 1.414 extension: $13.69688
- 1.618 extension: $27.30768
These same levels have previously been identified in coverage of this long-term XRP structure.
From the current price, those levels would represent extremely large advances. However, they are technical extensions rather than forecasts with fixed timelines or guaranteed outcomes.
The sequence therefore matters more than the targets themselves.
XRP first needs to preserve the handle structure, avoid losing the deeper $0.64 support region, recover toward the prior highs and eventually establish a breakout above roughly $3.30. Without that neckline confirmation, the $8.47, $13.70 and $27.31 levels remain conditional projections rather than activated targets.