




Bitcoin has recorded three consecutive weekly losses for the first time since May 2026, raising concerns that BTC could repeat the sharp correction that followed a similar pattern earlier this year.
Crypto trader ‘That Martini Guy’ highlighted the development, noting that Bitcoin was approaching its third consecutive red weekly candle. He also drew attention to the previous occurrence in May, when a similar losing streak preceded a complete retracement of Bitcoin’s early second-quarter rally.
Bitcoin Records Three Consecutive Weekly Losses
Bitcoin’s latest downturn has now extended across three consecutive weeks as of the time of writing. During the first losing week, from October 5 to October 11, BTC fell from an opening price of $86,490 to close at $83,679.
The selling pressure continued the following week, from October 12 to October 18, pushing Bitcoin down to $82,002. Subsequently, the third consecutive weekly decline, spanning October 19 to October 25, drove the cryptocurrency further lower to $80,048.
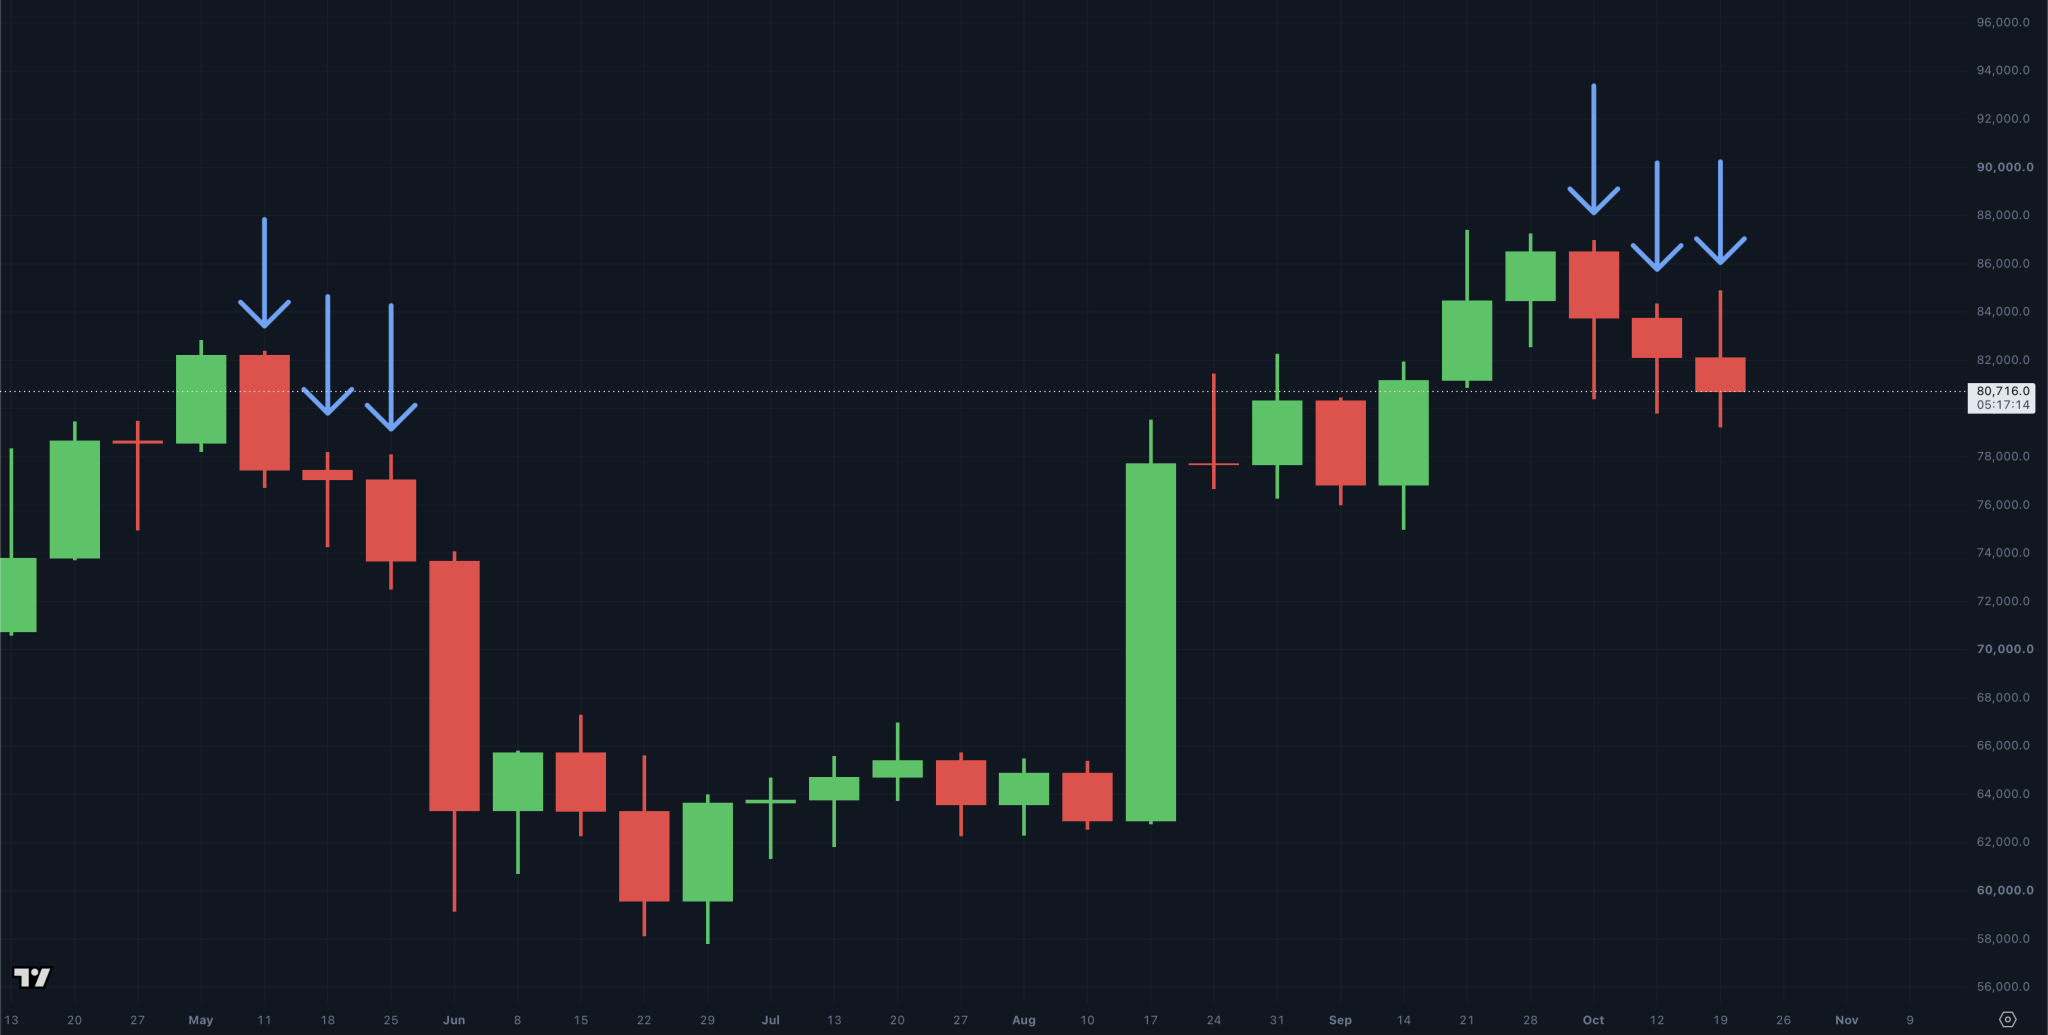
These consecutive losses have heightened concerns about Bitcoin’s near-term direction, particularly because the pattern resembles the sequence that preceded a deeper correction in May.
May Pattern Raises Concerns About Further Losses
In May 2026, Bitcoin also recorded three consecutive red weekly candles as it retraced its early second-quarter rally. However, the decline did not end there, as BTC suffered a fourth consecutive weekly loss.
Notably, the fourth candle produced the steepest decline in that sequence. Bitcoin fell from an opening price of $73,568 to close at $63,316, representing a 13.93% weekly loss.
This historical pattern has raised concerns that Bitcoin could experience another substantial decline if the current selling pressure persists. Nevertheless, the similarity between the two sequences does not guarantee that the market will follow the same trajectory.
Meanwhile, a new trading week has begun, with Bitcoin recovering slightly from its weekly opening price of $80,048 to trade at $80,396 at the time of writing. Despite this modest rebound, the cryptocurrency remains vulnerable to further losses if bearish momentum persists.
CryptoLinus Identifies $80,700 as Key Support
Meanwhile, crypto analyst CryptoLinus has outlined a bearish scenario for Bitcoin if selling pressure intensifies around a key price level.
According to Linus, Bitcoin swept a significant liquidity cluster around $84,900 last week before retracing sharply to $79,100. It subsequently traded sideways over the weekend, following the price action CryptoLinus had anticipated.
Looking ahead, the analyst highlighted $80,700 as a critical level, noting that Bitcoin had recorded 37 consecutive daily closes above that threshold. CryptoLinus expects further downside if BTC fails to close above this level while selling pressure remains elevated.
If Bitcoin fails to close above the level, he identifies $75,000 as the next region to watch. However, this remains a conditional projection rather than a confirmed price target.