




Bitcoin loses $75,625, Ethereum breaks $2,170 and NEAR slips below support as PEPE gains. November 9 analysis covers BTC, ETH, NEAR, UNI and PEPE daily charts.
| Asset | Latest USD price | Past 24 hours | 24-hour market volume | Market-cap rank |
|---|---|---|---|---|
| Bitcoin (BTC) | $74,473 | −1.74% | $21.16 billion | 1 |
| Ethereum (ETH) | $2,131.27 | −4.64% | $10.54 billion | 2 |
| NEAR Protocol (NEAR) | $3.57 | −3.37% | $467.83 million | 22 |
| Uniswap (UNI) | $6.83 | −3.62% | $321.98 million | 24 |
| Pepe (PEPE) | $0.00000505 | +3.11% | $422.06 million | 42 |
Bitcoin loses $75,625 as bearish MACD momentum deepens
Bitcoin closed Sunday at $74,737.90, down 1.34%, after falling to $73,444.30. The $76,096.20 session high was below Saturday’s $76,146.90, while the close finished beneath Saturday’s entire range.
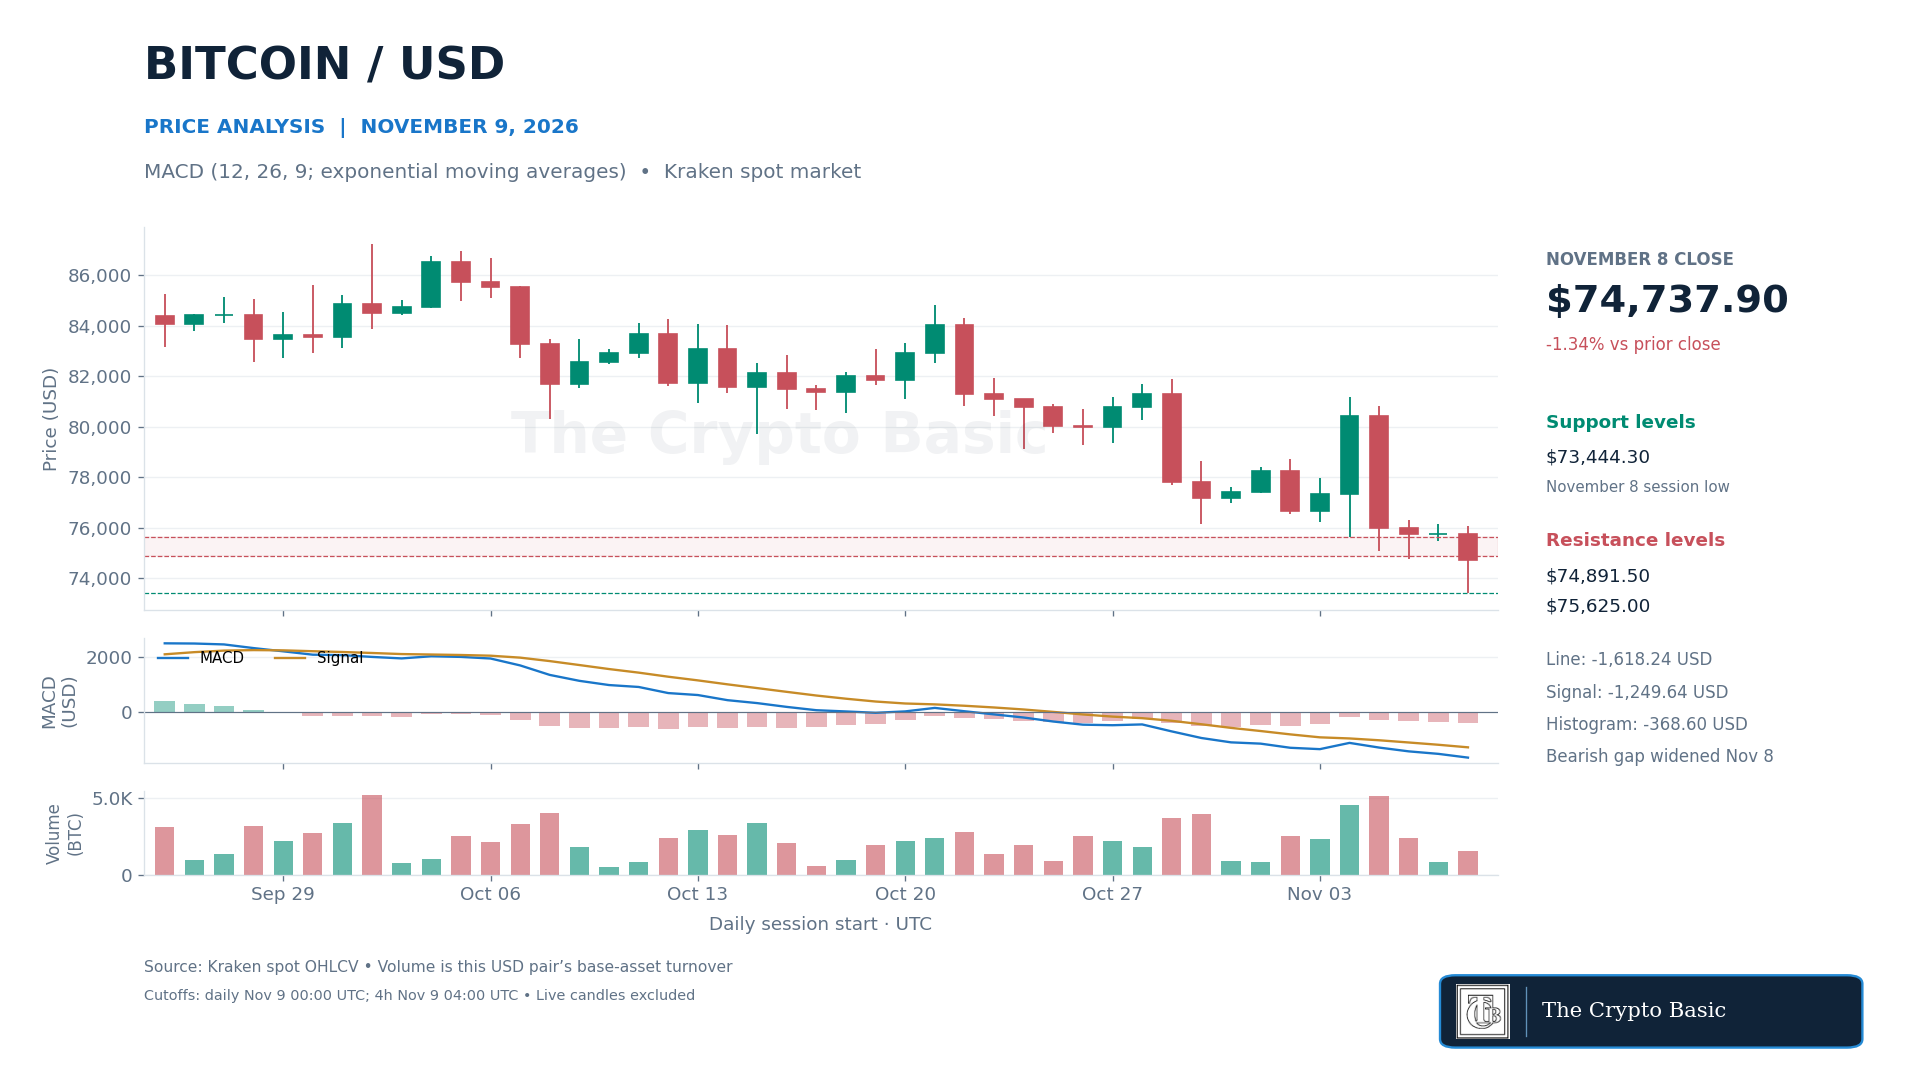
That confirms the downside condition identified in our November 6 Bitcoin analysis: a daily close below $75,625 would invalidate Wednesday’s reversal. Friday and Saturday had held above that threshold at the close. Sunday also finished below the September 15 low of $74,891.50.
Daily MACD, calculated with 12- and 26-period exponential averages and a nine-period signal EMA, shows the decline gaining momentum. The line fell to −1,618.24 against a −1,249.64 signal. Its histogram widened to −368.60 from −326.34. This deepened an existing bearish relationship; Sunday did not generate a new crossover.
The latest completed four-hour close of $74,764.50 remained below $74,891.50. Reclaiming that level would be the first repair, followed by a daily close above $75,625 to challenge the breakdown. Sunday’s $76,096.20 high would then become the next test. A close below $73,444.30 would instead confirm another extension of the decline beyond the latest 60-session low.
Ethereum breaks $2,170 as daily RSI falls to 33
Ethereum fell 5.04% on Sunday to close at $2,124.05, after trading between $2,071.00 and $2,242.86. The close beneath October 30’s $2,170 low confirms a breakdown of the recovery base that had survived the previous week.
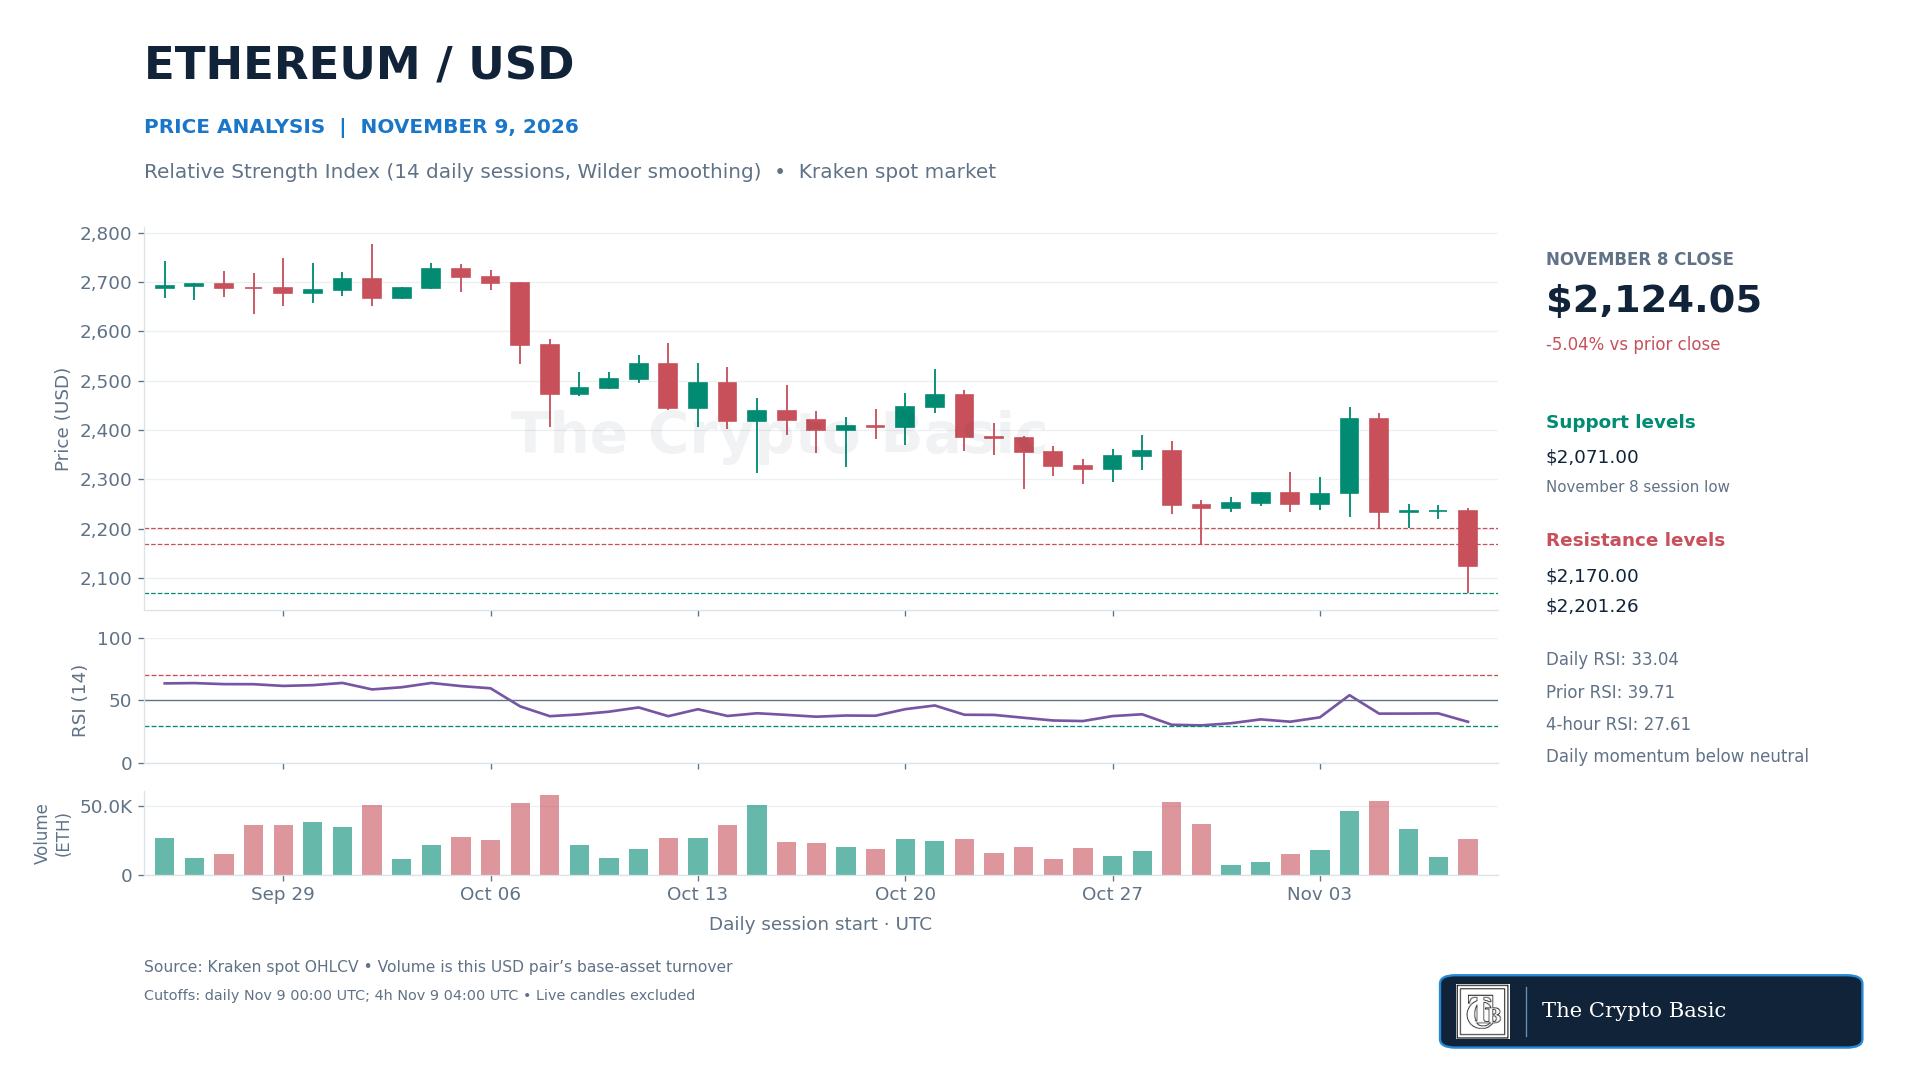
Saturday’s report identified a close beneath that floor as the condition that would invalidate the remaining October recovery. Ethereum now trades 4.93% below the $2,241.76 price recorded in that edition. The weekend pause around $2,200 ended with a lower high, lower low and close beneath both Friday’s and Saturday’s lows.
The 14-day Relative Strength Index, using Wilder smoothing, declined to 33.04 from 39.71. Daily momentum remains above the conventional oversold threshold of 30, but the latest four-hour RSI was already below it at 27.61. That shows more stretched short-term selling without establishing a reversal.
A daily close back above $2,170 would challenge the breakdown. Regaining Friday’s $2,201.26 low would provide the next sign of repair, with Sunday’s $2,242.86 high above it. Until those levels are recovered, the first rebound remains within a weakening daily structure. A close below $2,071 would confirm another leg lower and invalidate an attempt to establish support at Sunday’s low.
NEAR loses support while its daily averages nearly converge
NEAR closed Sunday at $3.5803, down 4.04%, erasing Friday’s and Saturday’s gains. Its $3.4536 low was the weakest price of the latest 30 completed sessions. The close also fell beneath Thursday’s $3.6201 low, invalidating the rebound tracked in Saturday’s report.
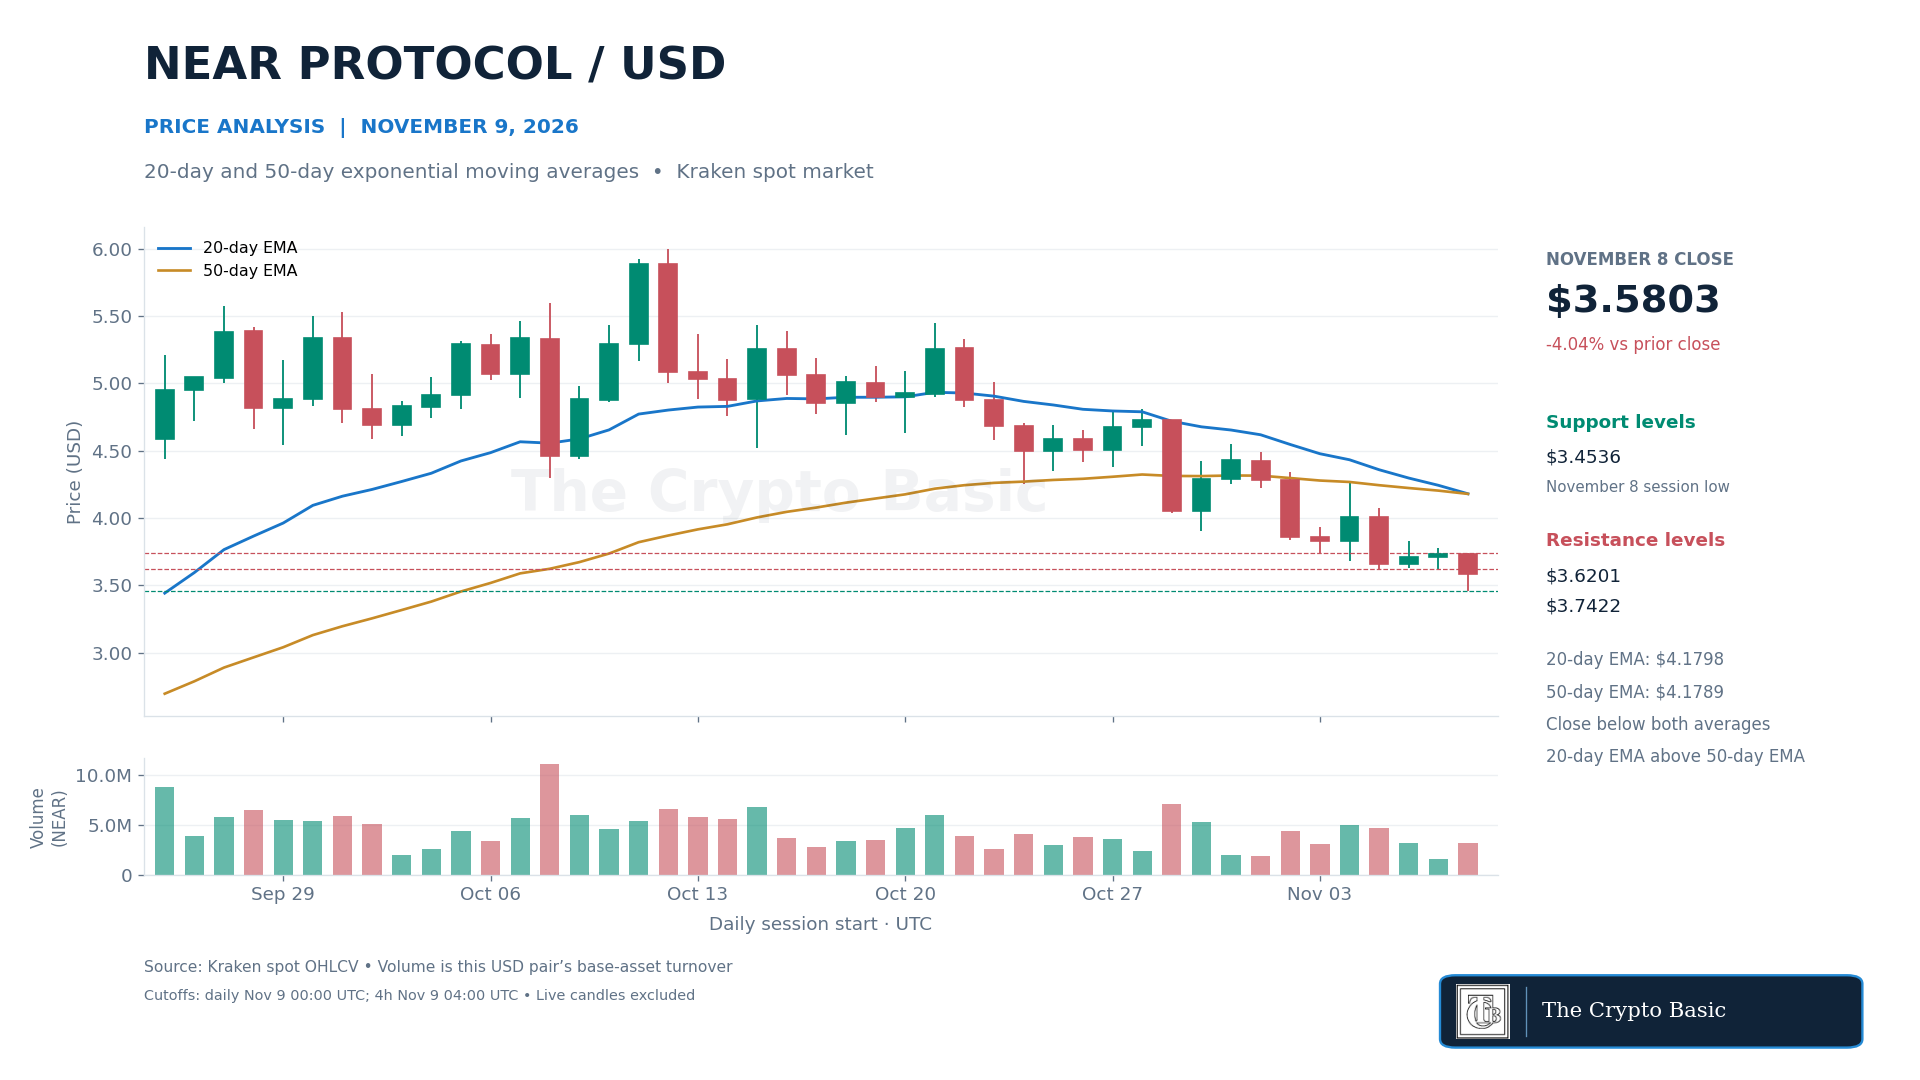
The moving averages show how much the earlier upward trend has weakened. The 20-day exponential moving average fell to $4.17977, almost level with the declining 50-day EMA at $4.17893. The faster average remained about $0.00084 above the slower one, so a bearish crossover had not been confirmed on the completed daily candle.
Price was already well below both averages. The absence of a crossover therefore does not negate the support break; it describes the lagging averages’ position after a sustained decline. NEAR was down 16.11% over seven days at the cutoff.
The latest completed four-hour close of $3.6075 still failed to recover $3.6201. A daily reclaim would be the first step toward Sunday’s $3.7422 high, followed by Friday’s $3.8326 high. Holding above those levels would improve the recovery before the averages near $4.18 come into play. A close below $3.4536 would confirm a fresh extension of the downtrend.
Uniswap gives back Saturday’s rally but holds above its lower band
Uniswap fell 5.95% on Sunday to close at $6.7848. It briefly exceeded Saturday’s $7.2177 high, reaching $7.2319, before falling below Saturday’s $6.8769 low. The close erased the preceding rally and left UNI beneath its recent recovery range.
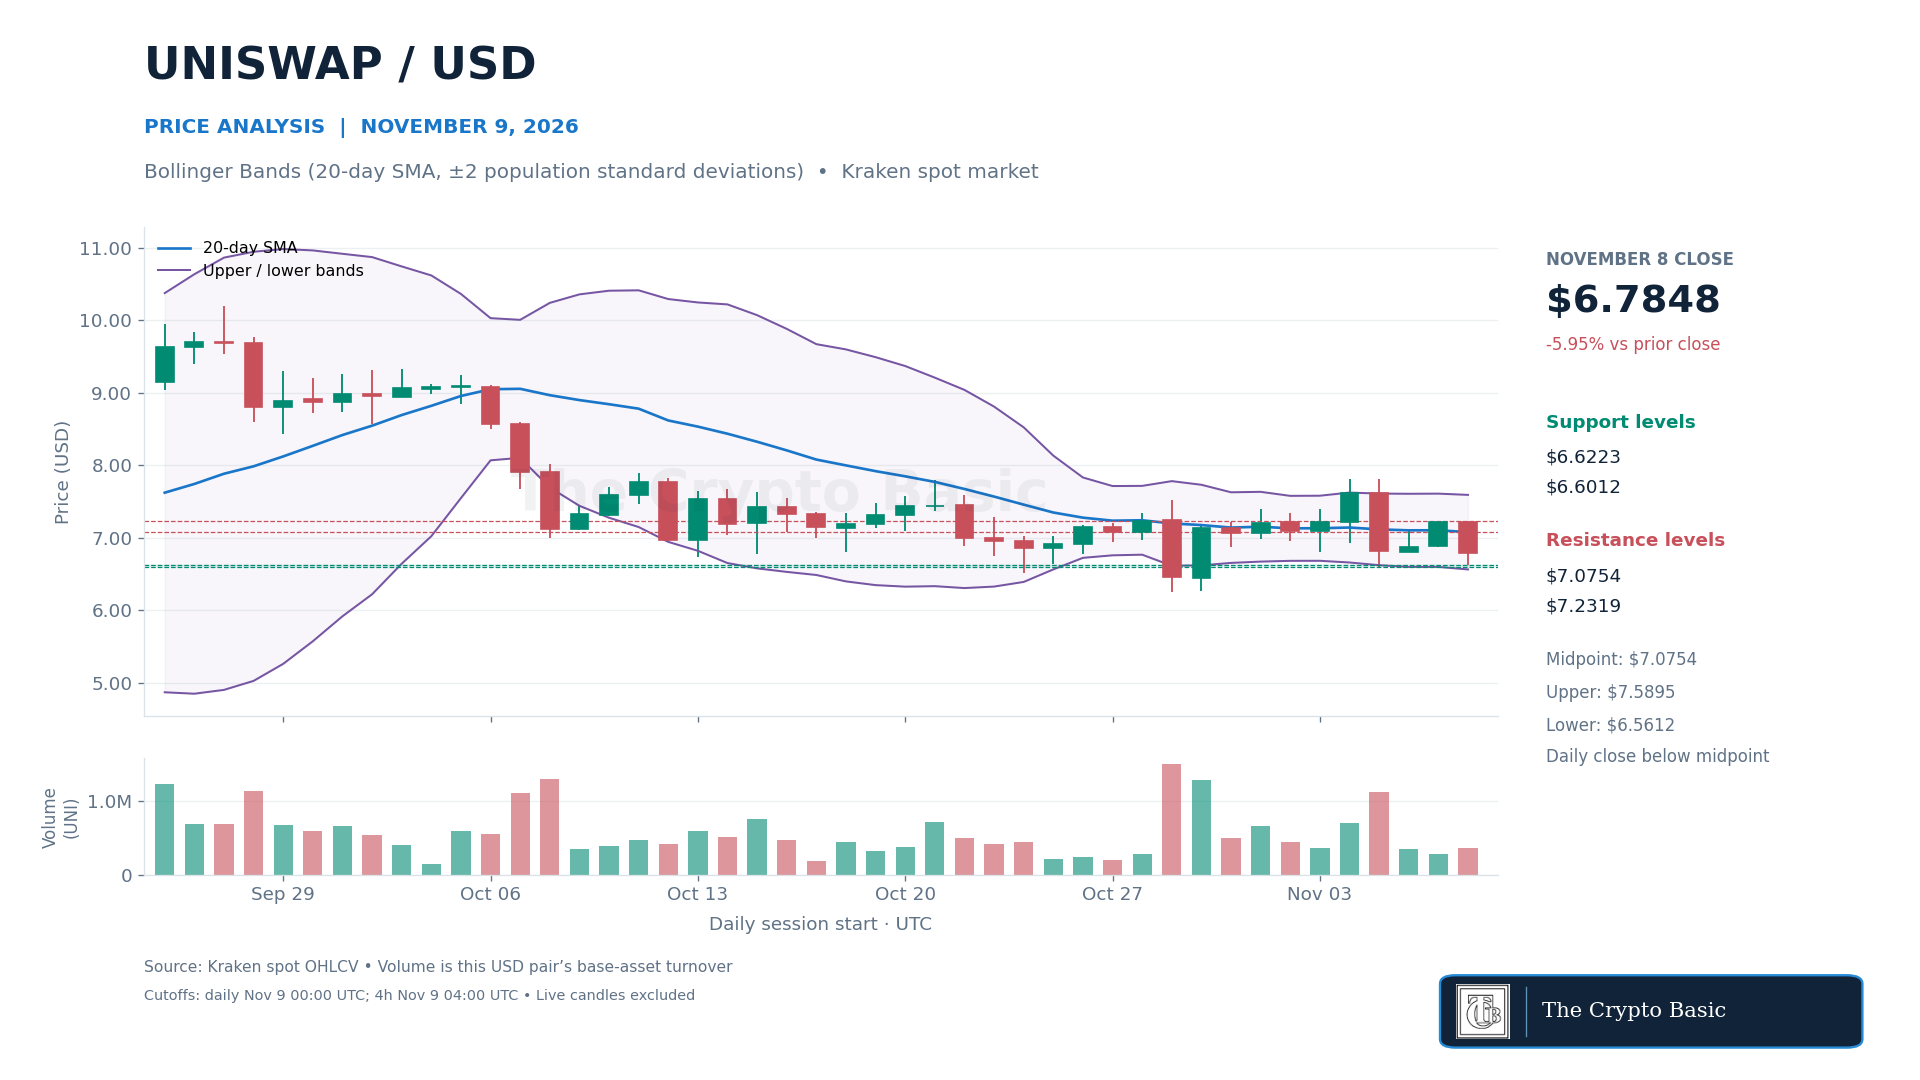
The latest $6.83 price was 6.18% below the $7.28 recorded in our November 2 Uniswap analysis. The stronger participation behind that earlier advance has not translated into a sustained move above the intervening highs.
Daily Bollinger Bands use a 20-day simple moving average and two population standard deviations. Their midpoint declined to $7.07535, with the upper band at $7.58951 and lower band at $6.56119. Sunday closed below the midpoint but above the lower band. Its $6.6223 low also held just above Thursday’s $6.6012, leaving that structural support intact.
A daily close above the midpoint would recover the central trend reference, with $7.2319 the next resistance. Clearing that high would invalidate Sunday’s reversal and strengthen the recovery toward the upper band. Conversely, losing $6.6012 would expose the lower-band area. A sustained break beneath it would bring October’s $6.2519–$6.2577 base back into focus. Band values change with subsequent closes.
PEPE gains while the October retracement remains incomplete
PEPE closed Sunday at $0.000004951, up 1.91%, after trading between $0.000004700 and $0.000005120. Its high exceeded Saturday’s high, but the close remained below Saturday’s $0.000005037 peak. The advance therefore improved the latest closing price without confirming a break above that nearby obstacle.
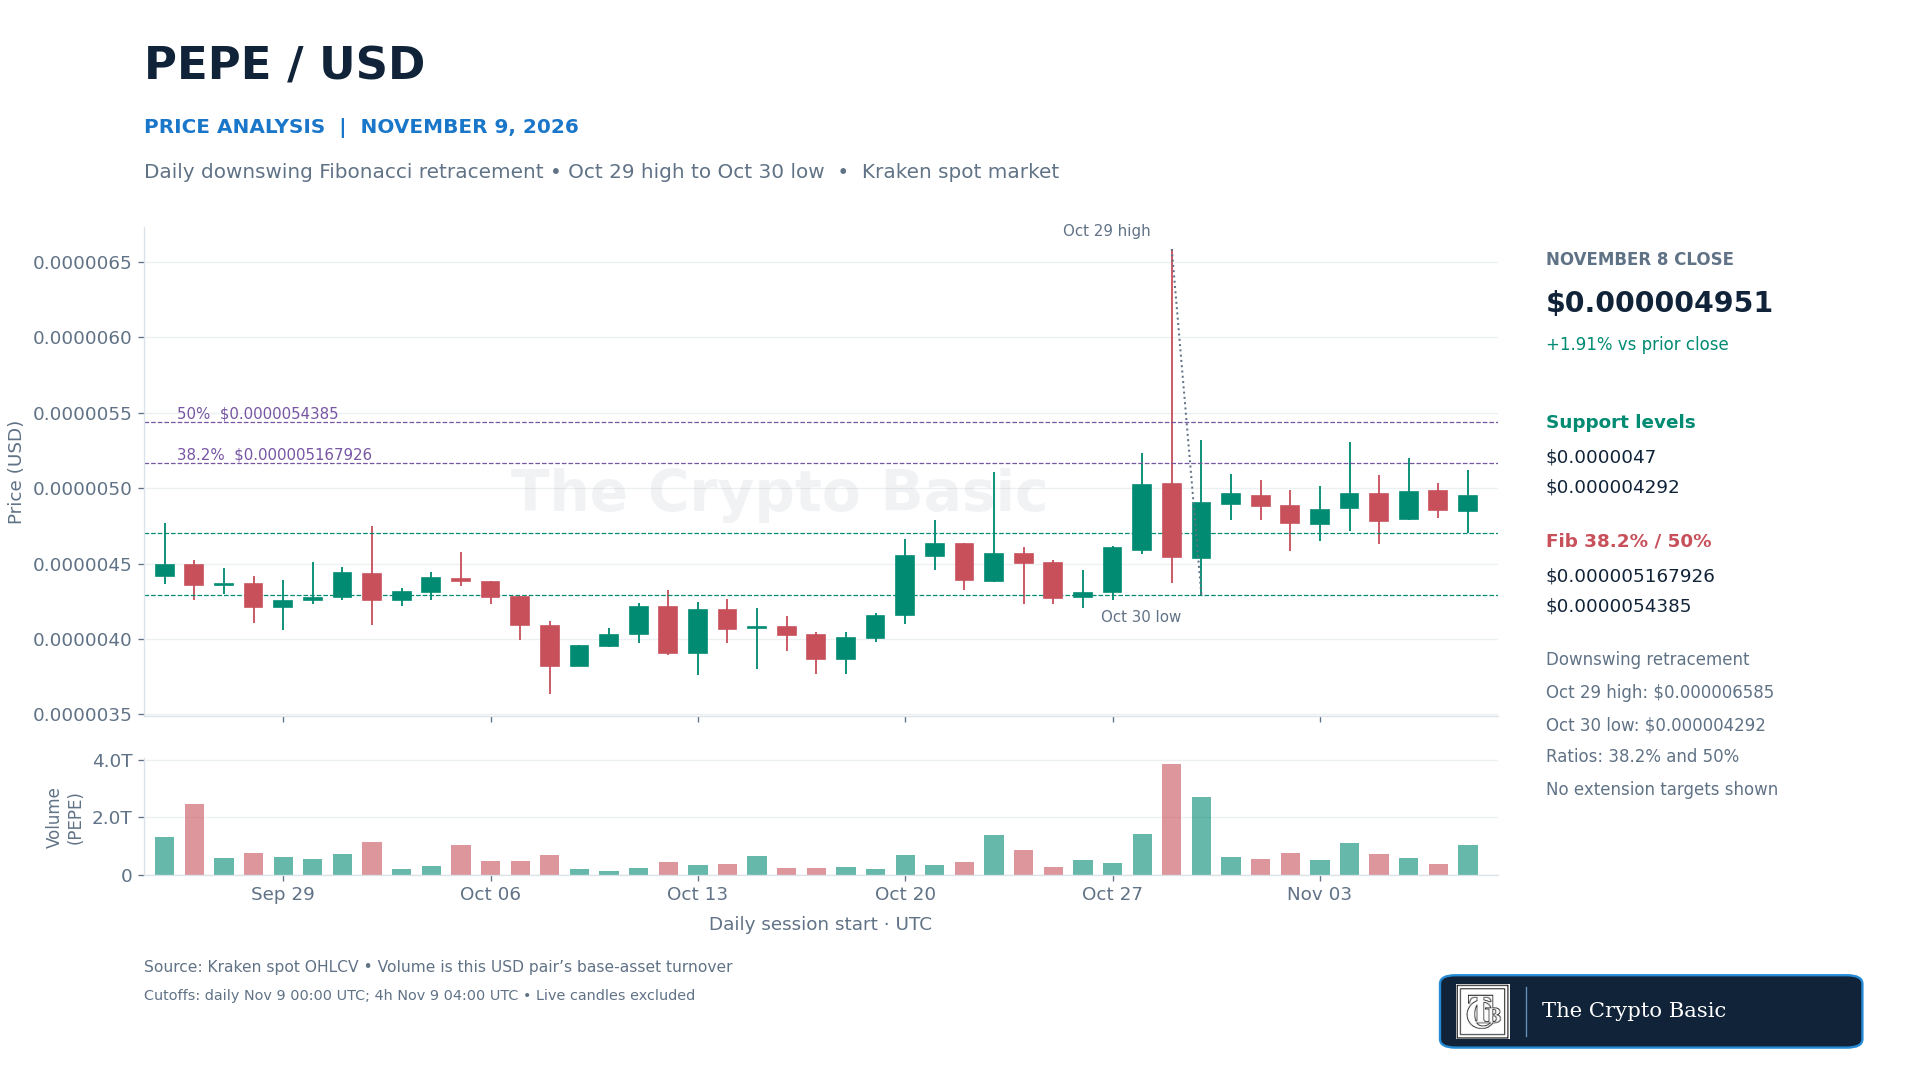
The latest $0.00000505 price was 4.99% above the level recorded in our November 4 PEPE analysis. The broader recovery nevertheless remains within the range established by October’s sharp reversal.
Fibonacci retracements of the downward move from the October 29 high of $0.000006585 to the October 30 low of $0.000004292 place the 38.2% recovery level near $0.000005168 and the 50% level at $0.0000054385. These measure how much of that decline has been recovered; they are not extension targets.
The four-hour candle ending Monday at 04:00 UTC touched $0.000005189, briefly crossing the 38.2% level, but closed below it at $0.000005078. A daily close above approximately $0.000005168 would strengthen the rebound toward November 4’s $0.000005306 high, followed by the 50% retracement.
A return below Sunday’s $0.000004700 low would weaken the advance and expose $0.000004586. A daily close below the $0.000004292 anchor low would invalidate the recovery measured by this retracement.