



XRP has fallen approximately 70% from the $3.45 resistance area and is approaching a rising support band that could determine whether the decline develops into a deeper breakdown or a broader recovery.
The November 12 Bitstamp weekly snapshot places XRP near $1.0358. Price remains above the long-term support band, but repeated lower highs and the loss of the roughly $2 level have brought that structure increasingly into focus.
A successful defense could create a base for another attempt at overhead resistance. Failure would weaken the multi-year support structure, although a further 70% decline remains a downside scenario rather than a confirmed target.
XRP Has Lost the Lower Edge of Its Major Resistance Range
The main overhead resistance area extends from approximately $1.99–$2 to $3.45.
The lower boundary is significant because XRP repeatedly traded around $2 during the 2025 consolidation before breaking beneath it in 2026. Subsequent rebounds have failed to restore that area as support, leaving price below the former trading range.
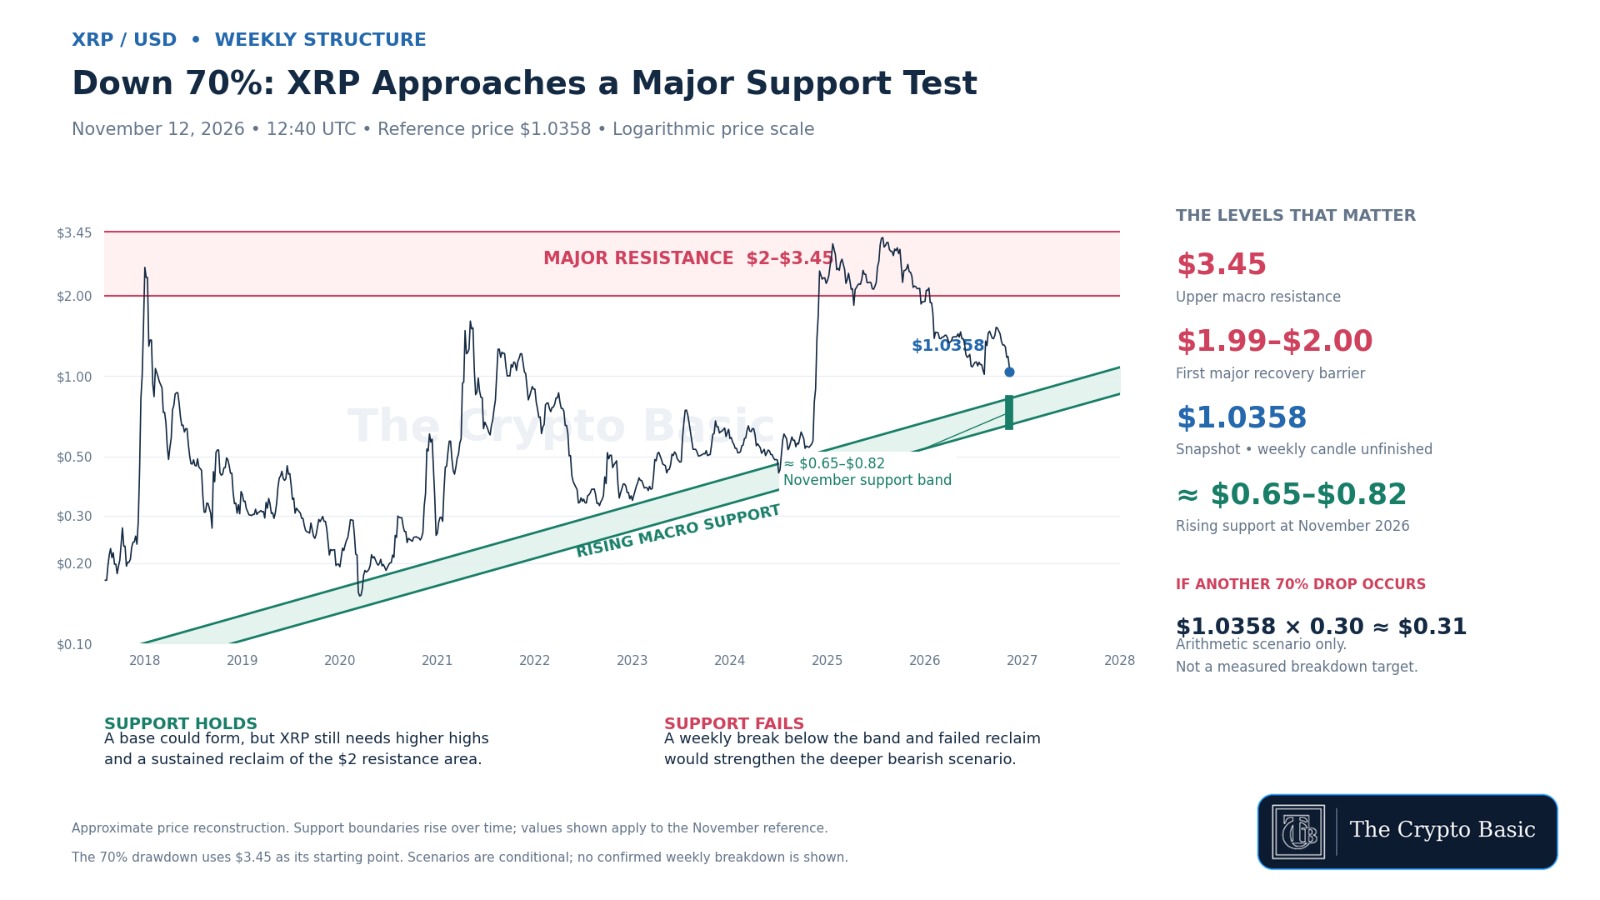
The upper boundary near $3.45 sits close to the major peaks, although some historical wicks extend beyond it. Measured from $3.45 to the $1.0358 snapshot, XRP’s decline is almost exactly 70%. The drawdown from the highest wick would be slightly larger.
Recent weakness has also brought the psychological $1 level into view. The Crypto Basic previously examined how XRP’s fair value gap extending toward $1 left that region exposed after nearer support failed.
The Rising Macro Support Band Is Still Below Price
Two upward-sloping boundaries define the long-term support zone. Around the November 2026 position, the band lies approximately between $0.65 and $0.80–$0.82, based on its placement against the logarithmic price scale.
These are visual estimates rather than precisely labeled horizontal levels. Both boundaries rise with time, so the relevant support prices would change if XRP reaches the zone later.
The upper boundary runs near several important lows formed during the 2020–2024 period, while the lower boundary allows for deeper downside excursions. Earlier wicks sometimes extended outside the band, making it an area of interest rather than an exact floor.
At approximately $1.04, XRP is approaching this structure rather than already breaking it. That distinction separates immediate pressure around $1 from the deeper macro support test.
A move toward the upper edge near $0.80–$0.82 would represent roughly 21%–23% additional downside from the snapshot. Reaching the lower edge near $0.65 would imply approximately 37%.
What Another 70% Decline Would Mean
A further 70% drop from $1.0358 would place XRP near $0.31. That would bring price back toward the broad low-$0.30 region occupied during parts of the 2022–2023 base.
However, $0.31 is an arithmetic illustration using the snapshot price as its starting point. It is not a measured target derived from the support band. Calculating a 70% decline from a later breakdown price would produce a different result.
Two consecutive 70% declines also compound: together, they represent a 91% loss from the original starting value.
The deeper bearish scenario would gain weight if XRP fell through the rising band, closed a week below it, and then failed to reclaim the area. A temporary wick beneath support followed by a recovery would provide a different signal.
Before that macro test, the previously identified $0.90 downside area remains a nearer reference beneath $1.
Holding Support Would Still Leave Major Resistance Overhead
A rebound from the support band would preserve the possibility of a larger recovery, but XRP would still need to reverse its sequence of lower highs.
The first major macro obstacle is approximately $1.99–$2. Recovering $2 from the $1.0358 reference would require an advance of roughly 93%. Reaching $3.45 would require approximately 233%.
Those figures illustrate how much ground XRP must regain. A support bounce alone would not establish a breakout through the full resistance range.
The November 12 snapshot also shows the ongoing weekly candle down approximately 6.87%, with a low near $1.0301. Because the week is unfinished, neither that decline nor the candle’s shape constitutes a confirmed weekly closing signal.
For now, XRP remains beneath major resistance and above its deeper rising support band. The next decisive development is whether buyers can stabilize price before that band is reached—or defend it convincingly if the decline continues.