Home Blog Page 1102

New Wallet Accumulates 60,000,000,000 Shiba Inu From Binance

0

An anonymous whale withdraws a hefty amount of Shiba Inu (SHIB) and Pepe (PEPE) tokens from Binance to a newly created wallet. 

Popular crypto tracking platform Lookonchain called the public’s attention to the transactions today. 

Transaction Details 

Data from Etherscan show that the first transfer occurred today around 07:58 a.m. (UTC). At the time, the whale withdrew a total of 149,999,653,570 (approximately 150 billion) PEPE, worth $2.94 million, from Binance in a single transaction. 

Binance deposited the funds in the whale’s newly created wallet through one of its wallets labeled ‘Binance 15.’ This withdrawal marks the wallet’s first transaction since its creation.  

A few minutes later, the whale made another hefty withdrawal from Binance. This time, the user withdrew approximately 60 billion Shiba Inu tokens, valued at $1.52 million, according to Lookonchain. 

The 60 billion SHIBs were deposited in three separate transactions, each containing approximately 20 billion tokens. Notably, the withdrawals emanated from Binance Wallets, such as Binance 14 and Binance 16. 

PEPE and SHIB Surge Amid Whale Accumulation 

The recent withdrawals from Binance suggest that the whale might be planning to hold the tokens for the long term. Currently, the tokens are still held in the wallet. While PEPE accounts for 65.92% of the portfolio, Shiba Inu represents 34%, with Ethereum (ETH) constituting 0.08%. 

Notably, such withdrawals could reduce the number of SHIB and PEPE on the world’s largest exchanges, potentially contributing positively to price action. The move coincides with a slight surge in the prices of both assets. 

While SHIB has surged 2.03% in 24 hours to $0.00002517, PEPE has soared 7.03% in the same timeframe to $0.00001944. 

Massive Whale Accumulation of SHIB and PEPE 

Meanwhile, crypto experts are betting on Shiba Inu and PEPE in the ongoing bull run, prompting whales to accumulate huge amounts of both tokens from exchanges. 

For instance, an unidentified whale took advantage of the mid-November dip to amass a whopping 4 trillion Shiba Inu tokens worth $99 million at the time.  

A few days later, crypto whales withdrew 1.67 trillion SHIB from exchanges, representing 0.28% of the total supply. 

Similarly, large investors also found PEPE enticing this month as they embarked on accumulation sprees for the token. 

On November 20, a big investor splashed $2 million worth of USDC to acquire PEPE in one transaction. This purchase follows other large transactions reported this month featuring the frog-themed token. 

Earlier this month, three whales acquired $7.94 million worth of PEPE, totaling 535.81 billion PEPE, from two prominent exchanges, Binance and Gate.io. 

Top Analyst Says Shiba Inu Ready to Break Above Weekly Ichimoku Cloud: Here are Targets to Watch

0

Shiba Inu (SHIB) is capturing the crypto market’s attention as its weekly chart reveals a potential bullish breakout above the Ichimoku cloud. 

In recent weeks, the price of Shiba Inu has been discouraging, lagging behind its peers in the meme coin market. SHIB is currently trading at $0.00002531, recording only 35% gains in the last four weeks. 

Meanwhile, Dogecoin has surged by 143% during the same period, while PEPE has seen an impressive 105% monthly gain despite trading 22% below its most recent all-time high.

Notably, Dogecoin has been trading at price levels that were last seen during the peak of the previous bull season. Shiba Inu, however, is still working to recover from its eight-month-long downtrend. Nonetheless, analysts are watching for indicators that suggest a significant move for SHIB is imminent.

Shiba Inu Ready to Break Ichimoku Cloud

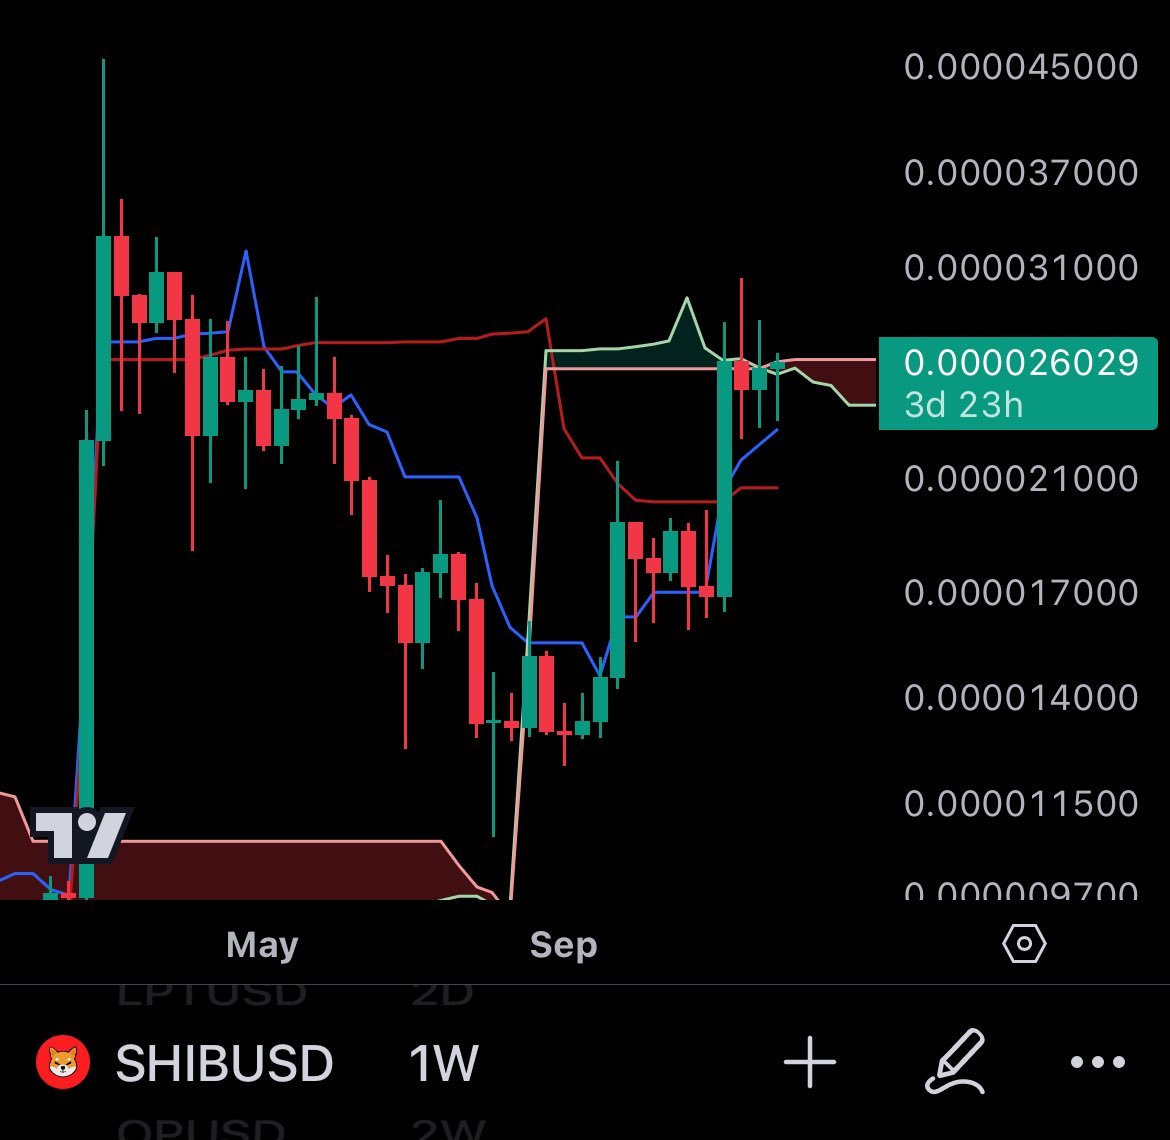
Technical analyst Cantonese Cat believes SHIB is on the verge of breaking above the weekly Ichimoku Cloud, which could signal the start of a strong uptrend after its prolonged period of lackluster price action.

The Ichimoku Cloud represents critical resistance and support zones. Shiba Inu hovers near the cloud’s upper boundary, a level traders consider a key inflection point.

A decisive close above the cloud on the weekly timeframe could confirm bullish sentiment, potentially attracting fresh buyers and driving the price toward higher levels.

Potential SHIB Targets

Should the breakout occur, the analysis identifies $0.00003100 as the immediate resistance level for Shiba Inu to overcome. Successfully reclaiming this level could set the stage for a move toward the $0.000037 region, last seen in March. 

Beyond that, Shiba Inu may target its yearly high of $0.000045 and potentially reclaim previous peaks from 2021, preparing it to finally push for an all-time high.

Image
Shiba Inu chart by Cantonese Cat

Other Bullish Forecast for SHIB

Other analysts have also shared optimistic views on Shiba Inu based on different technical indicators.

The analyst behind the InvestingHaven platform recently pointed out that a price of $0.0000555 remains attainable for Shiba Inu before the end of the year, citing Fibonacci retracement levels. 

Meanwhile, data analyst “CW” suggests that Shiba Inu is forming a triangle convergence with its eight-month-long downtrend. According to him, a breakout above this pattern could propel SHIB to an all-time high of $0.00038.

Ethereum Slumps from $3,600 as Co-Founder Moves 20,000 ETH to Kraken

0

Ethereum’s bullish push stalls at $3,600 after co-founder Jeffrey Wilcke transferred 20,000 ETH ($72.5 million) to crypto exchange Kraken.

Data from Spotonchain confirmed the transaction, which happened by 12:59 (UTC) today. Notably, “0xa7ef,” the wallet address belonging to the co-founder, moved 20,000 ETH to a deposit wallet tied to Kraken.

At the time of the transfer, the Ethereum tokens were worth $72.5 million, moved at an average price of around $3,627. Meanwhile, the Wilcke-tied account still holds 105,738 ETH, valued at $382 million.

It bears mentioning that this was Wilcke’s fourth Ethereum sale of the year. The Spotonchain data reveals that the wallet sold 10,000 ETH ($37.38 million at the time) in May, taking his total Ethereum sales this year to 44,300 ETH at an average price of $3,342. 

Ethereum Stalls at $3,664

Meanwhile, the 20,000 ETH shift coincided with the asset’s renewed downward pressure. Ethereum’s bullish push stalled at an intraday high of $3,664, with the asset dropping over 2% to trade below $3,600.

Notably, the altcoin king joined a broader market recovery yesterday, surging over 9% from the $3,300 zone to a five-month price high. However, its bullish momentum has lost steam, spurred by selling pressure and a broader market correction.

Nonetheless, analysts still expect Ethereum to appreciate substantially in the long term. For instance, market commentator Ali Martinez recently speculated bullish upsides for the altcoin king, asserting $6,000 mid-term and $10,000 long-term targets.

On-chain Analysis Shows Bullish Signs

Amidst the downtrend, on-chain analysis still suggests that Ethereum looks bullish. Data from IntoTheBlock indicates a “mostly bullish” signal for the second-largest cryptocurrency by market cap.

Ethereum Onchain Analysis

Although net network growth and large transactions remain neutral at 0.28% and 3.14%, the “in the money” and concentration metrics show bullishness. The former indicates an uptick in the number of Ethereum holders in profit, while the latter underscores an increase in whales holding between 0.1% and 1% of Ethereum’s circulating supply.

Another indicator shows that 90.8% of Ethereum holders are in profit, the highest since June. Meanwhile, the 9.2% out of the money controls just 2.8% of the asset’s supply, suggesting that selling pressure from them might not substantially affect Ethereum’s price.

Analyst Says If You Hold XRP, You Will Be Very Rich Soon

0

Crypto analyst Robert Doyle, better known as Crypto Sensei, has made bold predictions about XRP, claiming that anyone holding the asset could experience massive wealth soon.

In a recent video, Doyle highlighted XRP’s recent surge past a critical 7-year resistance level as a key indicator of its potential for explosive growth. He emphasized that XRP’s market momentum, combined with growing institutional adoption, makes it one of the most promising assets in the crypto space.

According to Doyle, one of the biggest catalysts for XRP’s rise is the ongoing transition in global financial systems. He pointed out that Ripple has secured major partnerships with several Latin American banks, positioning XRP as a leader in cross-border payments. 

Furthermore, he discussed theories suggesting that the FedNow payment system could use XRP for instant transactions via various partners. However, this remains unsubstantiated.

Doyle also examined broader trends in the cryptocurrency market, including growing institutional interest in crypto and the shift toward tokenized value. Moreover, he spoke about the increasing likelihood of a gold-backed currency system, with XRP serving as the bridge for these new gold-backed assets.

Becoming “Very Rich” with XRP

With growing global acceptance and expanding use cases across various sectors, Crypto Sensei believes that XRP is on the verge of a massive rally, and those holding the token are in for significant gains.

Specifically, he speculated that if XRP could capture just 4-5% of the global financial market, the value of XRP could skyrocket to $30 or even $50. Notably, XRP is worth $1.48 today, boasting a seven-day growth of 33%.

Reaching $30, as Doyle suggested, requires a growth of 1,927%, which is nearly 20X for those buying XRP today. Meanwhile, the upper target of $50 suggests a more promising 3,278% upside. 

Other commentators, like Wall Street analyst Linda Jones, have made similar projections for XRP, citing a recurring four-year cycle pattern. In this case, $1,000 committed to XRP today could amount to $33,783 with $50 per token.

While this prospect seems promising, some analysts have dismissed the possibility of XRP seeing such growth in this current cycle. For the latest updates and insights, check out the rpple news today. Conservative analysts have projected that XRP’s destination for this cycle is around $5 to anything below $10.

EigenLayer Eyes $6 as Channel Breakout Fuels Trend Momentum

Will the ongoing bull run in EigenLayer (EIGEN), fueled by a channel breakout, result in a breakout above $5 and push the price to $6?

EigenLayer is trading at $3.7945, with an intraday pullback of 1.43%. However, the last night’s surge resulted in a 14.07% bullish engulfing candle with a 24-hour high set at $4.1419. 

Will this recovery in EigenLayer lead to a new price surge beyond $5? Let’s take a quick look at its price action to find out more.

EigenLayer Price Analysis

In the 4-hour chart, the EigenLayer price trend shows a breakout rally gaining momentum. The bull run began with a sudden reversal from the $2.14 level, followed by a 5.18% surge that created a bullish engulfing candle on Nov. 21.

EigenLayer Price Chart

The trend momentum has continued to surge, challenging the long-standing resistance trendline in the 4-hour chart. With multiple rejections, the trendline had previously trapped bullish attempts at growth.

However, a massive surge of 5.61% on Sunday, Nov. 24, marked the breakout of the falling channel pattern. Over the last week, the recovery rally in EigenLayer has seen 6 out of 7 bullish candles.

In the 4-hour chart, a higher price rejection formed an evening star pattern, and the price is now consolidating slightly above the $3.60 support level. The sudden increase in overhead supply comes from a long-standing supply zone extending from $4.07 to $4.14.

Eigenlayer Chances of a Bull Run

For the bullish trend to continue, the breakout rally must sustain a closing above $4.15 on the 4-hour chart. The increased bullish momentum has resulted in a golden crossover, with the 100 and 200 EMAs approaching a bullish crossover.

Furthermore, the 4-hour RSI has entered the overbought zone, indicating a minor pullback or consolidation before buyers regain control. However, both the momentum indicator and the moving averages remain optimistic about the future price trend of EigenLayer.

According to Fibonacci levels, the breakout rally could target the next price levels at $4.96 and $6.23. With the broader market recovery, these targets will likely be reached in December. On the downside, the crucial support levels stand at $3.60, followed by $3.40.

Here Are Projected Timelines for Dogecoin to Hit $3.03, $9.35, and $18.03

0

Market watchers from top entities like Changelly project timelines for Dogecoin’s (DOGE) potential surge to $3.03, $9.35, and $18.03. 

Dogecoin (DOGE) remains one of the top-performing coins in the ongoing bull run. Recall that the price of DOGE soared to $0.4359 on November 12 before falling below $0.35 a few days later. This shocking move sparked a major debate over whether DOGE’s bull run has come to an end. 

However, the token showcased that its bull run is far from over, as its price rallied to $0.4775 over the weekend. The spectacular surge reignited investors’ confidence in Dogecoin, with top analysts setting different targets for the asset. 

Changelly Predicts Timeline for DOGE Surge to $3.03, $9.35, and $18.03 

Specifically, analysts from Changelly set three targets for Dogecoin, such as $3.03, $9.35, and $18.03, along with projected timelines for when DOGE might attain these milestones. 

Dogecoin to $3.03 

The $3.03 prediction is the smallest target out of the set. Despite this, hitting this target would mark Dogecoin’s new all-time high (ATH). For context, Dogecoin set its previous ATH of $0.73 on May 8, 2021. 

With DOGE currently trading at $0.4710, reaching the $3.03 target would require a substantial increase of 543.3%. At a price of $3.03, Dogecoin’s market cap would stand at $445.13 billion. 

According to Changelly analysts, Dogecoin would trade at $3.03 by January 2033, nearly nine years from now. Notably, this target would mark Dogecoin’s maximum price for January 2023. 

Earlier this year, famous chartist Ali Martinez forecasted that Dogecoin would trade around the $3 territory this year. He projected that DOGE would trade at $3.5 in April if history repeats itself. However, this prediction did not materialize as DOGE continues to trade below the $1 territory. 

Nonetheless, pseudonymous market observer Crypto Yapper predicted that Dogecoin would rise to $3 by May 2025, six months from now. 

Dogecoin to $9.35 

Hitting the $9.35 target requires a more substantial rally compared to the $3.03 forecast. Specifically, Dogecoin must witness an increase of 1,885% from the current price to reach the $9.35 target. At this price, Dogecoin’s market cap will soar to $1.37 trillion, surpassing Ethereum’s current valuation of $414.73 billion. 

Analysts from Changelly project a timeline of January 2040 for Dogecoin to reach $9.35, indicating that it would represent DOGE’s minimum price by then. 

Unlike the $3.03 prediction, the $9.35 target has not gained momentum within the Dogecoin community. Consequently, few market observers have projected timelines for when DOGE might clinch the target. 

However, data from top prediction platform Telegaon show that Dogecoin would trade at a maximum price of $9.34 by 2035, less than five years from Changelly’s estimated timeline. 

Dogecoin to $18.03 

The $18.03 forecast is an ambitious target that requires Dogecoin to rally by 3,728% from the current price of $0.47. At $18.03, Dogecoin’s valuation would stand at $2.64 trillion, surpassing Bitcoin’s market cap of $1.96 trillion. 

According to Changelly analysts, the $18.03 prediction would become a reality for Dogecoin by February 2040, one month after the meme-based token hits a target of $9.35. 

Can DOGE Soar to $3.03, $9.35, or $18.03? 

Given Dogecoin’s hefty supply of 146.91 billion tokens, there is no guarantee that DOGE will attain any of the targets. 

However, Dogecoin has experienced a substantial rise in the past, soaring 18,340% within the first five months of 2021. Moreover, factors such as the ongoing bull market, the Elon Musk effect, massive retail interest, and payment utility can pave the way for DOGE’s substantial price surge in the future. 

It is worth noting that this article is for informational purposes and should not be taken as financial advice.  

Market Expert Says XRP to $2 is Not Even a Question

0

Amid the recent XRP price action, some experts believe it is likely to breach the previous 2021 high to claim a seven-year top.

Notably, XRP has been on a remarkable surge, recently reclaiming $1 for the first time in three years. After peaking at $1.63 on Nov. 23, the asset has faced a slight pullback and is consolidating around $1.46. 

With an impressive 188% rise in November alone, analysts are now more bullish on XRP, predicting the $2 milestone is within reach and expecting long-term gains beyond $8. 

XRP Eyes $2 Once $1.6 Clears

Crypto analyst and entrepreneur Armando Pantoja is championing this narrative. In his latest analysis, the angel investor suggests that XRP’s bullish setup is far from temporary. 

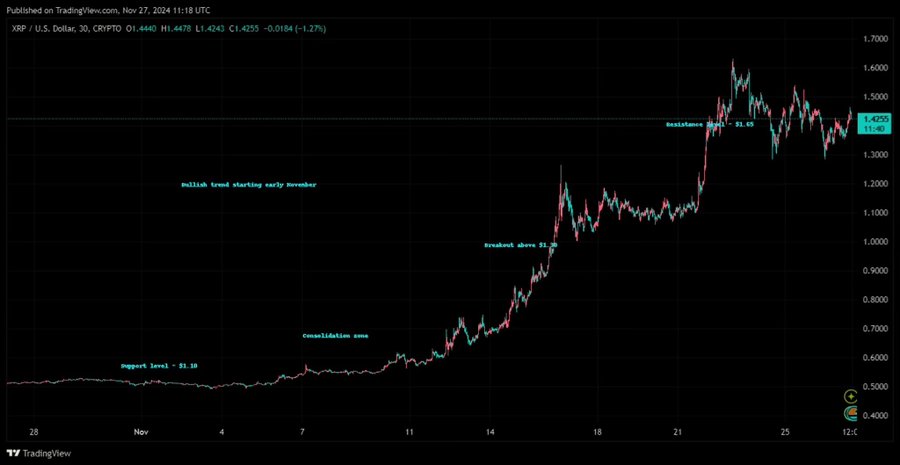
He shared a 30-day chart which highlights a major upward trend, starting in early November. This trend’s foundation features a surge in whale accumulation and positive market sentiment. 

XRP 30D Chart Armando Pantoja
XRP 30D Chart | Armando Pantoja

Despite this run, Pantoja suggested that XRP’s MACD appears to be cooling, and its Relative Strength Index (RSI) is not yet in an overbought position, indicating a sustained rally rather than an overheated market. 

Citing these market conditions, he believes once XRP clears $1.60, resistance to $2 will be minimal, likely triggering FOMO among traders. Meanwhile, beyond this level, he remains confident that XRP’s long-term target lies between $8 and $20.

XRP Could Face Its Next Roadblocks at $1.63, $1.88 and $1.96

Interestingly, another analysis from market commentator Dark Defender complements Pantoja’s outlook. However, Dark Defender focuses on shorter-term timeframes to discuss XRP’s next price direction from this level over the next few days. 

Using a 4-hour XRP chart, he confirmed the importance of the Fibonacci level at $1.44, which XRP has successfully breached by closing two consecutive candles above it. 

This move indicates a potential move toward the $1.63 resistance zone, which could set the groundworks for XRP to climb to $1.88. His chart shows that XRP is leveraging massive support within the Ichimoku cloud.

Dark Defender predicts that sustained movement above $1.44 will act as a launchpad for further gains. If XRP claims the $1.88 target, it would face minimal resistance on its journey toward $1.96. Interestingly, veteran trader Peter Brandt expects a massive run once $1.96 gives way.

XRP’s Symmetrical Triangle

Meanwhile, analyst Mikkybull also recently shared a 4-hour XRP chart showing consolidation within a symmetrical triangle. He pointed out that a similar triangle formed earlier in November, following XRP’s breach of the $1 level. This consolidation lasted for five days before XRP rallied to $1.63. 

Mikkybull sees parallels in the current price action, with the latest triangle forming after the drop from the $1.63 high. He expects another breakout that could push XRP toward the $2 price range.

Notably, all these analysts unanimously agree that maintaining support levels like $1.44 will help in sustaining the rally. Further, breaking through resistance at $1.63 could act as a catalyst for the next leg up to $2 and beyond.

Shiba Inu Team Compares Current SHIB Rally to 2020, Says Super Cycle Yet to Come

0

Shiba Inu marketing specialist, Lucie, suggests that the current market conditions are similar to those witnessed in 2020, which marked the early stage of the 2021 bull cycle. 

The prices of various crypto assets have skyrocketed tremendously in recent times. The rally, which began after the U.S. election, saw various assets like Bitcoin (BTC) and Solana (SOL) hit new all-time highs (ATH). For instance, while Bitcoin registered an ATH of $99,655 on November 22, Solana surged to a peak price of $263 the following day. 

Shiba Inu Price Action 

However, altcoins like Shiba Inu have yet to register a new ATH in the ongoing bull run, triggering concerns that SHIB had been left out in the rally.

For context, Shiba Inu only surged to $0.00003031 on November 12 from a monthly low of $0.00001626. Despite the rally, SHIB was still down 64.82% from its ATH of $0.00008616, registered on October 28, 2021. 

Following the recent correction across the broader market, some investors claimed the bull run has ended, with SHIB losing out. 

Lucie React 

However, Lucie suggested that the market trend is similar to what investors observed in 2020 before the explosive rally that followed suit in 2021. 

Recall that Shiba Inu launched in August 2020 with ten zeros after its decimal. On November 28, 2020, Shiba Inu plunged to its all-time low (ATL) of $0.000000000056, with many investors losing hope in the asset. After falling to its ATL, the canine-themed token did not record any significant price movement in 2020. 

However, things changed for Shiba Inu in 2021, with top exchanges listing it on their platforms amid surging demand. Moreover, Shiba Inu saw its biggest burn in May 2021 when Ethereum co-founder Vitalik Buterin transferred over 410 trillion SHIB to the official dead wallet. 

These activities attracted investors’ attention to SHIB, ultimately taking the token to an ATH of $0.00008616 in October 2021. 

According to Lucie, the current market trend is similar to 2020, preceding the hefty bull run in 2021. She characterized 2025 as the ‘year of the super cycle,’ which could potentially result in a larger bull run, similar to the 2021 record. 

Furthermore, she encouraged investors to remain patient and ensure they invest in assets that could achieve extraordinary growth. 

Experts Anticipate New ATH Above $0.0001 for SHIB 

At press time, Shiba Inu is currently hovering around the $0.000025 level. The asset is trading at $0.00002541, up 2.64% over the past 24 hours. 

Despite trading below its ATH, several experts believe a new peak looms for Shiba Inu. Specifically, some investors project that Shiba Inu will surge above $0.0001 in the ongoing 2024/2025 bull cycle. 

In May, Bitcoin investor Dona set a target of $0.000114 for SHIB, while top expert Javon Marks forecasts an imminent climb to $0.0001553. It remains unclear whether Shiba Inu will hit any of these targets before the end of the 2024/2025 bull market. 

Ethena (ENA) Eyes $1 After 18% Surge as Arthur Hayes Buying Spree Intensifies

Will Ethena (ETH) Price cross the $1 barrier as Arthus Hayes’s buying spree fuels a bull run?

Surpassing a $2 billion market cap, Ethena is back in action as Arthur Hayes continues to buy more ENA tokens. With rising investor interest, is ENA ready to cross the $1 mark? Let’s find out.

ENA’s price action in the daily chart shows a trend reversal rally gaining momentum. The ENA price has surpassed the resistance zone at $0.70 in a bullish formation.

Ethena Price Chart

Ethena Price ChartBased on previous price action, the recovery rally shows multiple post-retest reversals from the $0.33 crucial level and the $0.50 psychological zone. Currently, Ethena is trading at $0.71 following an 18% surge last night. This surge created a bullish engulfing candle, crossing the 61.8% Fibonacci retracement level at $0.6899.

After the bullish crossover between the 50-day and 100-day EMAs, the rising average line suggests a potential golden crossover. Meanwhile, the RSI remains sideways near the overbought boundary, indicating room for further growth.

Arthus Hayes Continues to Accumulate Ethena

In a recent buying spree, Arthur Hayes, co-founder of BitMEX, withdrew 10.36 million ENA tokens worth nearly $7.5 million. This withdrawal occurred on Binance, bringing his two-day buying spree to a total of 16.79 million ENA tokens.

Hayes’s average buying price remains at $0.666, and his current unrealized profit stands at $1.14 million. Thus, the growing confidence from high-net-worth individuals like Hayes signals the potential for a bull run in the near future.

Will ENA Price Cross $1?

The overnight surge overcomes the pullback from two consecutive bearish candles. As the intraday candle shows a higher price rejection, the broader market anticipates a post-retest jump in ENA.

Based on Fibonacci levels, the immediate resistance for ENA is at $0.9595, followed by the $1.46 peak. On the downside, the crucial support for Ethena is at $0.54.

As Ethereum Breaks Five-Month High, Analyst Says ETH is Headed for $6,000

Will Ethereum (ETH) reach the $4,000 mark as the bullish momentum crosses the $3,600 milestone? 

As Ethereum breaks a multi-month high of $3,600, the bullish surge increases the chances of reaching $4,000. As one of the previously underperformers, the refreshed momentum has improved the sentiment of the Ethereum market. 

Given this optimism, one analyst remains firm in his Ethereum price target of $6,000. Will Ethereum reach a new all-time high? Let’s explore.

Ethereum Price Analysis

On the daily chart, Ethereum’s price trend shows a breakout from a falling channel, gaining momentum. The breakout rally has completed a rounding-bottom reversal, surpassing the $3,550 mark.

Ethereum price Target

This crucial resistance acted as the neckline of the rounding-bottom reversal and marked the previous peak in July before the massive drop to $2,100 levels in August. 

Ethereum is trading at $3,594, with an intraday pullback of 1.71%. This pullback comes after last night’s massive jump of 10.05%, which resulted in a bullish engulfing candle above the 78.6% Fibonacci level. 

Furthermore, it marked the new highest price since June 2024. Hence, the six-month bearish cycle is ending on a bullish note. 

The 100-day and 200-day EMAs are on the verge of crossing bullishly. This follows a recent golden crossover, reflecting the change in the underlying sentiment. 

Furthermore, the RSI line escapes a sideways trend near the overbought boundary, revealing room for growth. Hence, the technical indicators maintain a bullish viewpoint on Ethereum. 

Analyst Targets $6,000 for Ethereum

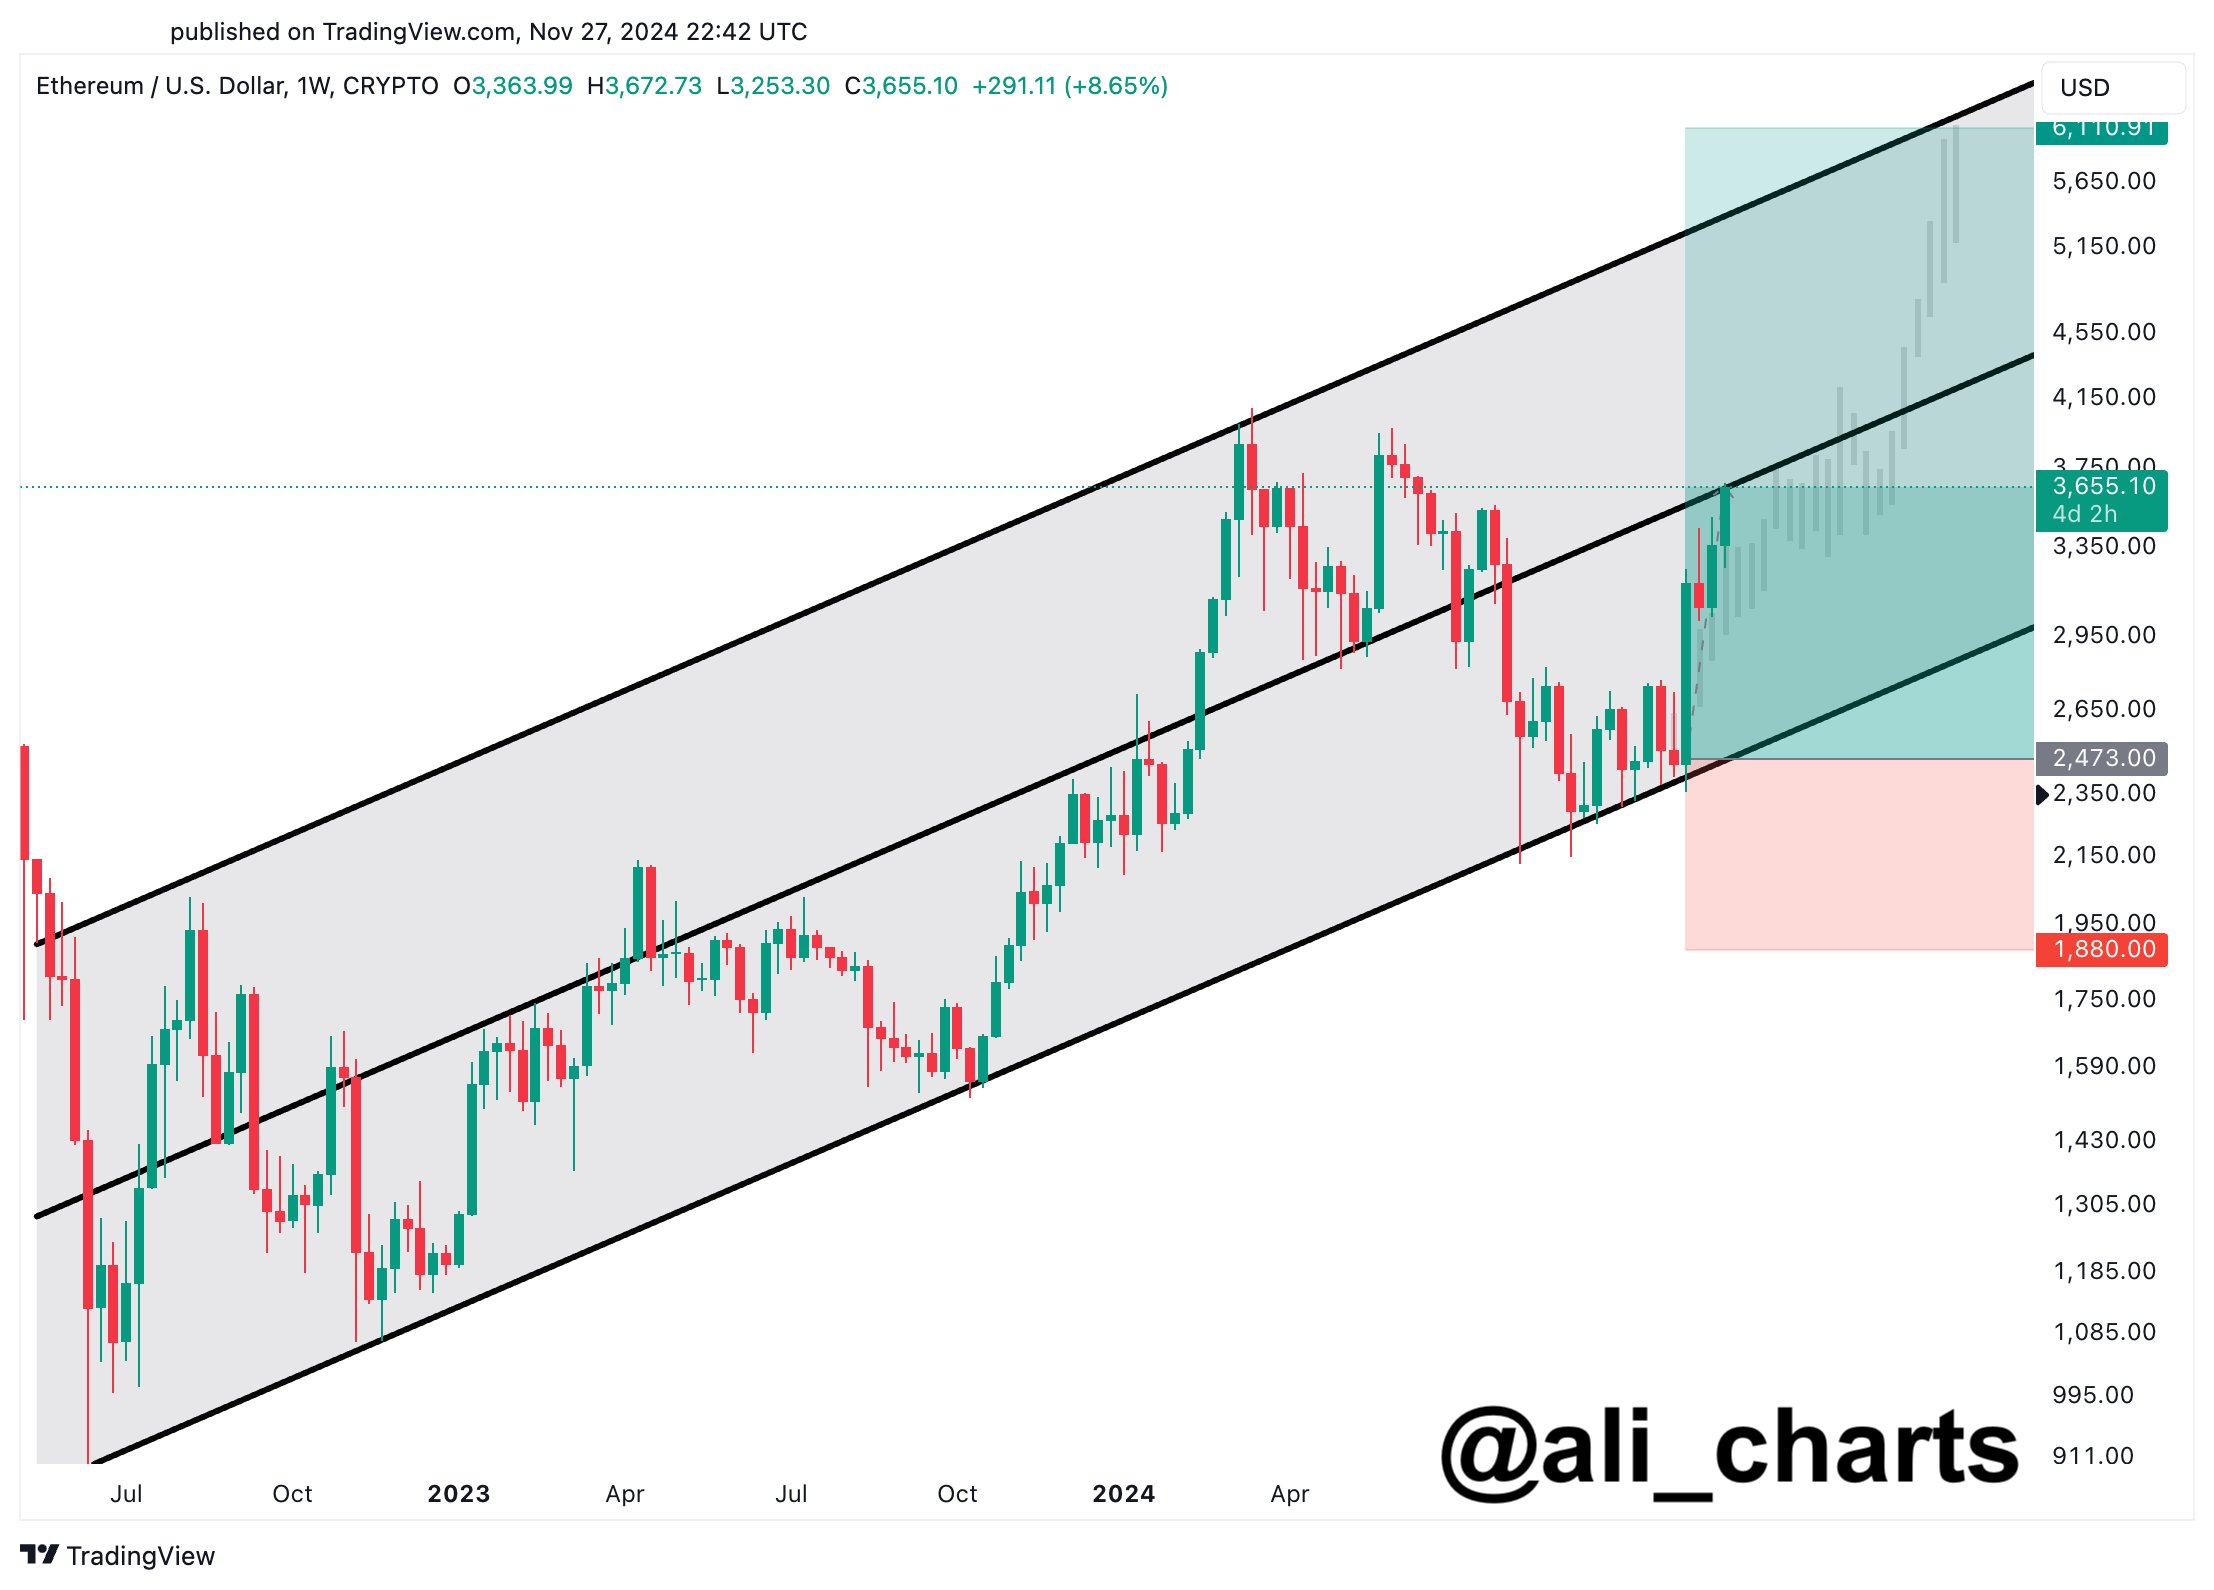
Crypto analyst Ali Martinez has remained steadfast in his positive outlook for Ethereum, supporting the possibility of continued upward movement. In his analysis, he highlights a rising channel pattern on the weekly chart and projects a mid-term target of $6,000, with a long-term target of $10,000.

According to his analysis, the current rally has reached the midline of the rising channel and will likely target $6,000 if it tests the upper boundary of the channel. Given the current bullish momentum, Ethereum could reach $6,000 if it surpasses the midline.

Image

Ethereum Target Levels

Notably, the intraday pullback could be a retest of the 78.6% Fibonacci level breakout and witness a bounce-back. Hence, as the broad market recovers, the Ethereum price trend will likely reach the immediate resistance of $4,091. 

On the flip side, the crucial support remains at $3,300 and $3,000.