Home Blog

Is XRP in Another Bull Trap as It Repeats a Familiar Cycle Structure

0

XRP Repeats Historical Bull-Trap Structure as Weekly Price Tests $1.70.

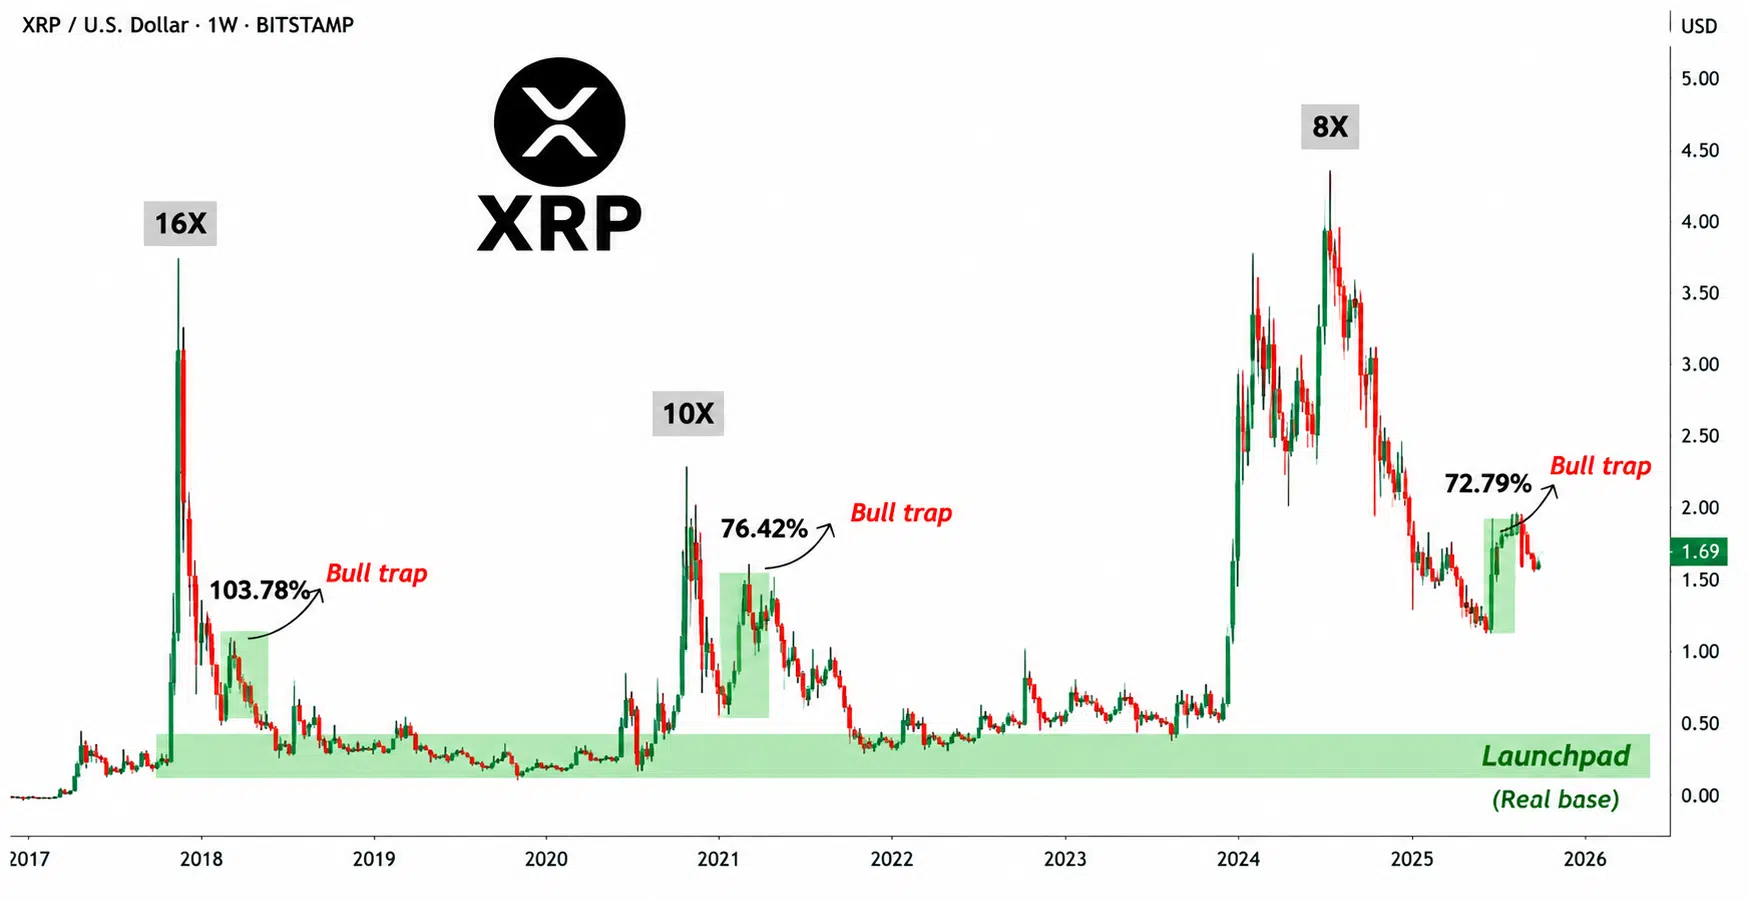
The Crypto Basic found that XRP’s weekly structure is repeating a sequence visible in two earlier market cycles: major decline, aggressive rebound, failed recovery, extended range, and finally a durable base before the next large expansion.
XRP weekly Chart, XRP rally a bull trap
XRP weekly Chart: Is the XRP rally a bull trap?

The important point in the current chart is that the $0.98 low should not automatically be classified as XRP’s final cycle base. Based on the historical structure, XRP is still in the rebound/testing portion of the cycle.

What the Previous XRP Cycles Show

In the first historical sequence, XRP recorded an approximately 103.78% rebound following its initial decline. That recovery did not develop directly into a sustained markup. Price rolled over and eventually entered a much longer consolidation around $0.20–$0.40.

That lower range became the more important structural base. The subsequent expansion produced the chart’s approximately 16x advance.

The second sequence followed a comparable pattern. XRP initially recovered approximately 76.42%, but that rebound also failed to establish a sustained uptrend. XRP Price returned toward a lower trading range and spent considerable time building a base.

Only after that consolidation was completed did the larger expansion occur, producing the approximately 10x move highlighted on the chart.

XRP Is Currently in the Middle of the Sequence

The present cycle began with XRP falling from above $3 toward approximately $0.98.

From $0.98, XRP then rebounded approximately 72.79%, carrying the weekly price toward $1.69–$1.70.

The percentage is notable because the current 72.79% rebound is already approaching the magnitude of the previous 76.42% recovery. Both are substantially below the earlier 103.78% rebound, but all three demonstrate that XRP can produce very large countertrend advances before a longer-term base is established.

The Crypto basic reading of the structure therefore places XRP in the post-markdown rebound/testing stage, not yet in a confirmed long-term markup.

Has the Real XRP Base Formed?

Not on this chart yet.

The $0.98 wick represents the lowest point of the latest decline, but a low and a completed base are different structures.

In both previous examples, XRP first bounced sharply from a low. The market then returned to a prolonged range where repeated price tests established the area that eventually became the launchpad for the next expansion.

The current structure has completed the first two parts:

Decline to $0.98 → 72.79% rebound toward $1.70.

What is still missing is the prolonged stabilization and retesting phase visible after the previous bull-trap rebounds.

Wyckoff Cycle Reading

The move from the 2025 high above $3 toward $0.98 represents the chart’s markdown phase. The rebound from $0.98 toward $1.70 is the subsequent recovery.

At present, we would classify XRP as transitioning from late markdown into an early potential accumulation/trading-range process. There is not enough price structure on the chart to classify it as established markup.

The latest $1.69–$1.70 region is therefore the critical structural test on this chart. A rejection would make the present sequence resemble the previous failed rebounds more closely. Sustained weekly acceptance beyond this region would instead separate the current structure from those historical bull-trap examples.

Because the chart contains no volume panel, this classification is based entirely on weekly price structure rather than volume confirmation.

Ash Crypto Predicts XRP Price for This Bull Run, Sees It as Biggest in Crypto History

0

Ash Crypto Sets XRP Target as He Predicts Major Crypto Market Rally.

Crypto commentator Ash Crypto, who has approximately 2.1 million followers on X, has published a new set of crypto price targets that includes XRP reaching $10.

In his latest market outlook, Ash Crypto said he is aiming for $10 for XRP, while placing substantially higher targets on several other major cryptocurrencies. His projections include Bitcoin at $250,000, Ethereum at $10,000, and Solana at $1,000.

He also projected that Zcash could reach $5,000, while describing HYPE as having no defined upper target. For mid-cap cryptocurrencies, he said gains of as much as 20 times their current values are possible.

XRP Targeted at $10

The $10 XRP forecast represents one of the largest moves included in Ash Crypto’s outlook when compared with XRP’s current price.

With XRP recently trading around $1.64, a rise to $10 would require an increase of approximately 510%. Put another way, XRP would need to trade at roughly 6.1 times its $1.64 price to reach Ash Crypto’s stated target.

A move to $5 would represent approximately a 205% increase from $1.64, while reaching $10 would add another 100% from the $5 level.

Ash Crypto did not provide a specific date for XRP to reach $10 in the statement provided.

Multiple Crypto Price Targets

The XRP projection forms part of a broader set of targets rather than a standalone XRP forecast. Ash Crypto placed Bitcoin’s target at $250,000, Ethereum’s at $10,000 and Solana’s at $1,000.

He characterized the current market environment as the beginning of what he expects to become the largest crypto bull run in history. That characterization represents his market outlook rather than an established market outcome.

XRP to $10 Predictions

Ash Crypto’s target is part of a broader group of 2026 projections rather than the first call at that level.

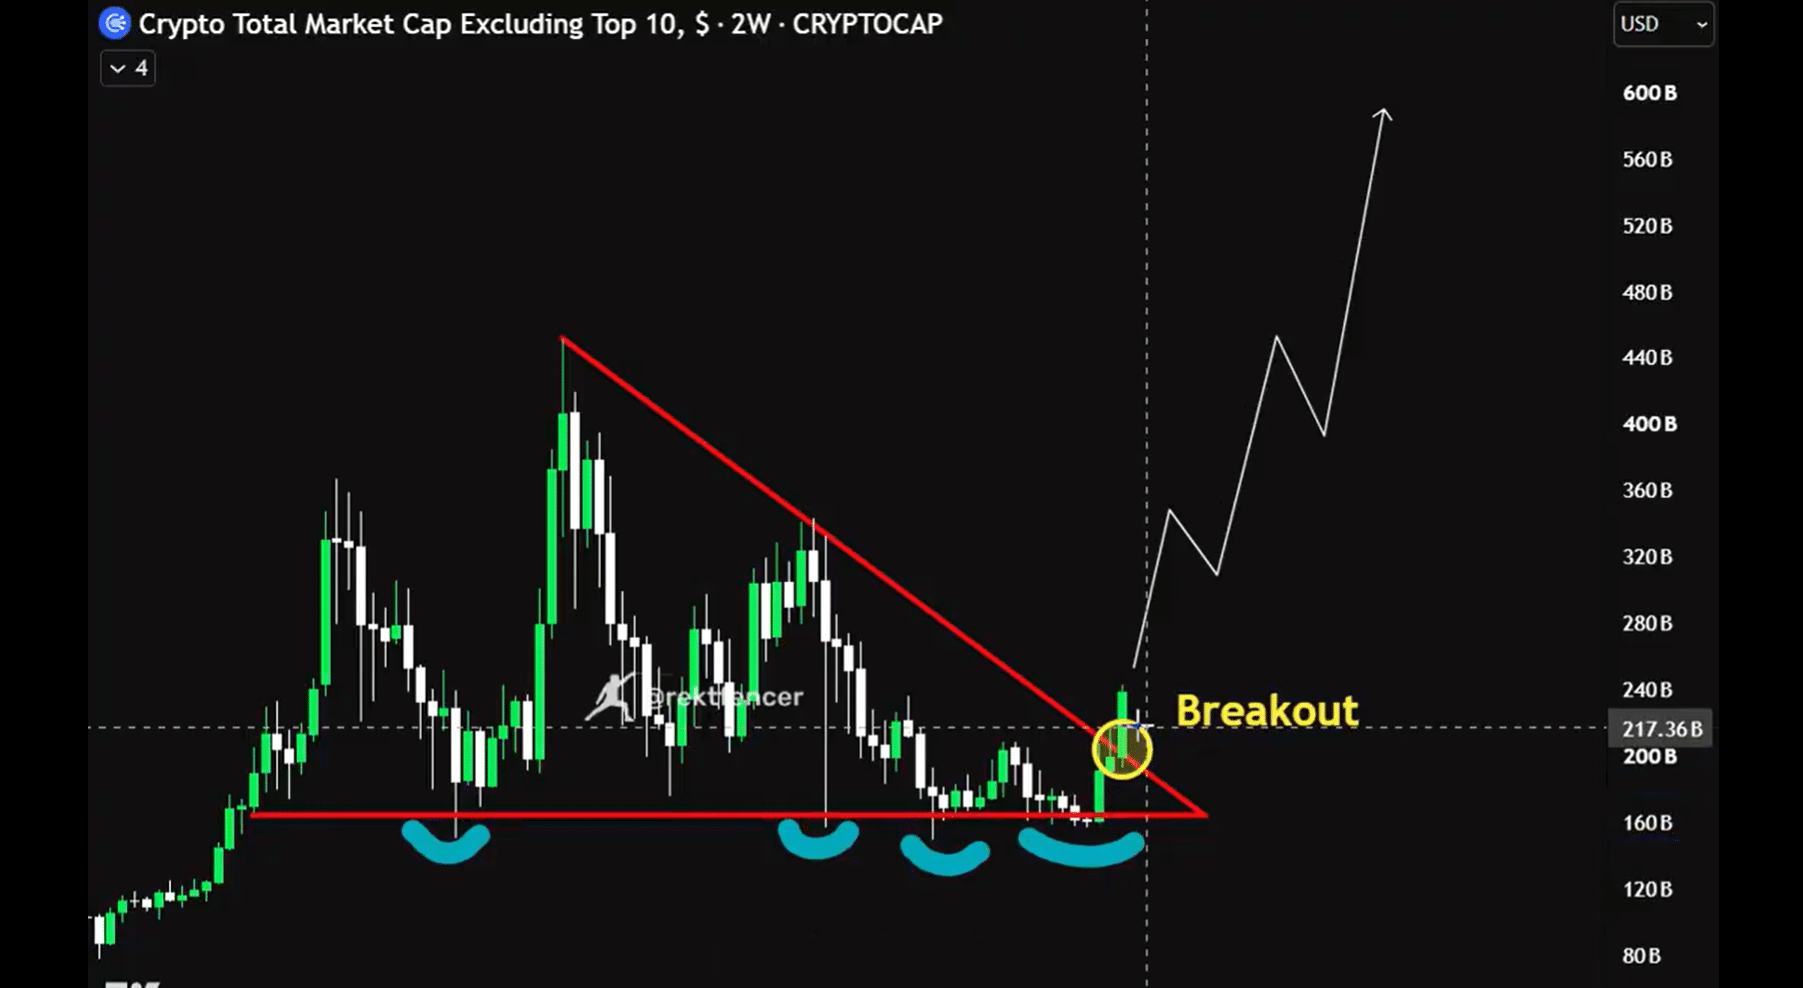
Crypto Cup published a $10 XRP target on September 22, alongside targets of $5,000 for ETH, $450 for SOL and $5 for SUI. His call followed a breakout above long-term descending resistance in the crypto market capitalization excluding the top 10 assets. He did not provide a specific deadline for XRP.

Crypto Patel also presented a longer-term XRP chart with a target zone around $9.20–$10. In August, Patel argued that XRP’s previous large-cycle advances provided historical context for a potential move into the $10–$20 range.

Celal Kucuker has repeatedly discussed $10 XRP. In June, he projected XRP could reach $10 within roughly 11–12 months, using a long-term ascending structure and support levels in his analysis. Another report placed his projected window around late 2026 to early 2027.

Zach Rector outlined a separate 2026 scenario in January. His stated range was $5 to $10 for XRP during 2026, with his thesis linked to broader liquidity conditions and a potential altcoin-market expansion.

For XRP specifically, the measurable forecast contained in the statement is $10. From a reference price of approximately $1.64, that target implies an increase of about $8.36 per XRP, or roughly 510%.

Tesla Made $100 Million From Bitcoin Without Adding a Single BTC

0

Tesla’s Bitcoin Holdings Approach $1 Billion After BTC’s 14% Weekly Rise.

According to Arkham data, Tesla’s Bitcoin position is approaching a market value of $1 billion after BTC recorded a sharp increase over the past week.


The electric vehicle manufacturer holds 11,509 BTC, currently valued at approximately $994.90 million, based on the figures provided. The value of the position increased by about $122.62 million in one week as Bitcoin rose roughly 14%.

At $994.90 million, Tesla’s Bitcoin holdings are approximately $5.1 million short of the $1 billion threshold. The weekly increase reflects the higher market price of Bitcoin rather than a new purchase or realized profit.

Tesla’s Bitcoin Holdings Date Back to 2021

Tesla made its major entry into Bitcoin in early 2021, when the company disclosed a $1.5 billion investment in the cryptocurrency. It also briefly allowed customers to purchase vehicles using Bitcoin before ending the payment option later that year.

Tesla subsequently reduced its position. The company’s largest disposal occurred in 2022, when it converted a substantial portion of its Bitcoin holdings into traditional currency and reported proceeds of approximately $936 million from the sale.

Following those reductions, Tesla retained a smaller Bitcoin treasury. Its current balance stands at 11,509 BTC, and the supplied data indicates that the company has maintained this position for roughly four years.

Bitcoin Price Changes Move Tesla’s Holdings by Millions

The size of Tesla’s remaining position means changes in Bitcoin’s market price can produce substantial changes in its dollar valuation.

With 11,509 BTC, every $1,000 movement in Bitcoin changes the market value of the position by approximately $11.51 million. A $10,000 increase would correspond to roughly $115.09 million in additional market value, assuming the number of Bitcoin held remains unchanged.

The latest 14% weekly Bitcoin increase has consequently pushed Tesla’s position close to ten figures. Based on the supplied valuation, the company’s 11,509 BTC are now worth about $994.90 million, compared with approximately $872.28 million a week earlier.

The roughly $122.62 million difference is an increase in the market value of the holdings, rather than cash generated or realized profit from selling Bitcoin.

3,647 New XRP Wallets Created as Price Breaks Past $1.64

0

XRP Breaks Above $1.60 as Whale Transactions and New Wallet Activity Surge.

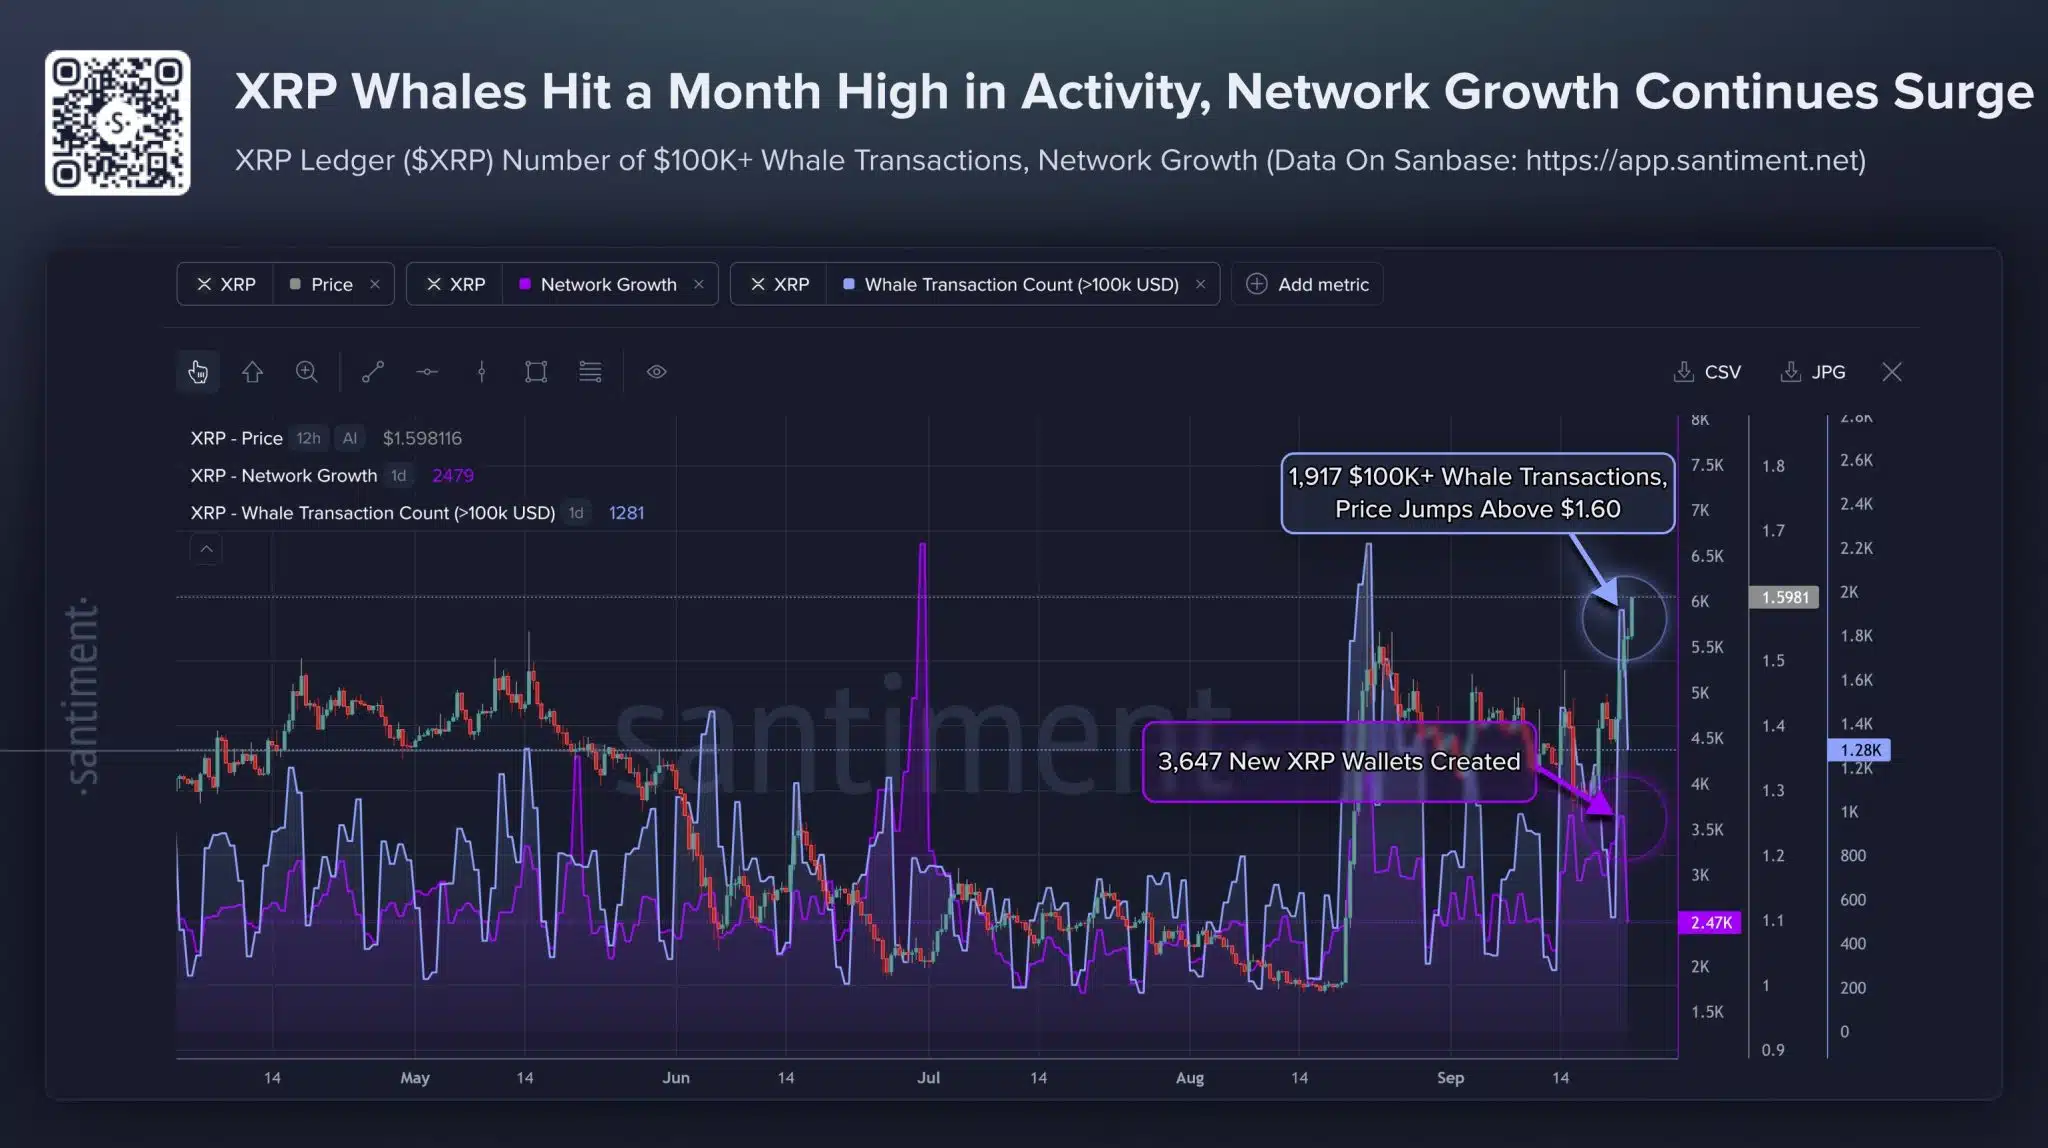
XRP’s market value has moved above $1.60 for the first time since February 4, according to data shared by Santiment, with the price increase occurring alongside a sharp rise in large transactions and XRP Ledger network growth.

xrp whale activity hits a month high
XRP whale activity hits a month high

Santiment’s chart shows XRP reaching the $1.60 area as the number of transactions valued at more than $100,000 climbed to 1,917, representing the strongest high-value transaction activity in roughly a month.

The increase in whale transactions measures activity rather than direction. The data does not establish whether the transactions represented accumulation, selling, transfers between wallets, or other movements. It does, however, show substantially increased activity among addresses conducting large-value XRP transactions while the market price advanced.

XRP Network Growth Accelerates

Network growth also increased during the price move. Santiment recorded 3,647 newly created XRP wallets, indicating that the latest advance coincided with an influx of new addresses rather than activity being limited to existing wallets.

The supplied Santiment chart tracks XRP’s price, network growth, and transactions above $100,000. Both network growth and large transactions show pronounced increases near the latest price advance.

XRPL Asset and RLUSD Activity Expands

The latest market activity comes as the XRP Ledger’s financial infrastructure has also expanded. According to the supplied data, tokenized-asset and RLUSD balances on XRPL recently reached approximately $4.26 billion, while Ripple reports roughly $2.4 billion of RLUSD in circulation.

Those figures cover a different part of the XRP ecosystem than whale transactions and wallet creation. They measure assets and stablecoin activity connected with XRPL rather than XRP trading activity itself.

Institutional market access has also continued to develop. According to the information provided, Bitwise filed an updated XRP ETF registration with the U.S. Securities and Exchange Commission on September 18, while XRP is already represented through several exchange-traded products.

The latest data therefore shows several developments occurring around the same period: XRP moving above $1.60, 1,917 transactions exceeding $100,000, 3,647 new XRP wallets, and increased asset and stablecoin activity across XRPL. These metrics measure different aspects of XRP market and network activity and do not, individually, establish the direction of subsequent price movement.

Current XRP Price

According to CoinMarketCap, XRP is currently trading around $1.64, up 7.96% over the past 24 hours. The token has traded between $1.50 and $1.65 during the period, placing it near its daily high.

XRP’s market capitalization stands at approximately $103.61 billion, while 24-hour trading volume is about $7.3 billion. The latest move also puts XRP above the previously highlighted $1.56–$1.60 technical region.

Glassnode: Bitcoin MVRV Momentum Turns Positive, Echoing 2019 and 2023

0

Glassnode Says Bitcoin Flashes Momentum Signal Seen at Start of Last Two Bull Markets.

Bitcoin has recorded a fresh shift in a closely tracked on-chain valuation metric, with Glassnode data showing MVRV momentum moving back into positive territory.

Bitcoin MVRV Momentum Turns Positive

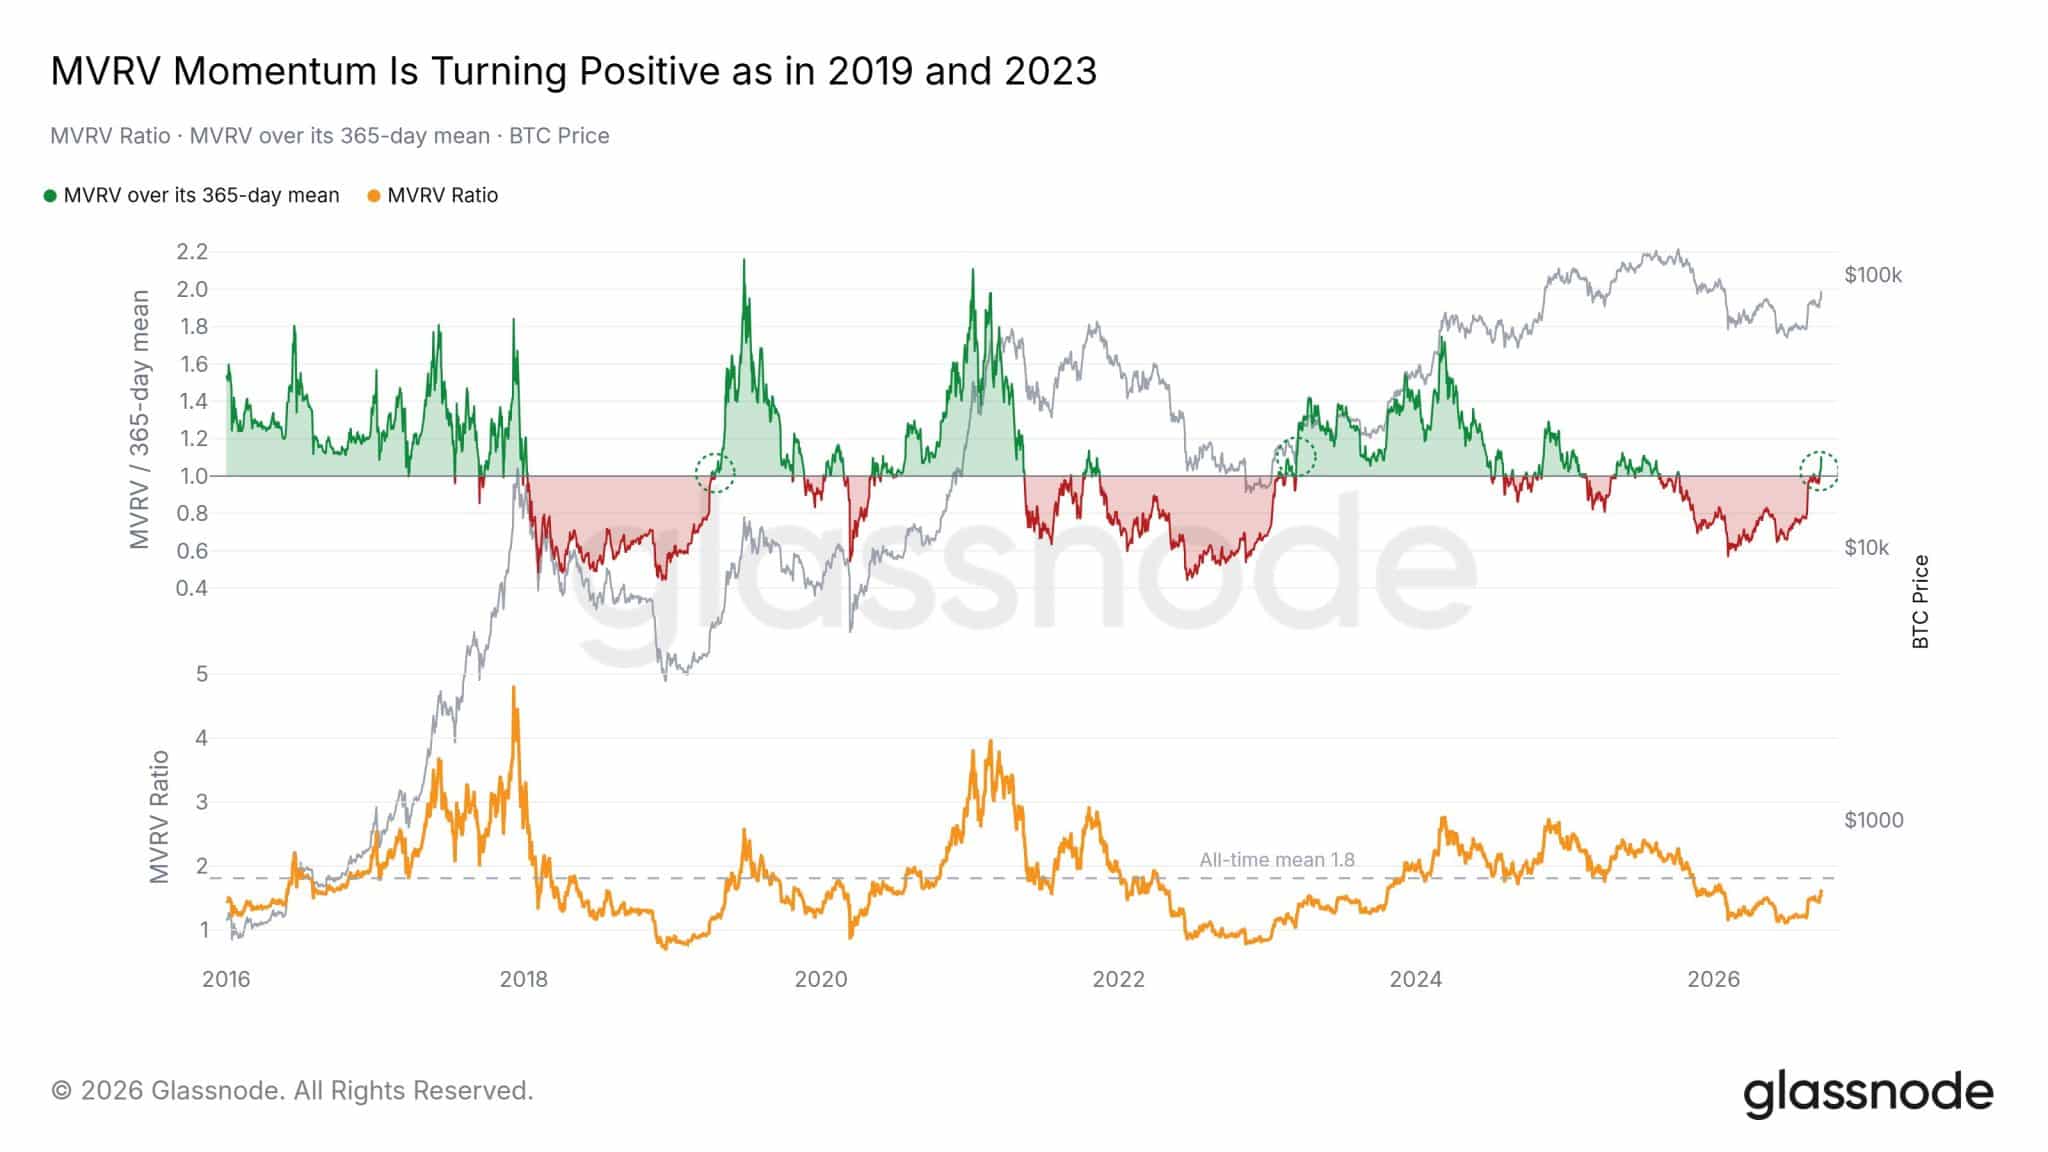
The latest Glassnode chart shows Bitcoin’s MVRV Ratio crossing back above its 365-day moving average. Glassnode defines its MVRV Momentum Oscillator as the MVRV ratio divided by its one-year moving average, minus one. A reading above zero therefore means MVRV is trading above its annual trend.

Glassnode Chart Analysis in Detail

Glassnode chart covers roughly 2016 through 2026 and combines three pieces of information: Bitcoin price, the MVRV Ratio, and MVRV’s position relative to its 365-day average.

The important development is at the far right: MVRV momentum has just moved back above its one-year baseline, producing a transition that visually resembles the marked 2019 and 2023 crossovers.

1. What the upper panel is showing

The grey line is Bitcoin’s price, read against the logarithmic scale on the right. The colored series measures MVRV relative to its 365-day mean.

The horizontal 1.0 line is the key dividing point. When the series is green and above 1.0, MVRV is above its 365-day average. When it is red and below 1.0, MVRV is below that annual baseline.

At the far right of the chart, the indicator has climbed out of the red region and is crossing approximately 1.0. Glassnode circles this transition in green.

This does not mean MVRV itself equals 1.0. It means MVRV divided by its 365-day mean is approximately 1.0—in other words, MVRV has caught up with its annual average.

2. Why 2019 is highlighted

The first dotted green circle appears around 2019.

Bitcoin had already experienced the major 2018 bear-market decline. During that period, MVRV momentum spent considerable time below 1.0, shown in red.

Around 2019, it recovered through the 1.0 threshold. The indicator then accelerated well into the green region while Bitcoin simultaneously moved out of its bear-market lows.

So the chart is using 2019 as an example of a transition from negative MVRV momentum → crossover → positive MVRV momentum.

3. The 2023 comparison

The second highlighted transition occurs around 2023, following Bitcoin’s 2022 decline.

Again, MVRV momentum had spent an extended period below its 365-day mean. It subsequently crossed above 1.0 and turned green.

Bitcoin’s price was around the lower portion of its post-2022 recovery at that stage. The indicator remained predominantly positive during much of the subsequent expansion into 2024.

The common sequence displayed for both 2019 and 2023 is therefore:

extended red period → recovery toward 1.0 → crossover → green/positive MVRV momentum → major BTC price expansion afterward.

4. What happened through 2024–2026

This section is particularly important because the current signal did not appear immediately after Bitcoin’s previous major advance.

MVRV momentum was strongly positive during parts of 2023 and 2024, at one stage reaching roughly 1.6–1.7 relative to its annual mean.

Momentum subsequently weakened. There were several movements around the 1.0 boundary before a more persistent deterioration developed into 2025–2026.

The indicator eventually fell toward approximately 0.6, representing one of the deeper negative readings visible in the recent portion of the chart.

It has now recovered sharply from that depressed area back toward and slightly through 1.0.

That is the change Glassnode is highlighting.

5. The lower MVRV panel adds important context

The orange line is the actual MVRV Ratio rather than its momentum relative to the annual average.

The dashed horizontal line at approximately 1.8 is explicitly labeled the all-time mean.

The current MVRV Ratio appears around 1.5–1.6, meaning it remains below the displayed historical average even as its momentum measure turns positive.

This distinction matters.

The chart is not showing MVRV at historically extreme levels. Instead, it shows MVRV recovering sufficiently to overtake its own 365-day average.

Earlier major market peaks had much higher readings. MVRV reached above 4 around the 2017 peak and approached approximately 4 again around 2021. The present reading is considerably lower.

6. What the latest section says about Bitcoin’s market cycle

From a market-cycle perspective, the chart shows three stages in the recent sequence.

During the 2025–2026 weakening period, MVRV momentum dropped below its annual trend and remained predominantly red. That corresponds to the contraction/markdown portion of the valuation cycle.

The bottoming and sideways portion of the indicator represents stabilization and potential re-accumulation.

The latest movement through 1.0 is the first evidence on this particular metric of a transition from that negative regime toward a positive momentum regime.

The important distinction is that this is a momentum crossover, rather than an MVRV valuation extreme.

7. Why Glassnode compares the present setup with 2019 and 2023

The similarity is specifically in the structure of the indicator, not an assertion that Bitcoin must reproduce the exact price path of either year.

All three highlighted areas contain the same basic event: MVRV was below its 365-day mean and subsequently recovered through it.

In 2019, the transition came after the 2018 bear market.

In 2023, it came after the 2022 bear market.

In 2026, the chart shows the indicator making the same type of transition after an extended period of negative momentum.

That is why the chart title says “MVRV Momentum Is Turning Positive as in 2019 and 2023.”

Bottom line from the chart

The most significant information is not simply that MVRV is rising. It is the combination of three visible facts: MVRV momentum recovered from roughly 0.6, reached the 1.0 regime boundary, and has begun crossing above its 365-day mean while absolute MVRV remains below its displayed 1.8 historical average.

On the historical examples selected by Glassnode, the comparable 2019 and 2023 crossovers occurred near major transitions from depressed/contracting market conditions into subsequent expansion phases. The 2026 chart has now reached that same indicator threshold; the future price path drawn from here is not contained in this chart.

Bitcoin Supertrend Flashes Buy Signal—Last Signal Preceded 700% BTC Rally

0

Bitcoin has received a new buy signal from the Supertrend indicator. Crypto commentator Rand Group noted that the indicator has turned green again, this time around $84,000.

The last time it gave a buy signal, Bitcoin was trading around $16,000. According to Rand Group, the indicator stayed green for about three years while Bitcoin rose roughly 700%. With the Supertrend turning bullish again at around $84,000, hopes are rising for another mega price rally.

Bitcoin Supertrend Points to Big BTC Rally

The chart shows Bitcoin’s price alongside the Supertrend indicator. The indicator turned green in early 2023, when Bitcoin was trading around $16,000. Bitcoin then went on a prolonged rally, surpassing $100,000 in December 2024 and reaching around $120,000 by October 2025.

In other words, the green signal lasted roughly three years before turning into a sell signal. Meanwhile, Bitcoin fell from above $100,000 to around $57,700 in July 2026. Now, the Supertrend has turned green again, with Bitcoin trading around $84,000.

In simple terms, the indicator is showing another buy signal after previously turning green ahead of a major Bitcoin rally. So far, Bitcoin has surged 51% from its cycle low of $57,700 over the past two months.

Bitcoin
Bitcoin

What the New Signal Means for Bitcoin

The Supertrend is a tool that uses Bitcoin’s price and volatility to show the direction of the trend. Green usually means the trend is moving upward, while red usually means the trend is moving downward.

Bitcoin’s latest green signal suggests that the trend may be turning upward again after its recent decline. However, the previous 700% rise does not mean Bitcoin will repeat the same move. Regardless of the potential upside, the indicator suggests a return to an upward trend, but it does not guarantee another major rally.

End of Bear Market?

This week, Bitcoin moved back above its 365-day moving average, which is around $83,000. CryptoQuant founder Ki Young Ju said this was the signal traders were watching for the end of the bear market and for institutional FOMO to resume.

Analyst Ted Pillows also pointed to a higher weekly high and a move above the 50-week moving average as signs that BTC’s bottom is already in.

Bitcoin’s next major technical level is around $88,761, its two-year moving average. Holding above this level could indicate stronger upward momentum.

Bitcoin’s September 20 weekly close at $81,159 was about 3% above its 50-week moving average and 24% above its 200-week moving average. It was the first close above the 50-week moving average in 45 weeks.

Historically, Bitcoin’s recovery above its 50-week moving average has often been followed by further gains.

Crypto Cup Sets New XRP Target as Altcoin Market Breaks Long-Term Resistance

0

Crypto Cup Sets XRP Target as Altcoin Market Breaks Long-Term Resistance.

Crypto trader and investor Crypto Cup (@cryptocupra), with more than 70K X followers, has published new price targets for several major altcoins after a chart of the broader altcoin market moved above a multi-year descending resistance line.

 Cup listed targets of $5,000 for Ethereum, $450 for Solana, $10 for XRP and $5 for Sui, describing the latest move as an altcoin breakout. These figures are the trader’s projections rather than completed price moves.

The accompanying two-week chart tracks the total crypto market capitalization excluding the top 10 assets. It shows the market holding a horizontal area around $160 billion through several tests while successive peaks formed a descending trendline. The latest candle has moved above that falling boundary, with the chart displaying market capitalization around $217.36 billion.

Crypto marketcap excluding top 10
Crypto market cap excluding top 10

The white path extending toward roughly $600 billion on the right side of the chart represents a projection and is not historical market-cap data.

XRP Target at $10

For XRP, Cup’s $10 target is substantially above its current price region. XRP has recently traded around the mid-$1.50 range, meaning a move from $1.56 to $10 would equal approximately 541%, taking the price to about 6.4 times that reference level.

How the $10 XRP Target Compares

Cup’s projection is higher than the latest long-term target published by veteran trader Peter Brandt. Brandt said on September 21 that his monthly XRP chart implied an “eventual” move to $5.40, without providing a completion date.

Cup’s $10 figure is therefore 85.2% above Brandt’s $5.40 target.

The $10 level is not unique to Cup’s analysis. CryptoPatel has previously published a longer-term XRP chart targeting approximately $9.20–$10, while other technical projections covered this year have extended as high as $17.

At $10, XRP’s valuation would also change substantially. Using approximately 61.1 billion XRP in circulation, a $10 token price corresponds to a circulating market capitalization of roughly $611 billion.

Cup did not provide specific dates for XRP, ETH, SOL, or SUI to reach the stated targets. His forecast is tied to the breakout structure shown on the broader altcoin-market chart rather than a stated timetable for each individual asset.

XRP Breaks $1.56 Resistance as Chart Points to New Price Target

0

XRP Breaks $1.56 After 27.6% Rally as Inverse Head-and-Shoulders Pattern Nears Confirmation.

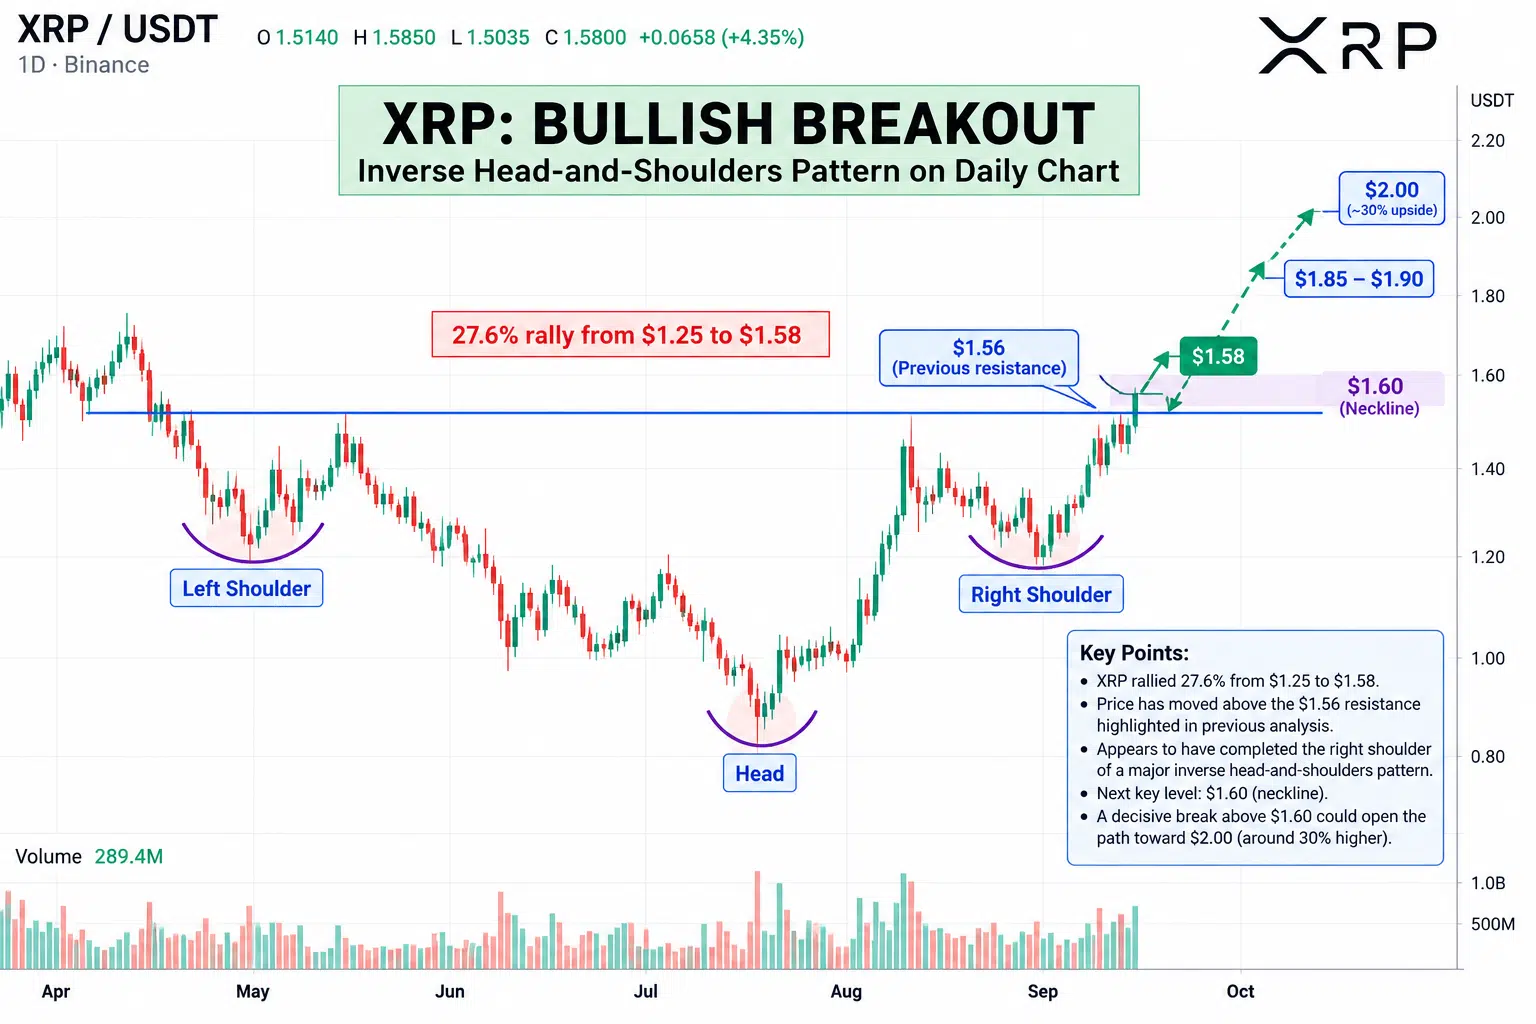
XRP has moved through the $1.56 resistance level highlighted in our previous technical coverage, with the latest daily chart showing price around $1.58 following a 27.6% advance from approximately $1.25.

XRP next targets, Bullish breakout
XRP next targets: Bullish breakout

The move places XRP directly around the neckline of a large inverse head-and-shoulders formation visible on the daily timeframe. The chart identifies a left shoulder during the April-May period, a head around the August low near $1.00, and a right shoulder formed during the September pullback.

XRP Moves Above Previously Tested $1.56 Level

In our previous report, XRP was trading near $1.54 and approaching approximately $1.56 for the fifth time in 2026. Four earlier attempts had failed to produce a sustained move through that area.

The latest chart shows XRP reaching approximately $1.58, placing price above $1.56 on an intraday basis.

$1.25 was the starting point of the right shoulder; the move to $1.58 represents an increase of roughly 26.4%; the cited 27.6% rally may reflect different intraday endpoints.

The next nearby area highlighted by the new chart is around $1.60, which also corresponds closely with the neckline of the inverse head-and-shoulders formation.

Chart Maps Potential Move Toward $2

The technical projection accompanying the chart places approximately $2.00 as the measured upside objective if XRP establishes a breakout above the neckline.

From $1.58, reaching $2 would represent an additional increase of approximately 26.6%. From a $1.60 breakout reference, the move to $2 equals 25%.

The projected path on the chart first moves through $1.60, consolidates around the $1.60–$1.65 region, and then extends toward approximately $1.85–$1.90 before reaching $2. That path is a chart projection rather than completed price action.

The current chart therefore places XRP at the intersection of three previously identified levels: the repeatedly tested $1.56 resistance, the inverse head-and-shoulders neckline around $1.60, and the large historical supply concentration around the same $1.60 region.

Higher Price Targets Emerge as XRP Approaches $1.56 Resistance for Fifth Time This Year

0

XRP approaches $1.56 resistance for a fifth attempt in 2026, with chart levels indicating $1.70, $1.90, and $2.28 if the resistance breaks.

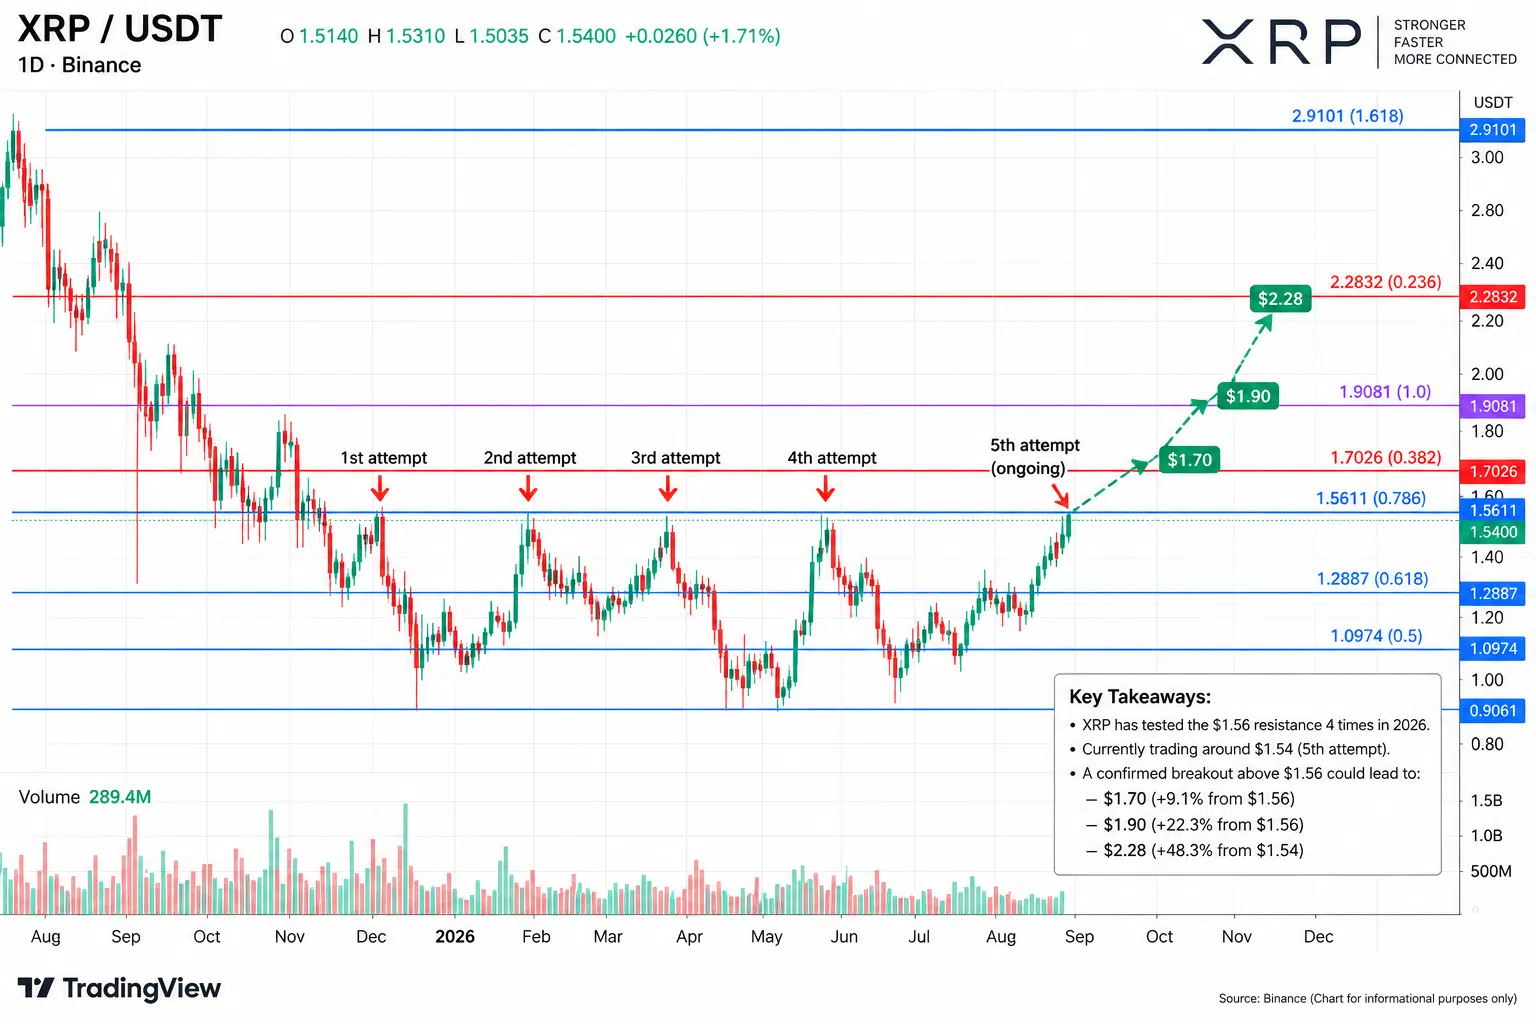
XRP is approaching the $1.56 resistance area for the fifth time this year, with XRP currently trading around $1.54. The daily chart shows that the same region rejected four previous advances during 2026, making the latest test a continuation of a resistance structure that has persisted for several months.

XRP needs to break $1.56

The chart places the resistance at approximately $1.5611, corresponding to the displayed 0.786 Fibonacci level. XRP is now only about 1.4% below that threshold.

Four Previous Tests Stopped Near $1.56

The chart marks four earlier advances toward the $1.56 area between February and August. Each attempt was followed by a move back into the broader trading range rather than a sustained daily advance above the level.

The latest recovery began after XRP traded near $1.00 in August. Price subsequently jumped above $1.28 and returned toward $1.50. The current chart shows XRP around $1.5285, while the supplied current market price of $1.54 places it even closer to resistance.

The latest five daily candles show a recovery from roughly the $1.28–$1.30 region. Lower wicks during the pullback indicate intraday buying responses, followed by expanding bullish candles toward $1.50. The latest candles are again testing the upper boundary that stopped previous advances.

What Comes After $1.56?

If XRP records a sustained breakout above $1.5611, the chart identifies $1.7026 as the next major displayed Fibonacci level. From $1.56, that represents an additional increase of approximately 9.1%.

Above $1.70, the next major zone is around $1.90–$1.91. The chart specifically marks $1.9081, placing it roughly 22.3% above $1.56 and about 23.9% above the current $1.54 price.

The higher resistance band—the “red tape” referenced in the accompanying analysis—is positioned around $2.28, with the chart’s 0.236 Fibonacci level at $2.2832. A move from $1.54 to that level would equal approximately 48.3%.

Beyond that, the chart displays another major reference near $2.91, but that sits considerably above the immediate breakout structure.

The technical sequence displayed on the chart is therefore $1.56 → $1.70 → $1.90 → $2.28. These are chart-derived resistance levels rather than completed price moves. At the current $1.54 price, XRP is approaching the first level in that sequence after four previous tests of the same resistance area.

Circle Stock Rises as Binance Invests $100 Million, Expands Five-Year USDC Partnership

0

Circle Internet Group (NYSE: CRCL) shares gained 2.76% in pre-market trading Tuesday after Binance disclosed a $100 million investment in the stablecoin issuer and expanded a commercial agreement covering USDC use across the crypto exchange’s platform.

The move extended Monday’s 2.95% advance in Circle stock, when CRCL closed at $94.49.

The Binance announcement followed the Securities and Exchange Commission’s release of a new framework for certain tokenized U.S. equities. Bernstein analyst Gautam Chhugani named Circle among companies that could benefit from the regulatory changes.

Key Facts:

  • Binance purchased 1,237,011 Circle Class A shares at $80.84 each.
  • Circle and Binance entered an expanded five-year USDC commercial arrangement.
  • Binance plans to broaden USDC use in savings and investment products and offer incentives including lower fees on some USDC trading pairs.
  • The SEC’s Innovation Exemption creates a conditional pathway for qualifying tokenized U.S. stocks to trade through onchain venues.

Binance Buys 1.24 Million Circle Shares and Deepens USDC Partnership

Circle said in a Form 8-K filed Tuesday that Binance’s $100 million investment in Circle and the expanded partnership were executed on Sept. 17. Binance bought the shares through an unregistered private placement at $80.84 apiece, a price Circle said reflected a discount to CRCL’s market price prior to closing.

The shares are subject to transfer restrictions generally lasting until the earlier of two years after closing or certain specified termination events under the commercial agreement. Binance retains voting rights during the restricted period.

Separately, Circle agreed to pay Binance a monthly incentive fee calculated as a percentage of USDC held through Circle’s Modular Smart Contract Wallet infrastructure. Binance also agreed to undertake additional activities promoting USDC on its platform.

The new agreement replaces previous arrangements signed in November 2024 and August 2025.

A Binance spokesperson told The Wall Street Journal that the exchange plans to integrate USDC into existing and future digital-asset savings and investment products while using incentives such as lower spot-trading fees on USDC-denominated pairs.

The companies have also expanded their technical integration. Circle launched Arc’s public mainnet on Sept. 16, the same day Binance said it had completed integration of USDC deposits on the Layer-1 blockchain network, which is designed for stablecoin finance and onchain financial applications.

Circle Reports $73.3 Billion of USDC in Circulation

Circle reported $73.3 billion of USDC in circulation in the second quarter, up 19% from a year earlier. Reserve income increased 5% to $668 million, while total revenue and reserve income rose 7% to $701 million. 

Distribution, transaction, and other costs totaled $412 million in the quarter. Circle has said distribution expenses can increase as it adds partners and approved participants.

Circle’s 10-Q says reserve income is a function of stablecoins in circulation and the reserve return rate, while distribution costs payable to key distributors such as Binance are directly affected by USDC balances on their platforms.

SEC Issues Tokenized Securities Exemption

On Sept. 17, the SEC granted temporary, conditional relief allowing qualifying Tokenized Securities Venues to facilitate trading in tokenized National Market System stocks through permissioned automated-market-maker liquidity pools. 

The framework requires, among other conditions, that tokenized stocks provide holders the same rights and privileges as the equivalent traditional shares. Issuers must also receive notice and an opportunity to object before an unaffiliated third party makes their stock available. 

Smart contracts used by qualifying venues must be public, auditable, and deployed on a public, permissionless distributed ledger.

Bernstein’s Chhugani said the rules bring tokenized equities trading on public blockchains within the existing U.S. securities and exchange regulatory framework. He referenced Ethereum, Solana, and decentralized infrastructure such as Uniswap and named Circle alongside Coinbase, Robinhood, Bullish, and Figure Technology Solutions among companies he views as beneficiaries.

The SEC itself did not designate Ethereum, Solana, or Uniswap by name in its announcement; those references came from Bernstein’s analysis.

Market-data services also show Bernstein maintaining a positive rating on Circle with a $140 price target following the regulatory announcement.

CRCLon Trades Separately From NYSE-Listed Circle Shares

Circle Internet Group Tokenized Stock (CRCLon), an Ondo tokenized product tracking economic exposure to CRCL, was trading at $95.66 at 7:46 a.m. ET, down 1.04% over 24 hours, according to CoinMarketCap.

CRCLon is separate from NYSE-listed CRCL. Ondo says its tokenized products provide economic exposure to their underlying assets but are not themselves stocks, ETFs, or ADRs and do not provide holders with rights to hold or receive the underlying assets. The Ondo Stocks platform is not available to U.S.-based clients.

Circle’s filing and the SEC announcement do not state that CRCLon itself has been admitted to trade under the new U.S. Innovation Exemption.

Separately, Reuters reported early Tuesday, citing Bloomberg News, that U.S. federal prosecutors are investigating whether Binance violated sanctions on Iran by failing to prevent certain trading activity on its platform and are examining whether the exchange knowingly allowed the trading. Binance said it has a zero-tolerance approach to sanctions violations and cooperates with law enforcement; the Justice Department declined to comment.

What Comes Next

Binance said it plans to expand USDC integration across savings, investment, and trading products.

Future Circle filings and earnings reports will provide updated figures for USDC circulation, reserve income, and distribution-related expenses, while further SEC disclosures will show which venues and tokenized securities operate under the exemption.