Home Blog Page 1104

XRP Price of $20 Possible, Says Analyst, If XRP Reclaims Its 2017 Peak Against BTC

0

A notable analyst expects the XRP price to reach a two-digit figure if the altcoin recaptures its 2017 peak against Bitcoin.

The crypto market appears to be in a recovery phase, with XRP capitalizing on the ongoing rebound to reclaim pivotal support levels. After dropping to a low of $1.28 on Tuesday, XRP has since recovered the $1.3 and $1.4 psychological levels, now looking to solidify its position above $1.5.

XRP Breaches Descending Trendline Against Bitcoin 

Amid this push, the altcoin has sustained its upsurge against Bitcoin, a trend that began since Nov. 12, according to market data. Notably, this bullish trend has triggered optimism that XRP could outperform BTC in this bull run, with analyst CryptoBull predicting an ambitious price target if it can reclaim its 2017 BTC peak.

Data confirms that XRP had performed poorly against Bitcoin since January 2018, when it retraced from the $3.31 all-time high. The XRPBTC chart shows a descending trendline suggesting that XRP prices against Bitcoin plummeted rapidly over the past seven years.

XRP Price Against Bitcoin

An attempt to breach this trendline occurred last July, but XRP was unsuccessful due to the drop from the $0.93 high at the time. Now, XRP appears to have breached the trendline, having gained by a massive 111% against Bitcoin in November alone. 

However, XRP must close this month above the trendline to confirm the breakout. Meanwhile, despite the latest uptick, CryptoBull believes XRP still has further uptrend against Bitcoin. According to his latest analysis, the XRP market is still in the early phase of its bull run.

XRP Price Could Hit $20 if XRP Reclaims 2017 BTC Top

For context, despite the recent rally over Bitcoin, XRP still trades at a meager 0.00001544 BTC, miles below the peak price in early 2017. This is due to Bitcoin also witnessing an uptrend that recently saw it knock at the $100,000 price region.

CryptoBull expects XRP to continue in its uptrend until it reclaims the early 2017 peak. Notably, this peak stands at 0.0002454 BTC, a value XRP attained in May 2017 after months of underperformance. At its current price, XRP is still at least 1,500% away from this top.

If the altcoin records a similar rally to what the market witnessed in early 2017, CryptoBull’s analysis suggests that a push to the 0.0002454 BTC peak could bring XRP price to at least $20. Notably, with Bitcoin now trading for $95,800, a value of 0.00002454 BTC translates to $23 for the XRP price in dollar terms.

XRPBTC 1M Chart CryptoBull
XRPBTC 1M Chart | CryptoBull

Interestingly, the 2017 XRP price rally also began with a massive 308% gain against Bitcoin in March 2017. The XRP price sustained this push over the next three months. A repetition would see XRP outperform BTC in December 2024 and January 2025. At press time, XRP trades for $1.47, up 7% in the last 24 hours.

VanEck Exec Counters Ethereum Critics as ETH CME Open Interest Hits Record $2.3B

0

VanEck Digital Assets Research Head Matthew Sigel counters critics who think Ethereum is dead amid surge in ETH CME Open Interest.

In latest Ethereum news today, ETH recently criticized for lagging behind other assets during the latest uptrend, has taken center stage. While its performance trailed several altcoins during the latest market surge, latest developments suggest a major change.

For context, between Nov. 5 and 12, Ethereum rose by 44%, reaching $3,447. However, this growth fell short compared to altcoins like XRP, which recorded much higher gains during the same period. 

Following its climb, Ethereum corrected sharply, dropping nearly 10% by November 14. Critics used this underperformance as fodder, some going as far as declaring Ethereum “dead.”

Despite this, Ethereum has displayed resilience in recent times. After six days of consolidation, it rebounded with a 9% intraday gain on Nov. 21 and appears to be the biggest beneficiary of the ongoing market recovery among the top 10 assets, with a 4.52% increase today.

Ethereum Witnesses Record Open Interest

Amid the rebound, Matthew Sigel, VanEck’s head of digital assets research and a long-time Ethereum advocate, pointed to major activity in Ethereum’s futures market. 

According to his chart, Ethereum’s notional open interest on the Chicago Mercantile Exchange (CME) surged by 88% in three weeks, increasing from 350,950 ETH ($1.2 billion) on Nov. 4 to 662,600 ETH ($2.3 billion) on Nov. 22. He shared this data to counter the narrative that Ethereum is “dead.”

In response, finance lawyer Scott Johnsson disclosed that over $17 billion in net new USD stablecoins entered circulation in the past 30 days, with Ethereum accounting for over 97% of that change. 

Analysts Weigh In on Ethereum’s Future  

Meanwhile, CryptoWolf, a popular analyst, has remained bullish on Ethereum. Five days ago, he noted that Ethereum’s weekly chart is forming a massive triangle consolidation pattern, which has been compressing for three years. At the time, he projected a potential breakout targeting $20,000. 

However, in a recent follow-up post, he outlined his plan to stay bullish on Ethereum until mid-2025, aiming for $10,000 before shifting focus to the long-term target of $20,000 by the end of 2025.

Also, Michaël van de Poppe, a veteran analyst, expects Ethereum to hit $4,000 soon, as Bitcoin and altcoins consolidate before another surge. In a disclosure today, the analyst confirmed that he remains optimistic about Bitcoin reaching $100,000 this year, which could further benefit Ethereum.

Possible Bearish Signals

However, it is not all bullish for Ethereum. Amr Taha, recently observed a noteworthy trend in Ethereum’s derivative exchanges, citing data from market resource CryptoQuant. 

He highlighted two recent instances of significant inflows, with 42,000 ETH entering these platforms. Taha interpreted this as a signal of traders preparing for short positions as Ethereum nears its $3,500 resistance level. For context, ETH currently trades for $3,470, now eyeing $3,500.

In addition, Ethereum’s recent gains come amid challenges highlighted by CryptoQuant analyst Mac_D. He pointed out that Ethereum’s circulating velocity and transaction growth remain subdued. 

Current velocity, at seven times the total supply, lags behind historical patterns that marked previous rallies. The rise of faster and cheaper blockchain competitors like Solana and Tron further complicates Ethereum’s growth.

However, the market analyst acknowledged that Ethereum’s dominance as the second-largest cryptocurrency and a major collateral asset for institutional investors remains intact. 

Mac_D suggested that an increase in Ethereum’s price could stimulate lending and leverage in the DeFi space. In turn, this could trigger an altcoin season, supported by higher transaction volumes and network activity.

Here’s How High Shiba Inu Can Rise if SHIB Gets $50 Billion Daily Volume

0

Shiba Inu has the potential to reach new heights if it claims a $50 billion daily volume and most of this volume lean toward the buy side. 

Shiba Inu (SHIB) often surprises the market with its rapid price movements. Its most historic run came up during the 2020/2021 bull run, when it turned $12 to $1 million.

Though SHIB has dropped from the $0.00008845 all-time high it attained at the time, experts believe it can recover this price level. For this to occur, Shiba Inu would need to attract immense demand, which would lead to a surge in trading volume.

Shiba Inu Price at a $50B Volume

Trading volume alone doesn’t guarantee price growth. If the volume includes a major portion of selling activity, the price impact could be neutral or even negative. Market sentiment would need to be bullish for a $50 billion volume to translate into significant price gains.

For instance, from Nov. 5 to 16, most SHIB trading volume represented buy activity, leading to the recent price growth. IntoTheBlock shows that on Nov. 16 alone, large players purchased 4.72 trillion SHIB, while bears sold 4.52 trillion tokens. This translated to an excess demand of 201 billion SHIB.

Historically, Shiba Inu has shown a strong correlation between trading volume and price surges. During its October 2021 rally, trading volume crossed $30 billion, driving its price to the ATH of $0.000088. CoinMarketCap data confirms SHIB had a volume of $39 billion on Oct. 27 and $32.8 billion on Oct. 28, 2021.

Following this period of heightened market interest, Shiba Inu saw declining trading volumes as prices dropped. Notably, SHIB’s 24-hour volume has ranged from $200 million to $500 million since then.

If trading activity reaches $50 billion, the price could revisit or even exceed these levels. Analysts believe a daily volume of this magnitude could push SHIB to resistance levels around $0.00005 or higher, with optimistic projections targeting $0.00015 in the right market conditions.

Can Shiba Inu Reach a $50B Volume?

Interestingly, the trend of surging volume leading to price surges repeated this year, with Shiba Inu’s trading volume rising to a high of $8.96 billion in early March 2024, as the meme coin surpassed the $0.00003 level. With SHIB claiming a yearly peak of $0.000045 on March 5, volume spiked to $16 billion that day.

However, while the $50 billion volume could result in massive demand for SHIB, attaining this level of interest could be challenging. Shiba Inu’s volume currently sits at $1.18 billion. This figure would need to spike 4,137% to reach the $50 billion mark.

Should this occur, market movements would be pivotal in determining the impact of such high trading volume. Rising liquidity would likely attract institutional and retail investors, creating more buying pressure. At the same time, Shiba Inu’s token burn initiatives could magnify this effect.

Dogecoin Now at Critical Crossroads: Here’s Where DOGE Price Could Go in the Next Few Weeks

0

Dogecoin (DOGE) has reached a critical decision point, with the meme coin’s next move set to define its direction for the next few weeks.

This comes after a significant bearish pull in the crypto market on Tuesday. During the downturn, Dogecoin fell to $0.3673, having traded much higher at $0.4370 on Monday.

As of now, the meme coin has not fully recovered from the dip. Despite a 5% surge in the last 24 hours, DOGE is still trading within the $0.39 range.

Dogecoin Could Plummet to $0.34 or Rally to $0.43

In this latest Dogecoin price news, market analyst Ali Martinez pointed out that Dogecoin is facing a crucial resistance level. He explained that a sustained break above $0.40 would help maintain the bullish momentum and potentially push the price back to $0.43.

However, he also warned that if Dogecoin fails to break through the $0.40 resistance, it could trigger another major dip, possibly to $0.36 or even $0.34.

Considering that Dogecoin reached a multi-year high of $0.4775 just four days ago, revisiting $0.34 would mark a painful 29% loss for recent investors.

Dogecoin price
Image Source: @ali_charts, X (Twitter)

Those Who Survive the DOGE Dip Could Be Rewarded

Meanwhile, Martinez reiterated that Dogecoin tends to experience periodic price dips after speculative price pumps, which is consistent with historical trends. He has even warned of a likely 84% price correction before a major historical run could occur.

In his view, those who cannot withstand a 30% to 50% correction do not deserve to benefit from a 9,000% to 30,000% speculative price pump.

Comments by Ali Martinez on Dogecoin
Comments by Ali Martinez on Dogecoin on X (Twitter)

As a result, he has urged market participants to view every dip as a buying opportunity rather than panic. Meanwhile, other analysts are more optimistic about a bullish continuation for Dogecoin rather than a dip to $0.34.

As reported by The Crypto Basic, multiple analysts agree that Dogecoin is preparing to break toward the $0.5000 region after consolidating in the $0.4000 range for the past two weeks.

New Bullish Factor for Dogecoin

Interestingly, a key factor now supporting higher prices for Dogecoin is the introduction of a pioneering exchange-traded product (ETP) tied to Dogecoin by asset manager Valour. This product allows traditional investors in Sweden to gain exposure to the meme coin.

Senator Cynthia Lummis Says Donald Trump is Building a Bitcoin Army

0

Notable Bitcoin advocate and US Republican Senator Cynthia Lummis believes President-elect Donald Trump is building a Bitcoin army.

Trump has maintained his pro-crypto stance since he emerged as the US President. Interestingly, his unwavering support for developing technological innovation has been evident in his post-election activities.

Notably, these activities have caught the attention of fellow staunch Bitcoin advocate Senator Cynthia Lummis, who has lauded the president’s efforts. In this latest news about bitcoin, in a tweet today citing an appearance at FOX Business, the senator noted that Trump is building an army to fight for Bitcoin.

Lummis Cites Trump’s Pro-Crypto Cabinet

The Republican senator drew her assertions from Trump’s choice of cabinet members. Lummis mentioned that the 47th US president is assembling a pro-crypto cabinet that understands Bitcoin and digital assets to play a crucial role in his administration.

In truth, Trump has filled his cabinet with pro-crypto candidates. The president appointed Elon Musk to head the newly formed Department of Government Efficiency (D.O.G.E.), Robert F. Kennedy as Secretary of Health and Human Services (HHS), and most recently, Howard Lutnick as Commerce Secretary.

Meanwhile, Trump has also assured the crypto community of a new SEC chair who supports digital assets. Notable individuals, like Robinhood CLO Dan Gallagher, who has disclosed he is not interested in the role, and Teresa Goody Guillen are all top candidates to replace Gary Gensler.

US Bitcoin Reserve Makes A Lot of Sense, ex-CFTC Says

Notably, Lummis’s comments came when asked about the United States’ plans to create a Bitcoin Treasury reserve. The stockpile speculation has continued to draw attention, with ex-Commodity Futures Trading Commission (CFTC) boss Chris Giancarlo being the latest to throw in his thoughts.

In an interview with Fox Business, Giancarlo insisted that the US Bitcoin stockpile makes a lot of sense. He argued it is a “forward-looking idea,” as countries have been stockpiling commodities since the beginning of time.

Giancarlo noted that the US stockpiled oil, gold, and other commodities. As a result, stacking Bitcoin, the world’s first digital commodity, was crucial to tapping into the potential of blockchain technology.

Ripple to Invest in Rebranded Bitwise Physical XRP ETP

0

Ripple announces plans to invest in the rebranded physical XRP exchange-traded product (ETP) from leading asset manager Bitwise.

XRP latest news today: The San Francisco-based company made the disclosure after Bitwise renamed its European XRP ETP, formerly dubbed the ETC Group Physical XRP (GXRP). The renaming is part of Bitwise’s commitment to rebranding its suite of products in Europe. 

Following the rebranding, the ETP is now Bitwise Physical XRP, operating under the same GXRP ticker. This rebranding comes three months after Bitwise entered the European market through its acquisition of ETC Group in August. 

ETC Group, which offered several physical crypto ETPs, including GXRP and Bitcoin ETP (BTCE), had $1 billion in AUM. Launched in 2022, GXRP offers European investors regulated exposure to the fifth biggest cryptocurrency by market cap through a 100% physically backed ETP. The product is issued under a prospectus approved by the German authorities.

Commenting on the development, Bitwise co-founder and CEO Hunter Horsley highlighted XRP and XRPL among the most famous crypto projects. The executive expressed excitement about granting investors access to an institutional-grade product like the XRP ETP. 

Ripple to Invest in Bitwise Rebranded XRP ETP 

With Bitwise rebranding the product, Ripple disclosed plans to invest in GXRP. However, the company did not reveal the financial details of the forthcoming investment. 

Notably, Brad Garlinghouse, the CEO at Ripple, recognized the growing demand for investment products around cryptocurrencies. He suggested that this trend will skyrocket, bolstering demands for crypto ETPs like GXRP as the U.S. gets clearer crypto regulations. 

Furthermore, he characterized XRP as a utility-driven token, essentially a cornerstone asset for investors looking to gain access to digital assets with real-world utility. For context, XRP’s utility cuts across sectors like cross-border remittance and institutional decentralized finance (DeFi). 

Bitwise Success in 2024 

Meanwhile, 2024 has been a significant year for Bitwise. Having recorded $10 billion in total client assets, Bitwise expanded its European footprint by acquiring ETC Group. 

The company also increased its crypto ETPs, including launching the Bitwise Aptos Staking ETP on the SIX Swiss Exchange. Following the successful launch of its Bitcoin and Ethereum ETFs, it became the first company to seek the U.S. SEC’s blessing for a spot-based exchange-traded fund tied to XRP. 

Cardano Whales Seize the Opportunity, Acquiring Over 130 Million ADA During Recent Dip

0

Cardano (ADA) surged 21% in a week after whales accumulated 130M ADA during the dip.

Cardano (ADA) has experienced significant price movement, surging by 10.19% within the last 24 hours and 21.15% over the past week. The 9th crypto by market cap, now trading above $1, has demonstrated resilience following a period of consolidation.

Recent data indicates that whale activity played a crucial role in this rally, with large-scale investors actively accumulating ADA during price dips.

Cardano Whales Accelerate Accumulation 

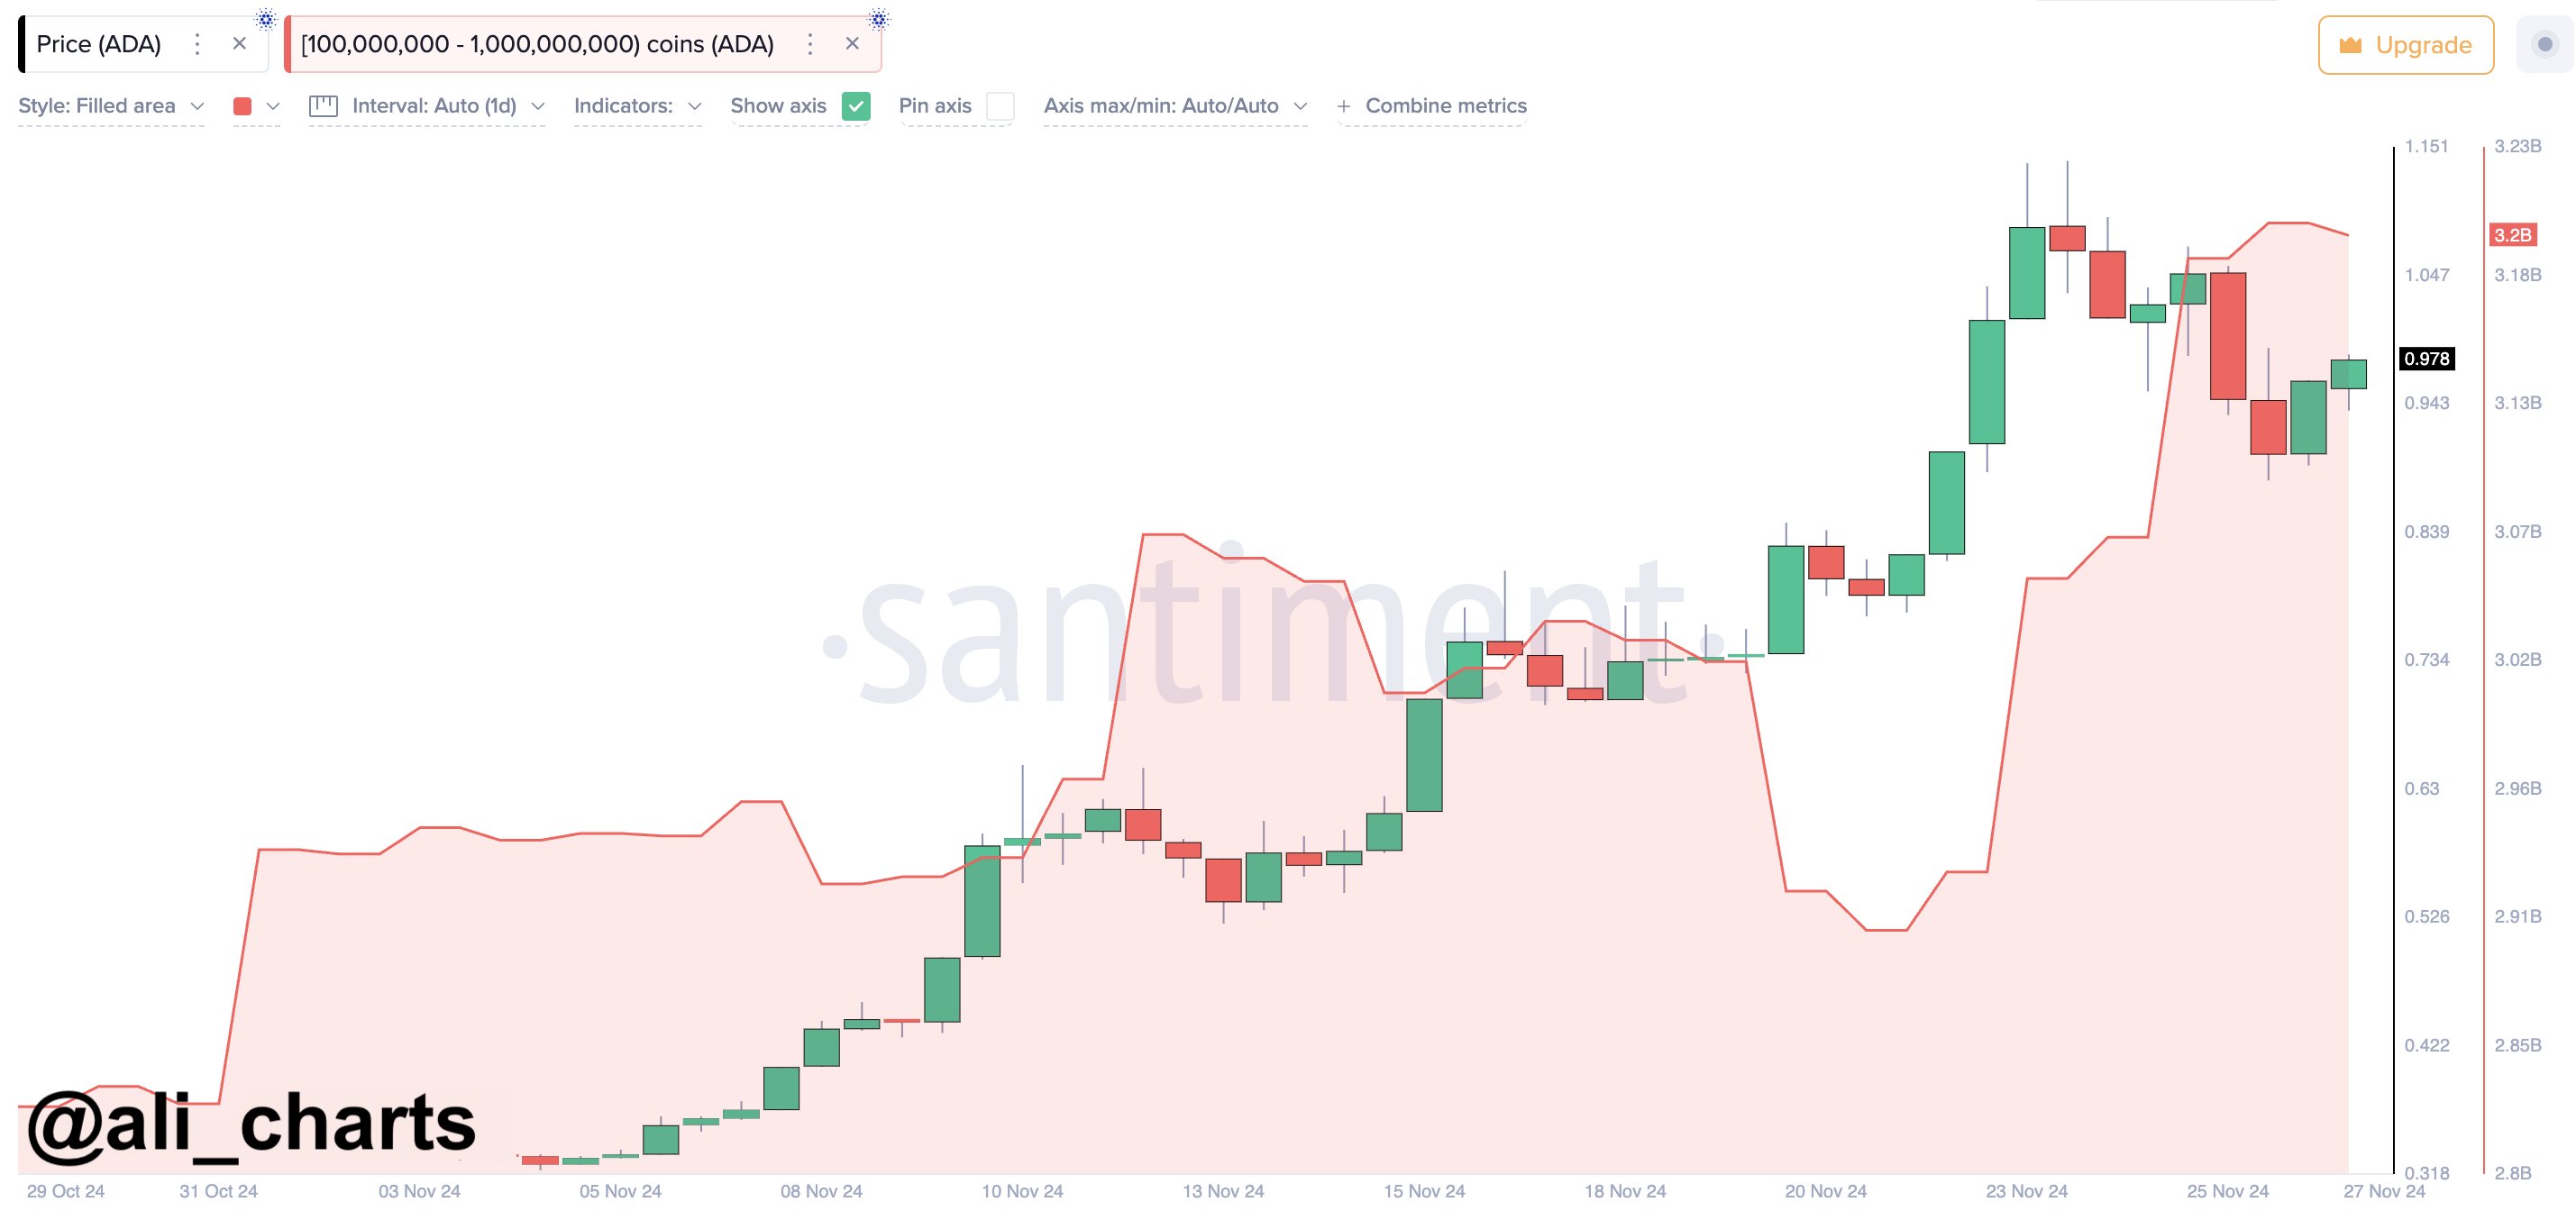
in Cardano news today, Analytical data shared by analyst Ali Martinez highlights an extensive accumulation phase by ADA whales, who acquired over 130 million ADA during a recent price correction. An initial accumulation phase, occurring between early November and November 12, was followed by an observed upward price trajectory, suggesting that large holders anticipated a bullish breakout.

whales Accumulation of Cardano.
Image Source: @ali_charts, X (Twitter)

After ADA reached near $1.1, a temporary decline in whale holdings occurred, likely driven by profit-taking activity. However, from November 20 onwards, as ADA traded below $0.8, renewed accumulation activity was noted. Although this accumulation trend has recently flattened, the initial spike reflects a robust interest in ADA by significant market participants during dips.

On-Chain Indicators Highlight Growing Interest

Further reinforcing this trend, TradingView’s accumulation/distribution (A/D) indicator shows a notable increase in accumulation. The indicator rose when ADA’s price was approximately $0.3, moving from 12.00 billion to 12.13 billion on the A/D scale.

Cardano Image Source Trading View

 While the accumulation line remained relatively stable over previous months, it surged just before the preceding price breakout. This correlation between ADA’s price action and accumulation metrics proves the influence of large holders in driving market trends. 

Sustained Confidence in Cardano (ADA)

Statistics from IntoTheBlock further validate the recent increased interest in ADA by large holders. Over the past week, inflows have grown by 35.54%, reflecting a consistent rise in activity. 

Cardano Large Holders Infows
Cardano Large Holders Infows, IntoTheBlock

Long-term metrics provide additional context, with a 30-day inflow increase of 51,478.87% and a 90-day rise of 23,448.85%. These figures indicate a broader, long-term accumulation trend, suggesting confidence in ADA’s performance over extended periods.

XRP Next Big Move: Expert Reveals XRP Likely Next Target After Correction Ends

0

A market analyst has predicted the next possible direction for XRP after the ongoing correction that has triggered significant declines ends.

XRP has recently witnessed massive price volatility but appears to be holding strong in the face of adversity. Amid Bitcoin’s sharp decline below $93,000, the broader crypto market entered a correction phase, which also impacted XRP. 

Despite the pullback, XRP has shown relative resilience in comparison with other crypto assets. While down 5.54% in the past 24 hours, XRP has retained a 27% gain over the last seven days, holding strong above the $1.36 price territory.

XRP Shows Resilience Amid Profit Taking

As XRP maintains this level, analyst Dark Defender recently discussed its next possible direction once the correction ends. According to him, the pullback in XRP’s price is normal after strong upward trends in crypto markets, as XRP has spiked 200% over the last few weeks.

Besides the broader market pullback, another factor possibly contributing to XRP’s recent correction is profit-taking by investors in South Korea. According to CryptoQuant, approximately 6.6 billion XRP tokens were held on Upbit, the country’s leading exchange. 

During the recent rally, South Korean investors sold around 400 million XRP, worth $400 million. This sell-off likely contributed to short-term price pressure, with XRP giving up the $1.44 pivotal price level.

XRP’s Next Possible Direction

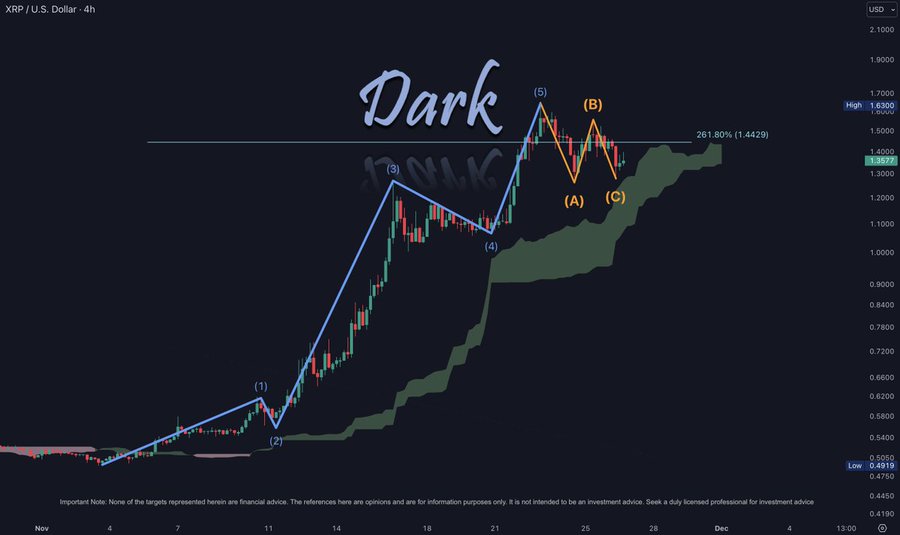
In his recent analysis, Dark Defender called attention to the Elliott Wave theory. He noted that XRP is currently in Wave C of the corrective phase. This wave has a major support level at $1.2893, where the regular Wave 2 would complete. 

However, the analyst suggests that if XRP fails to hold above $1.28, the correction could deepen, potentially pushing the price down to $1.03. It is important to note that XRP has not traded below the $1 mark since it reclaimed it on Nov. 16.

XRP 4H Chart Dark Defender
XRP 4H Chart | Dark Defender

Despite this near-term bearish scenario, Dark Defender is optimistic about XRP’s long-term prospects. He predicts that once the correction ends, XRP could rebound to target $1.88 initially. 

Notably, breaking past this level could open the path to challenge its 2021 peak of $1.96, a major resistance level during the previous bull run. A decisive move above $1.96 could potentially trigger a run to the highs seen during the 2017/2018 crypto market boom.  

Interestingly, market veteran Peter Brandt discussed the importance of this $1.96 region in a recent analysis. According to him, if XRP can surpass this price level, it could set the stage for an explosive push.

The Pivotal $1.44 Price Territory

In a previous analysis, Dark Defender pointed out that XRP had been consolidating around the Fibonacci level of $1.44 for several days. This level is an important threshold for further upward momentum.

For context, XRP breached this level after SEC Chair Gensler confirmed his resignation. Dark Defender highlighted the importance of XRP closing above $1.44 for at least two consecutive days.  Once this condition is met, XRP could target levels between $1.88 and $2.17 as part of its fifth sub-wave rally. 

At press time, XRP has already tumbled below this $1.44 price level, currently changing hands at $1.3628. Notably, at the current price, XRP must first reclaim the $1.44 and hold above it before it can set its eyes on greater price levels.

SUI Channel Breakout Targets Above $4 for New All-Time High

Amid the ongoing pullback, the SUI price trend is signaling a potential channel breakout, with the possibility of crossing $4 and reaching a new all-time high.

As some altcoins in the crypto market are starting to heat up, despite the Bitcoin price facing a downfall to nearly $93,000, SUI is revealing a breakout possibility. 

With a market cap of $9.36 billion, the SUI token currently trades at $3.29. With the increasing chances of a falling channel breakout rally, the bulls anticipate a new all-time high, crossing about $3.93. Let’s find the chances of SUI crossing $4.

SUI Price Analysis

In the 4-hour chart, the SUI price action showcases a falling channel pattern. The pullback phase of the SUI price trend has resulted in a lower high and lower low formation. Thus, two parallel boundary lines give rise to the falling channel pattern. 

SUI Price Chart
SUI Price Chart

The pullback phase accounts for a price drop of 13.72% from $3.9352 to the current market price of $3.3954. 

Now, the SUI price is showing positive momentum within the falling channel, approaching the overhead resistance trendline. Additionally, the price is testing the 50-EMA line, which coincides with the resistance trendline.

The 4-hour RSI is above the halfway mark, increasing the chances of a breakout rally. Moreover, the recent support from the 100-EMA line strengthens the breakout outlook. Together, these technical indicators signal a potential buy opportunity for SUI.

Will SUI Price Hit $4?

The declining trend in the SUI price has been approaching a long-coming support trend line. However, the quick recovery teases a bullish breakout before reaching the support trendline. 

Considering the increased breakout chances, the chances of a new all-time high have also increased. 

Using trend-based Fibonacci levels, the immediate price target is $3.75. However, the $3.89 breakout could mark a change of character in the SUI price trend. 

The breakout run will put the $4.19 and $4.58 on the bullish radar. On the flip side, a bullish failure will result in a drop to the $3.14 support, followed by the $3.00 psychological standpoint. 

Will a Wedge Breakout Boost AAVE Price Beyond $224?

Will the recovery rally in AAVE push the price above $200 to reach a new 52-week high as it breaks out of a falling wedge pattern?

AAVE has emerged as one of the top performers in the crypto space, surging by nearly 17% over the past seven days. With its market cap approaching $3 billion, the Aave network’s total value locked (TVL) is nearing a new all-time high.

With the boost in its TVL, could AAVE’s price surpass $200 and achieve a new 52-week high? Let’s explore.

AAVE’s Wedge Breakout Run 

The AAVE price trend in the 4-hour chart showcases a rising wedge breakout rally. The price jumped 11.79% in the past 12 hours with three consecutive bullish candles. 

AAVE Price Chart
AAVE Price Chart

Currently, the DeFi token is trading at $191.83, sustaining above the broken resistance trendline. As per the November price action, the AAVE price trend showcases a double-bottom reversal from the baseline of $152. 

The recent recovery run has broken above the neckline at $174 for the third time, reflecting the increased volatility. Furthermore, the bullish recovery has surpassed the 50% Fibonacci level at $187.75. 

As the AAVE price trend gains momentum, the broader market expects a new swing high above the $200 psychological mark. If this happens, it will complete a new swing high, marking a change of character.

The 50-day, 100-day, and 200-day exponential moving averages (EMAs) have all aligned positively with the ongoing recovery. Moreover, the 4-hour RSI is approaching the overbought boundary, suggesting that short-term technical indicators are bullish.

AAVE TVL Nears $19.44B, Hints Bull Run Ahead

As AAVE’s price rises, its Total Value Locked (TVL) is approaching a new all-time high. Currently, the AAVE TVL stands at $18.84 billion, closing in on the $19.44 billion record high.

However, compared to the 2021 bull run, AAVE’s price has yet to reach similar peaks. This indicates a visible divergence between AAVE’s market price and its TVL.

An ongoing uptrend in TVL could trigger a surge in bullish momentum for AAVE’s price.

AAVE TVL
AAVE TVL

AAVE Price Targets

Based on trend-based Fibonacci levels, immediate resistance is found at the 61.80% Fibonacci level, around $196.49. If AAVE breaks out above this level, the next target could be $208. Beyond that, the 100% Fibonacci level suggests a price target of $224.78.

On the other hand, if the bullish rally fails to hold above the broken trendline, AAVE could fall to the 38.20% Fibonacci level at $179.