Home Blog Page 1115

Analysis Identifies 5 Ethereum Metrics to Watch as Pundits Expect ETH to Explode Next

0

Analysis from IntoTheBlock shows Ethereum could be the next to witness massive inflow of capital amid contrarian play from the second-largest cryptocurrency.

Ethereum has failed to trade at par with Bitcoin’s continuous northward push. For context, the pioneering crypto asset broke to a new price discovery today, reaching a new all-time high of $98,000.

Meanwhile, Ethereum has struggled to find its bullish footing, rising just 3.87% in the past week compared to Bitcoin’s 7%. However, analysis from IntoTheBlock suggest Ethereum could witness its bullish phase soon.

In a recent analysis, the market intelligence platform stated that Ethereum has historically been the next asset investors rotate their Bitcoin profit to. As a result, the massive capital deployment catalyzing Bitcoin’s bullish outburst would soon flow into the altcoin king.

Ethereum Whales Anticipating Redeployment

IntoTheBlock insisted that on-chain activities indicate that Ethereum proponents are expectant of this impending cash flow. The platform mentioned that reduced Ethereum selling pressure shows that the asset’s whales are aware of what’s coming.

However, the Thursday commentary suggests a mixed sentiment around the Ethereum ecosystem. The analysis infers that key on-chain indicators have not flipped bullish compared to previous cycles.

For instance, IntoTheBlock’s data signals that the creation of a new Ethereum address remains mild in relation to the previous bull cycle. Notably, the analysis mentioned this may likely stem from the surging usage of Ethereum sidechains such as Base.

Meanwhile, the data indicates a positive uptick in metrics like daily transactions, transaction volumes, and whale accumulation. The commentary shows that the average 24-hour transactions on the Ethereum network have grown from 1.1 million to 1.22 million in the past three months.

IntoTheBlock asserts that an Ethereum upsurge might be on the horizon if Bitcoin consolidates at its current high. However, the analytical firm mentioned five metrics that would indicate Ethereum’s next move.

Indicators of Ethereum’s Outbreak

Per the analysis, IntoTheBlock emphasized the importance of Ethereum’s daily transactions as the first metric to watch. With around 8 million transactions processed last week, the analytical firm noted that a spike in daily transactions signals growing interest in the Ethereum network.

Secondly, the analysis indicated the correlation between increased large holders and Ethereum’s price. Holders of at least 0.1% of Ethereum’s circulating supply maintain a positive net flow, signaling confidence in the asset.

Meanwhile, IntoTheBlock noted that the behavior of short-term holders is the third metric that influences Ethereum’s price. An increase in addresses holding Ethereum for less than one month signals retail interest in the altcoin king.

The fourth vital indicator is the holding time of transacted coins. Notably, the time users hold Ethereum before distributing their tokens has increased to 11 months, signaling reduced selling pressure. This strengthens the demand-supply curve.

Conclusively, the analysis showed the importance of Ethereum’s exchange flows. Persistent inflows into exchanges signal increased selling activities, and a converse scenario indicates an accumulation trend.

Meanwhile, Ethereum trades at $3,351 at the time of writing, up 7.32% in the past 24 hours.

CryptoQuant CEO Outlines Reasons Why Bitcoin Bull Market is Just Starting As BTC Breaks $98,300 Peak

0

Bitcoin is nearing the $100,000 milestone, and on-chain indicators suggest the bull run is still in its nascent phase.

Today, Bitcoin climbed to unprecedented heights, surpassing $98,000. This milestone comes after Bitcoin broke its previous peak of $93,000 earlier in the week.

Bitcoin’s new peak at $98,300 brings it within 2% of the highly anticipated $100,000 mark. However, experts suggest that the ongoing BTC price movements, while substantial, may just be the beginning of more major price action, echoing historical patterns.

Indicators Signal Bull Market Transition for Bitcoin

Data from CryptoQuant highlights a shift in Bitcoin’s Bull-Bear Market Cycle Indicator, entering a zone associated with bullish market behavior. This pattern mirrors conditions seen in early 2020, a precursor to the cryptocurrency’s remarkable surge during that year. 

Ki Young Ju, CryptoQuant’s CEO, noted that recent on-chain whale accumulation has become a driving force in this rally. Previously criticized as exaggerated, the data now aligns with rising market activity, suggesting significant investor confidence.

Additionally, mining economics underscore the bullish outlook. With mining costs doubling after the latest Bitcoin halving event, miners require higher prices to sustain profitability. 

The market’s current trajectory suggests these cost pressures may be contributing to the upward movement. Notably, short positions taken by traders are adding fuel to the rally through short squeezes.

Q4 Performance and Halving Cycles

Moreover, the timing of Bitcoin’s rally aligns with historical patterns, particularly its performance in the fourth quarter following halving cycles. In 2020, Bitcoin’s bull market accelerated during Q4, marked by a steep rise in cumulative returns. 

Image

Young Ju has suggested a similar trajectory for 2024, emphasizing that whales are unlikely to allow a flat year-over-year performance during this period.

Recovery, Consolidation, and Expansion Phases

Moreover, Bitcoin’s current rally reflects a structured progression through three key phases: recovery, consolidation, and expansion. In the recovery phase, Bitcoin rebounded from $15,000 to $45,000 between 2023 and 2024, mirroring its 2020 recovery from $3,000 to $9,000. 

The consolidation phase saw Bitcoin reclaim its previous all-time high (ATH), as observed in 2020-2021, when it moved from $9,000 to $19,000, regaining its 2017 ATH of $19,000.

Similarly, in the current cycle, Bitcoin’s rise from $45,000 to $68,000 represents a consolidation phase aimed at surpassing its 2021 ATH of $68,000.

The expansion phase follows, historically marked by a significant surge after reclaiming the ATH. In 2020, Bitcoin soared from $20,000 to $68,000. A similar expansion is predicted for the 2023-2024 cycle, where Bitcoin is expected to establish new cycle highs far beyond $100,000.

Image

Here’s How Much $1,000 in Dogecoin Would be Worth if DOGE Hits $2.55 or $4.35

0

Market participants committing $1,000 to Dogecoin today could see their portfolio multiply nearly 11-fold if the meme coin attains $4.35.

Interest in Dogecoin (DOGE) among crypto market participants reached a new height in the past few weeks. This follows Dogecoin’s spectacular price pumps following the U.S. presidential election. 

Since November 5—the day of the election—when Dogecoin was priced at just $0.1582, the meme coin has seen a 175% increase, reaching $0.4359. According to a recent analysis by Santiment, over 74,800 wallets, mostly retail investors, have joined the Dogecoin ecosystem in the past few weeks, accumulating around 100,000 tokens.

While Dogecoin’s sensational bull run has cooled, with the coin now trading at $0.3607, market participants expect DOGE to make a comeback and eventually hit the long-awaited $1 price point.

Amid this anticipation, The Crypto Basic explores how much a $1,000 investment in Dogecoin today could be worth if the asset reaches higher price levels like $2.55 and $4.35.

Value of $1,000 in Dogecoin If DOGE Hits $2.55

With Dogecoin trading at $0.3607, a $1,000 investment today would buy an investor 2,772 DOGE tokens. If DOGE reaches $2.55, the value of this $1,000 investment will rise to $7,069. This results in a massive 606% gain or a 6x return on investment.

Can Dogecoin Reach $2.55?

Researchers at Changelly, a cryptocurrency exchange, believe Dogecoin could reach this price point. However, the analysts projected an eight-year timeline for DOGE to hit $2.55. 

Notably, this analysis was published before Dogecoin began its explosive price movement earlier this month. Remarkably, the report accurately predicted that Dogecoin would reclaim the $0.30 threshold this month. 

Meanwhile, some independent analysts in the crypto community believe DOGE could reach $2 in the coming weeks.

Value of $1,000 in Dogecoin If DOGE Hits $4.35

Meanwhile, if Dogecoin hits $4.35, the 2,772 DOGE tokens purchased today for $1,000 would be worth $12,058. This would represent a staggering 1,105% gain for investors who buy DOGE at current prices.

When Can Dogecoin Hit $4.35?

According to Changelly analysts, Dogecoin could take up to nine years to reach $4.35. However, crypto community analyst Ali Martinez has predicted that Dogecoin could reach as high as $18, or even $23, as soon as next year. Martinez based this forecast on historical trends in Dogecoin’s price movements.

Sui Network Resumes Transaction Processing After 2-Hour Outage

0

Sui Network, a Layer-1 blockchain popularly referred to as Solana Killer, is back online after experiencing a two-hour outage. 

The technical team behind the L1 blockchain announced the development in the hours leading up to press time, emphasizing that Sui Network is now operational again. Following the quick recovery, validators can now approve transactions on the network. 

First Major Network Issue 

For context, Sui experienced its first major network issue today, halting block production for more than two hours. The outage stemmed from an issue within the transaction scheduling logic, which eventually crashed the network’s validators.

Notably, Sui’s official X handle issued a public service announcement confirming its awareness of the network outage. It disclosed that the technical team had identified the issue and would provide a quick fix. 

Interestingly, it issued another announcement a few minutes later, revealing that the network is back online and processing transactions again. According to the announcement, its community of validators carried out the quick recovery.

Sui and Solana Comparison 

Launched in May 2023, Sui Network is a decentralized L1 blockchain that allows developers to deploy smart contracts while enabling simultaneous processing of multiple transactions. Many crypto enthusiasts labeled it the Solana Killer because it has not experienced any major outage before now. 

However, with its recent outage, some critics referred to Sui as the next Solana, referencing the latter’s history of network disruption. 

For context, Solana has experienced major outages since its launch in March 2020. Its first technical issue occurred in January 2022, when it suffered a degraded performance. The network experienced other technical problems ranging from mainnet outages to degraded performance between June 1 and September 30, 2022.

On February 25, 2023, Solana experienced another network disruption due to cluster instability. According to data from Protos, its most recent outage happened on February 6, 2024.

At the time, the technical team did not provide details about the cause of the outage. However, its mainnet went offline for five hours. Since the last issue, Solana has been a beacon of operational stability, not experiencing any network outage for 289 days.

SUI Price Action 

Meanwhile, the price of SUI plummeted heavily immediately after investors learned about the network’s recent outage. Specifically, SUI, which was hovering around $3.55 before the incident, crashed 5.63% to an intraday low of $3.35. 

Following the network’s quick recovery, SUI’s price rebounded to $3.67, where it trades at press time. Despite this surge, SUI is down 0.26% in the past day. Conversely, the coin has witnessed a weekly increase of 9.42% and a monthly growth of 91.33%. 

Like most crypto assets, SUI also embarked on a major rally after the U.S. election, hitting an all-time high (ATH) of $3.93 on November 17. Amid the recent surge, several analysts project that SUI could soar above $4 soon, positioning it for a possible climb toward $10 in the long term.

Their confidence stems from the coin’s strong on-chain activity and positive technical signals, including MACD and RSI indicators. 

Dogecoin Ready for Major Pump as Whales Amass 550M DOGE, Now Holding 20.6B Tokens

0

Crypto whales have capitalized on the recent Dogecoin discount sales to massively load up their bags for the next wave of explosive price growth.

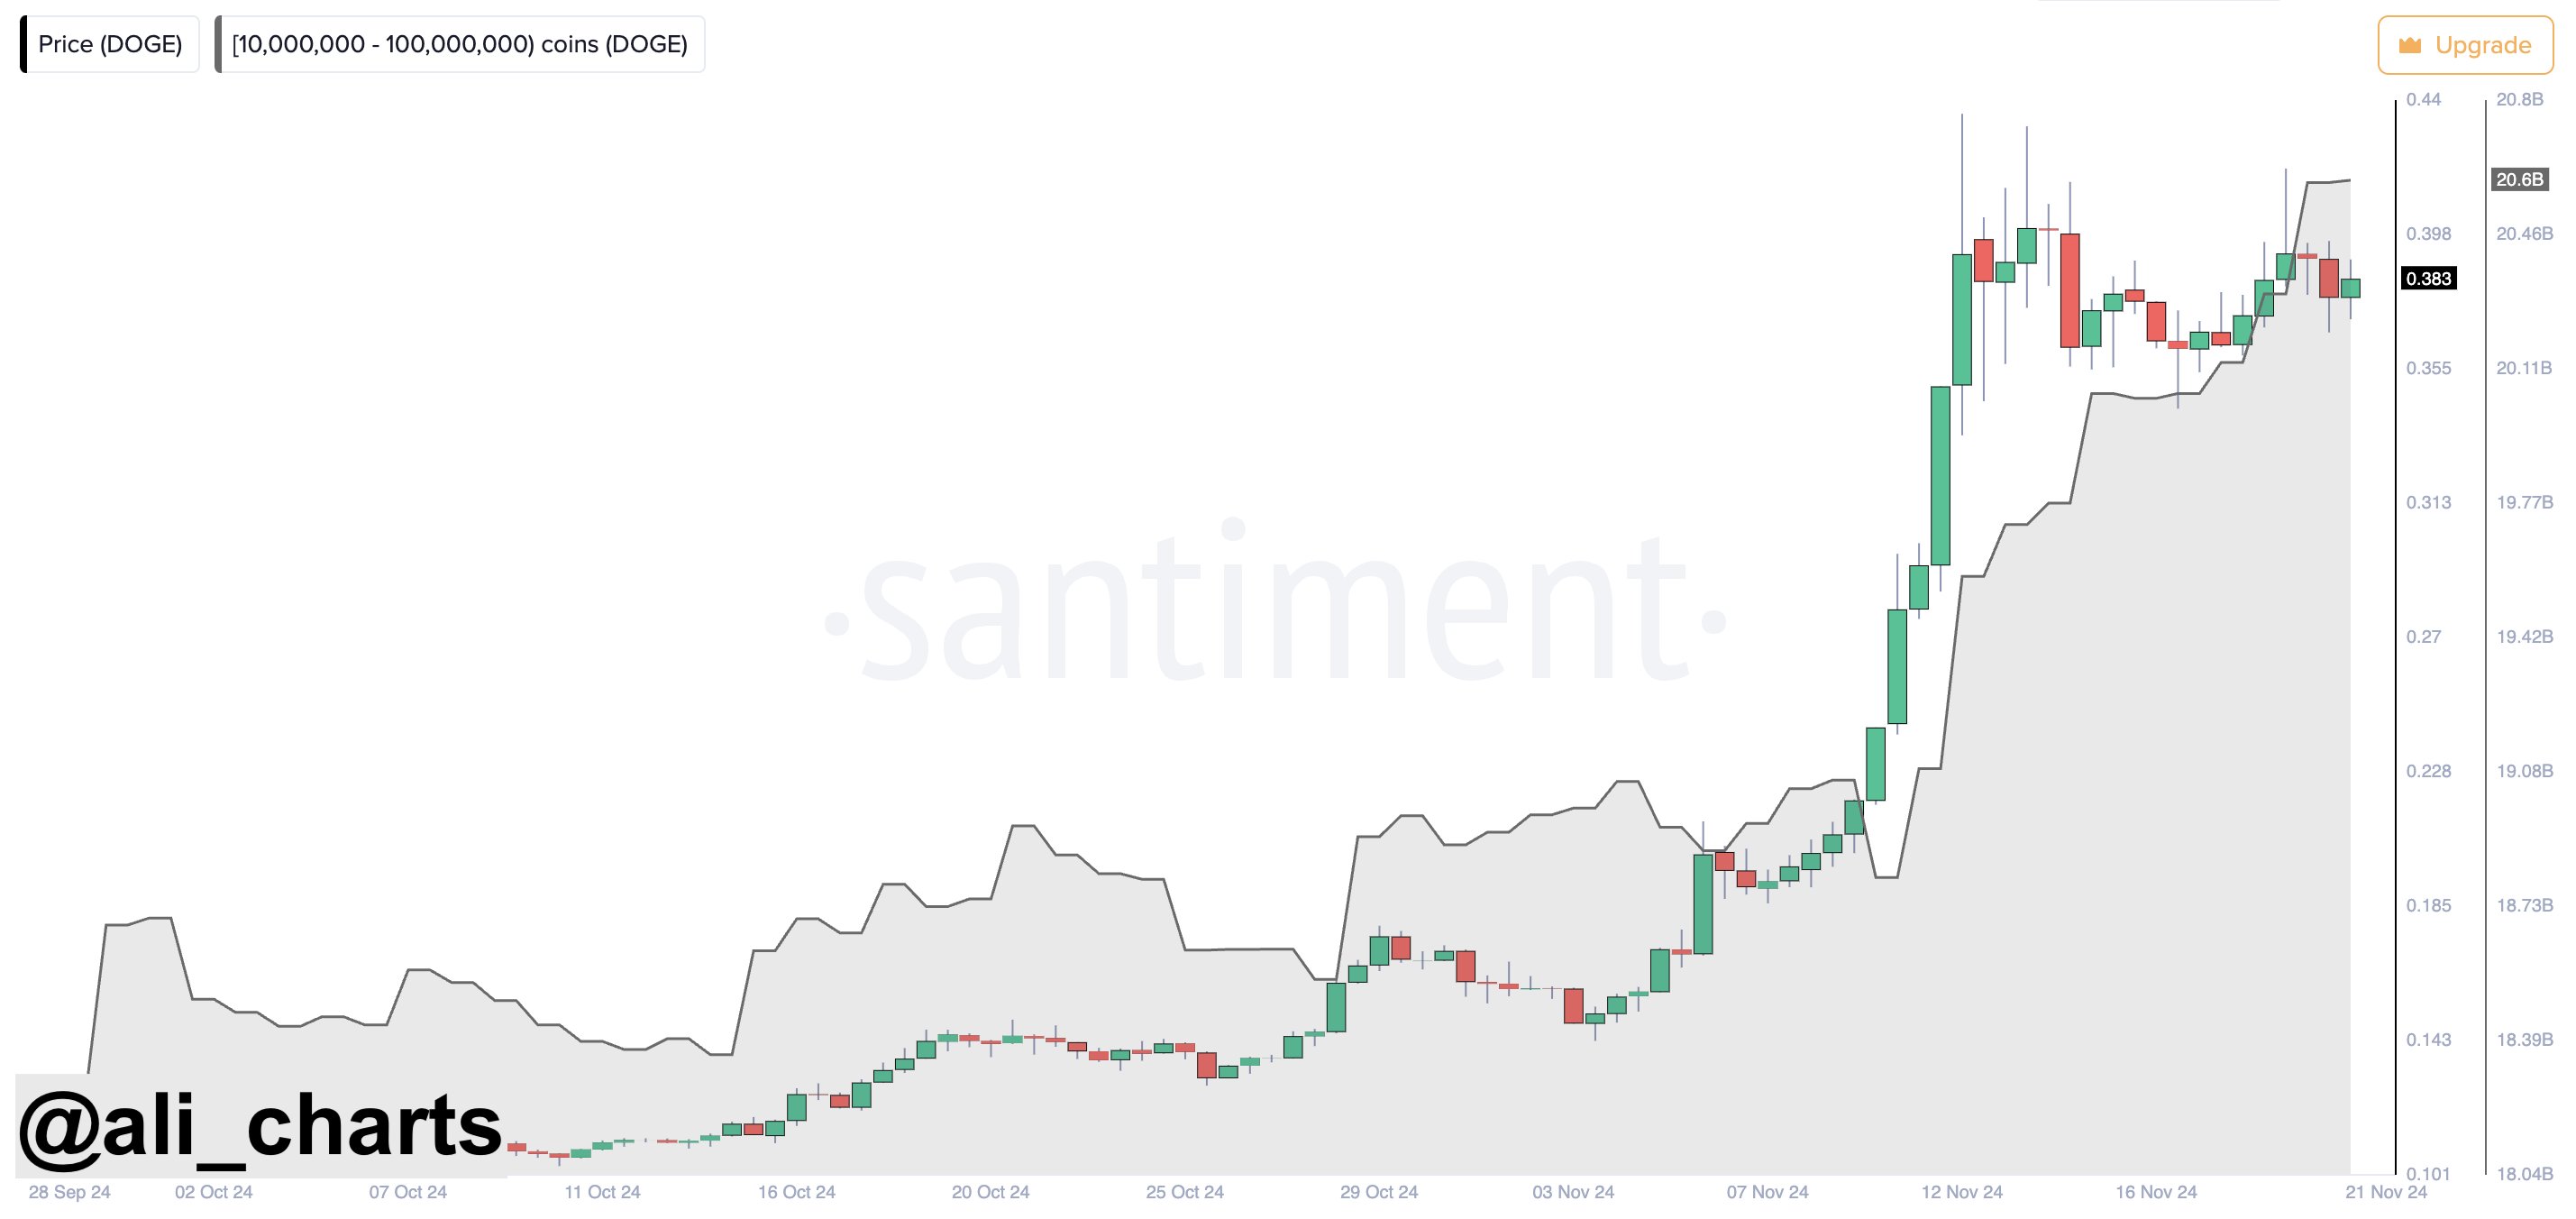
Market observer Ali Martinez drew public attention to the recent whale accumulation spree. Citing data from Santiment, Martinez disclosed that whales have acquired over 550 million DOGE worth $214.5 million over the past week.

Whales Buying More Dogecoin

Notably, these whales typically hold between 10 million and 100 million Dogecoin tokens. They engaged in the latest acquisition while Dogecoin’s price consolidated around the $0.36 to $0.38 range in the last week.

Furthermore, when Dogecoin first encountered its notable dump since hitting $0.4350 on November 12, data from Santiment showed that these same whales even added 140 million tokens to their holdings. At that time, their portfolio rose to 19.9 billion DOGE tokens. Interestingly, following the latest buying spree, their holdings have reached 20.6 billion DOGE tokens.

This tier of high-net-worth investors has continued to accumulate over the past two months. The accumulation shows a passive trend alongside Dogecoin’s price performance in October. However, as Dogecoin’s price spiked significantly in the first week of November, their holdings mirrored the trend. 

Image

Now that Dogecoin is about to break out of its short-term consolidation, the whales are positioning themselves for the upcoming momentum. 

At press time, Dogecoin is trading at $0.3884, down 1.24% in the last 24 hours. Notably, Dogecoin and other meme coins are struggling in the red even as Bitcoin makes a notable push to break $100K.

Dogecoin Price to Watch for When the Bulls Reemerge

In an earlier analysis, Martinez predicted a 120% rally for Dogecoin after it formed a bullish pattern following a brief cool-off phase from its speculative run. Martinez suggested the meme coin could surge to $0.82, assuming the $0.37 support holds.

He added that after Dogecoin breaks out of its consolidation phase, it will face resistance at $0.4400, with further hurdles at $0.5500 and $0.6500. This would open the door to potential growth toward $1.

Additionally, Martinez has emphasized Dogecoin’s potential for more significant growth, citing data from Google Trends to suggest that the meme coin is not yet at its peak popularity despite reclaiming a multi-year high two weeks ago.

Bittensor Faces 25% Drop: Is a Retest of $400 the Next Move?

Will a falling wedge pattern extend the correction phase in Bittensor (TAO) to the $400 mark this November?

With a market cap of $3.43 billion, Bittensor is the 33rd biggest crypto. TAO’s price trend is currently struggling to find bullish support as it breaks under the $500 psychological mark. 

With a 15% price drop in the last 30 days, the AI token is witnessing an intense pullback. Will this downfall result in a retest of the $400 psychological mark? Let’s find out. 

Bittensor Falls Under $474

In the daily chart, Bittensor’s price trend shows a declining phase. The TAO token is struggling in a falling wedge pattern and has dropped nearly 25% in the past 9 days. 

BitTensor Price Chart
Bittensor Price Chart

The downfall started at $624 on November 12 and has now reached $463. The falling wedge pattern has also breached the 23.6% Fibonacci retracement level at $474.

Despite the broader market recovery, the increasing bearish influence reveals the lack of underlying demand for the AI token. This has resulted in a “death cross” between the 50-day and 200-day EMA lines. 

The merging of the 100-day and 200-day EMAs suggests that the bearish trend could continue if the price remains under pressure. However, the TAO price is approaching the support trendline, which could trigger a positive cycle within the wedge pattern, increasing the chances for a bullish reversal and a breakout rally.

Will Bittensor Sustain Above $400?

In a bullish scenario, key resistance levels for Bittensor are at the 50% Fibonacci retracement level ($543) and the 78.6% Fibonacci level ($617). If the trendline support fails to hold, the next significant level to watch is the $413 support zone.

Should the price drop further, the $400 psychological level may provide strong support, potentially initiating a double-bottom reversal, which would favor bullish sentiment.

The 4-hour Relative Strength Index (RSI) is showing bullish divergence, supporting the case for a potential rebound. If this fails, the $400 mark remains a critical support level to monitor for signs of a trend reversal.

Here is What 10M, 50M, 100M Shiba Inu Will be worth if SHIB Market Cap Hits Only $30B

0

Shiba Inu investors holding between 10 million and 100 million tokens could see their holdings reach much higher values if SHIB only claimed a $30 billion market cap.

The crypto market is currently witnessing the second phase of the ongoing bull run, and Shiba Inu has leveraged the bullish phase to record substantial gains. As the uptrend prevailed, SHIB eventually crossed the much-coveted $0.00002 territory on Nov. 9.

Smaller Wallets Accumulating SHIB Amid Rebound

With Shiba Inu up 49.01% over the past week, smaller investors are returning to the market amid a period of FOMO. Data from IntoTheBlock suggests that this group of investors, especially those holding less than 100 million SHIB, has been accumulating more tokens.

Per the data, wallets holding between 10 million and 100 million Shiba Inu tokens currently amount to 302,660, representing 22.07% of total addresses. Notably, these addresses now hold a whopping 9.46 trillion SHIB tokens, about 0.95% of the total Shiba Inu supply.

Shiba Inu Holdings Distribution IntoTheBlock
Shiba Inu Holdings Distribution | IntoTheBlock

Should these investors hold onto their tokens, their holdings could skyrocket if Shiba Inu reaches certain price milestones. For instance, most recently, market analyst Alex Clay suggested that SHIB could be looking to claim $0.00005685 as its next target.

Interestingly, this price level would bring Shiba Inu’s market valuation to value it has not attained in over three years. For context, a $0.00005 price would bring SHIB’s market cap to about $30 billion. The last time the meme coin’s market cap saw this level was in mid-November 2021.

The fact that Shiba Inu had attained this valuation in the past confirms the feasibility of the price target. Specifically, a $30 billion valuation translates to a price of $0.00005091 per SHIB. At this value, investors with 10 million to 100 million tokens could witness a rise in their investments.

Worth of 10M, 50M, 100M Shiba Inu at $30B Market Cap

Those holding 10 million tokens are currently sitting at $263 worth of tokens, as SHIB trades for $0.00002630. This value confirms that prospective investors could amass these tokens at a lower price. Notably, if Shiba Inu spikes to the $0.00005091 level, this holding would increase to $509.1, a 93% ROI.

Further, investors with 50 million SHIB tokens currently hold $1,315 worth of the crypto asset. A price rally to $0.00005091 would bring the value of these tokens to $2,545. This would mark an addition of $1,230 if SHIB’s market cap hit $30 billion.

Meanwhile, holders of 100 million Shiba Inu, currently worth $2,630, would witness more substantial gains should the $30 billion market cap materialize. At this position, these holdings would rise to $5,091, translating to a yield of about $2,461.

Top Trader Says Shiba Inu Set to Break Seven-Month High at $0.000036

0

Well-known crypto analyst Carl “The Moon” has suggested Shiba Inu could be headed for a seven-month high amid recent chart patterns.

In a recent post on X, he asked his followers whether they had been trading Shiba Inu recently. He argued that if the cryptocurrency breaks out to the upside, it could surge to $0.00003630. Carl expressed the sentiment amid an emerging trend in Shiba Inu charts.

Shiba Inu Recent Price Action

Notably, Shiba Inu has been in a bearish trend in recent days. The token even lagged behind the broader crypto market during the recent bull frenzy of the past two weeks. At the time, rival meme coins like PEPE and BONK set all-time highs with gains of over 200%, while others, like Dogecoin, surpassed their 2021 peak.

While Shiba Inu moved from $0.00001626 to $0.00003031 during the same time, it quickly lost momentum. Now, SHIB is struggling at around $0.000024, down 7% in its weekly performance.

SHIB Setting to Explode

Meanwhile, market watchers like Carl are confident that Shiba Inu is poised for a reversal. In his tweet, he shared a chart showing that Shiba Inu was primed to break out of its short-term downtrend, which followed its peak at $0.00003031 on November 12. 

His chart outlined the possibility of Shiba Inu experiencing a mild 42% price pump, which could push it to $0.000036 in the short term, potentially before the week ends. Notably, Shiba Inu last traded at $0.000036 range seven months ago in April.

Image

Other market analysts share similar views regarding Shiba Inu’s price action. For instance, according to analyst Roaring Kitty, Shiba Inu is warming up for a 2X surge despite its underperformance.

Ambitious SHIB Targets

Meanwhile, Carl has even bolder, more ambitious targets for Shiba Inu. Last week, he disclosed that he would not sell his SHIB holdings until the token reaches $0.50. This would present a massive 1,967,629% rise from Shiba Inu’s floor price. Previously, he mentioned a price target of $1.

It’s important to note that these projections are highly futuristic and speculative. Interestingly, as reported by The Crypto Basic in an earlier analysis, if Shiba Inu were to replicate its 2021 success, the price could eliminate all zeros and trade as high as $0.19. 

However, the chances of this happening in the near term are slim, as Shiba Inu is now a project with a multi-billion-dollar market cap. The token achieved an astronomical 884,400% increase last season as its market cap was a few hundred dollars at the start.

Top Analyst Says Polygon (POL) Ready to Stage Massive 8,216% Rally to $36

0

While Polygon (POL) has shown a lackluster price trend, technical indicators are hinting at a potential major comeback for the token, according to a leading analyst.

Despite a notable price increase in the broader market, Polygon’s (POL) price action has lagged behind its major-cap altcoin peers. The cryptocurrency experienced a 2.73% rise over the last 24 hours and a 17.41% weekly gain, showcasing modest upward momentum.

In contrast, other altcoins like Dogecoin (DOGE) and XRP have delivered stronger returns of over 120% during the current rally. This discrepancy has raised questions about Polygon’s ability to compete.

Notably, blockchain analyst Ali Martinez highlighted potential bullish signals for Polygon, suggesting a “hated rally” could be on the horizon. This assertion comes as technical indicators reveal a possible continued rally.

Technical Indicators Signal Momentum

Martinez’s technical analysis of Polygon’s price action identified key bullish indicators. The asset’s price recently rebounded from the x-axis of a descending triangle, a critical technical level. This pattern suggests a potential rally toward a key resistance level defined by the triangle’s descending trendline. Overcoming this resistance could pave the way for additional upward movement.

Complementing this pattern, the Stochastic oscillator showed a bullish crossover. Martinez observed that the %K line (blue) had crossed above the %D line (orange), indicating increasing buying pressure. This indicator often signals the early stages of a trend reversal. 

Similarly, Polygon’s moving average convergence divergence (MACD) is nearing a bullish crossover, with the MACD line approaching the signal line. A confirmed crossover would signify waning bearish momentum, as evidenced by the histogram bars turning less negative.

Polygon (POL) To Rally by 8,216% to $36

Amid this observation, Ali Martinez’s chart analysis indicated the potential for POL to surge to a target of $36. If POL were to reach $36 from its current price of $0.4329, it would represent an approximate gain of 8,216%.

On-Chain Activity Reflects Rising Interest

In addition to technical signals, Polygon’s on-chain metrics point to growing market participation. Two days ago, Martinez noted a significant increase in daily active addresses, transaction volume, and whale activity. 

These developments indicate heightened interest in Polygon, often a precursor to bullish price action.

Potential Price Targets for Polygon Upon Breakout

Earlier, Martinez proposed ambitious price targets for Polygon, identifying a longstanding resistance trendline on the weekly chart that has hindered Polygon’s growth since its December 2021 peak.

The analyst noted that breaking past this trendline could mark a turning point for the asset. Martinez outlined a near-term target of $0.89, which would represent a 167% gain from the current levels. Additionally, he projected a secondary target of $8, reflecting a potential 2,387% increase.

Analysis Shows Bitcoin Likely to Target $137,000 Next Amid $97K Peak

0

Amid Bitcoin breaking a new $97K peak, technical analysis points to a potential target of $137,000, fueled by historical breakouts and whale activity.

On Wednesday evening, Bitcoin experienced a remarkable rally, surpassing $95,000 for the first time. By press time, the leading cryptocurrency had gained over 4.4%, reaching a high of $97,903. Technical indicators and whale activity have been pivotal in driving this bullish momentum, signaling the potential for further gains.

Key Historical Breakouts and Target for Bitcoin

Chart analysis by Aksel Kibar highlights historical breakout points and subsequent Bitcoin peaks for previous cycles, reinforcing Bitcoin’s cyclical pattern of bull markets.

Specifically, Kibar’s chart highlights key moments in Bitcoin’s history, such as the 2013 breakout above $10, which was followed by a surge to $100. Similarly, the 2017 breakout near $1,000 led to a rally that peaked at $20,000.

The 2020 breakout above $11,000 sparked a bull run that reached a high of $69,000 in 2021. More recently, the chart shows that Bitcoin established a minor high of $73,700 in March 2021. Based on the latest monthly candle, Kibar’s analysis suggests Bitcoin could now be targeting $137,000.

Image

Bitcoin Next Targets Based on Fibonacci Levels

Bitcoin’s recent price action has surpassed the 50% Fibonacci retracement level at $83,592. The next target is $100,103, which aligns with the 78.6% Fibonacci level. Following that, the $112,597 mark comes into focus at the 100% Fibonacci level.

Bitcoin Price Chart

This projection is supported by a bullish crossover on the MACD indicator and strengthening histograms. Additionally, upward movements in the 50-week and 200-week exponential moving averages point to strong market sentiment.

Whale Activity Support Bullish Momentum

Moreover, on-chain data reveals strong accumulation trends among Bitcoin whales, further supporting the ongoing rally. A major whale wallet recently withdrew $68.9 million worth of Bitcoin from the Binance to an external wallet. The wallet currently holds 24,660 BTC, valued at $2.3 billion.

Additionally, six new wallets collectively withdrew 500.2 Wrapped Bitcoin (WBTC), worth $46.3 million, from the Binance exchange. These trends further signal growing interest from institutional and private investors.