Home Blog Page 1131

Fifth Wave Could Propel XRP by 3,536% to $20, Says Chartered Market Technician

0

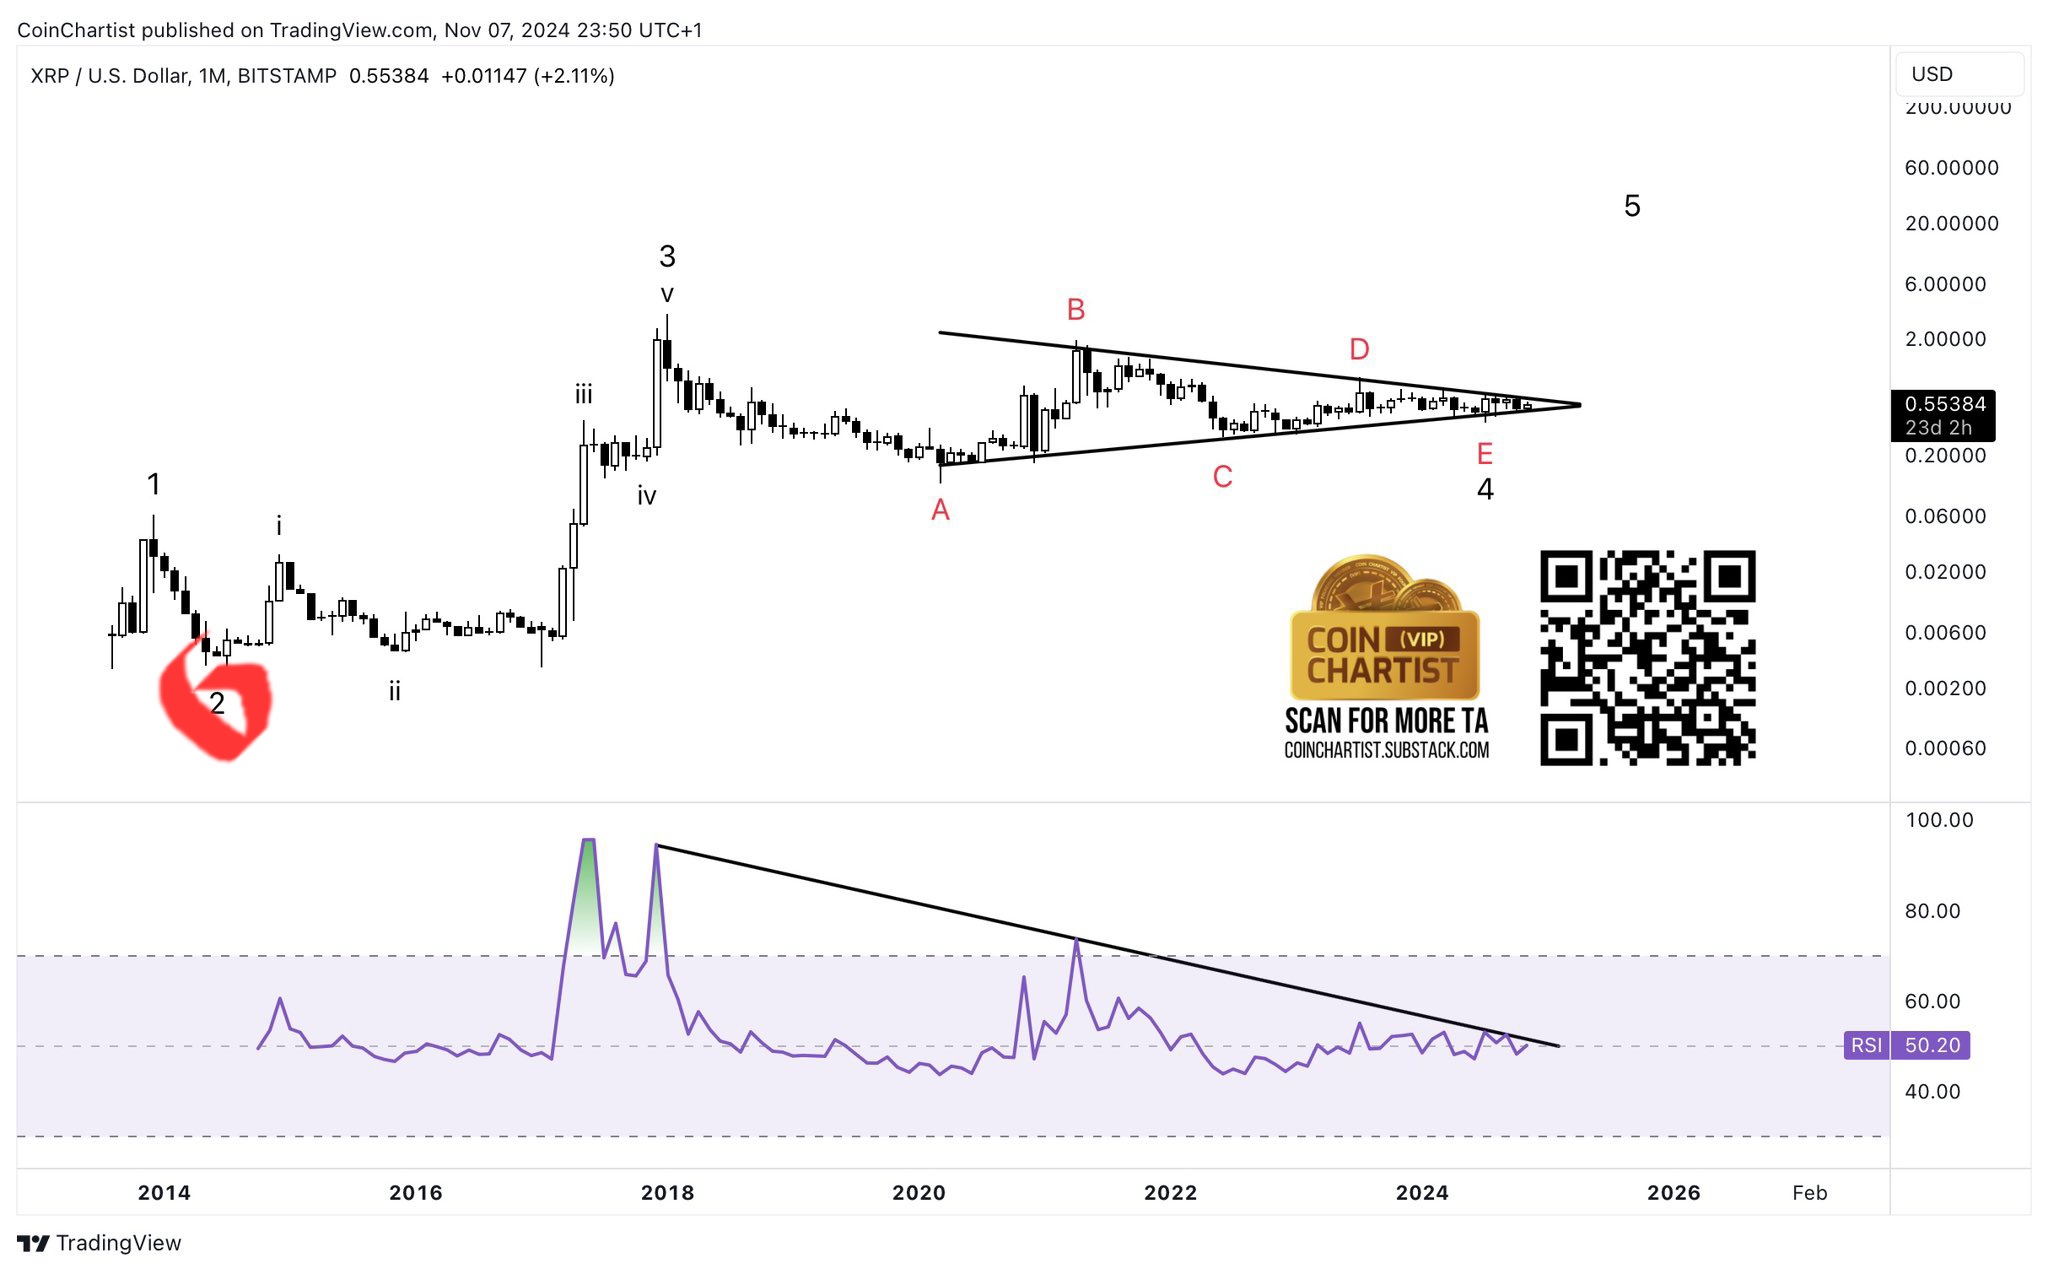
Tony Severino, a Chartered Market Technician, has highlighted a setup in the XRP chart that suggests the crypto asset is on the verge of a powerful rally that could push its price toward the $20 mark.

According to Severino, XRP’s price is forming a classic Elliott Wave structure, with the digital asset poised to enter its Fifth Wave. Notably, the fifth wave is often characterized by sharp upward movements in Elliott Wave theory.

Analysis of XRP’s Elliott Wave Structure

In the chart shared by Severino, the first and third waves led to significant gains for XRP during the 2014 and 2017 market cycles, respectively. The 2017 wave was particularly powerful, with XRP surging by over 70,000% during that period. 

Meanwhile, a bearish phase followed these two waves, specifically Wave 2 in 2016 and Wave 4 in the current ongoing phase of 2024.

Interestingly, Severino’s chart shows that XRP is on the verge of breaking out of its fourth wave, signaling the start of an explosive fifth wave with a projected price target of $20.
Image

Currently, XRP is trading at around $0.55, so reaching $20 as projected would result in a massive gain of 3,536% for current XRP holders.

Other Technical Indicators Supporting an Impending XRP Surge

In addition to the Elliott Wave structure, Severino’s analysis also incorporates other bullish technical indicators. Specifically, the chart shows XRP consolidating within a symmetrical triangle, which often signals an impending breakout.

The triangle, marked with an A-B-C-D-E pattern, reflects a tightening price range that typically precedes a significant price movement once the pattern resolves.

Adding to the bullish case, XRP’s Relative Strength Index (RSI) is approaching a key downtrend resistance, according to Severino.

He suggested that if XRP breaks above this long-standing RSI resistance, it would signal a surge in buying momentum, further supporting the potential for a rally. 

Sentiment Around XRP in the Crypto Market

While XRP has traded sideways in recent months, the convergence of these technical signals suggests that a major move could be on the horizon.

Pro-XRP market analysts have stressed that virtually every metric is pointing to an impending explosive surge for XRP.

However, XRP has continued to show disappointing price performance, even as Bitcoin has broken multiple all-time highs this week. This has led some to continue doubting the bullish narrative surrounding XRP.

In response to Severino’s post, an X user named Wide Field remarked that, for years, the market has been engaging in wishful thinking about XRP, but the price has failed to reflect any substantial change.

Bitcoin Eyes $104K as MVRV Signals Room for Growth

As Bitcoin forms an evening star pattern, is a pullback to $84,000 imminent, or will the bull run continue toward $100,000?

As bullish exhaustion leads to a minor pullback in Bitcoin, the streak of new all-time highs takes a pause. Currently, the BTC price is trading below the $88,000 mark with a market cap of $1.75 trillion. 

Over the past 30 days, Bitcoin has increased by more than 40%. Will the latest minor pullback delay the Bitcoin price target of $100,000? Let’s find out.

Bitcoin Price Analysis

Bitcoin is currently trading at $87,496, with an intraday pullback of 0.61% from the opening price of $88,038. Yesterday, the price formed a doji candle, with a downfall of 0.83%.

This warned of an evening star pattern, as it had formed a massive bullish engulfing candle with a 10.38% surge on Monday. 

Further, Bitcoin’s bearish reversal occurred from the 1.618 Fibonacci level, which was priced at $88,574. In the recent cycle, the BTC price formed its all-time high at $90,243 on the Bitstamp exchange.

BITSTAMP:BTCUSD Chart Image by Trojan69420

As the evening star pattern warns of a pullback, the lower price rejection in the intraday candle teases a bullish extension. Furthermore, the growing bullish influence teases a positive crossover between the 100-day and 200-day simple moving average lines. 

This means the average lines are ready for a positive alignment following the golden crossover. Hence, the dynamic lines trigger a buy signal for Bitcoin. Meanwhile, the MACD and signal lines continue to prosper, with a surge of positive histograms signaling healthy bullish momentum. 

MVRV Shows Room for Growth Amid Growing Network

Amid the increasing demand for crypto, the active Bitcoin addresses have surpassed the 1 million mark. Furthermore, the number of transactions and transaction fees over the Bitcoin network has significantly increased, per Intotheblock. 

Bitcoin Network Growth

Over the past week, large transactions have surged to 33.33K, with a total transaction volume of 1.36 million BTC. This marks a seven-day high in both transaction count and volume. With the network growing stronger, the market value to realized value (MVRV) ratio indicates that there is still room for further growth.

Historically, the MVRV ratio has been useful in identifying market tops. In 2013, it peaked at 4.91; in 2017, it hit 4.24; and in 2021, it reached 3.68. These peaks in the MVRV ratio often signal market tops.

Bitcoin MVRV

Bitcoin MVRVCurrently, the MVRV ratio stands at 2.47 as the BTC price continues to create new all-time high levels. Based on the tweet from IntoTheBlock, historical values between 2.6 and 5 have aligned with market tops. 

Furthermore, with the previous peak at 3.68 MVRV, the lower peak is expected to form near 3. Hence, the present MVRV ratio at 2.47 shows significant room for growth in Bitcoin. 

Bitcoin Price Targets

Based on the Fibonacci retracement tool, Bitcoin’s upside targets are $97,781 and $104,337 at the 2 and 2.272 Fibonacci levels. However, for Bitcoin to reach these levels, it will need to break through the 1.618 Fibonacci resistance level at $88,574.

Conversely, the crucial support levels for Bitcoin are at $84,000 and $80,000.

Why Ethereum Is Falling Short of Bitcoin and Solana’s Explosive Growth in This Bull Season

0

Ethereum’s shift toward a modular architecture influences short-term price action, shifting gains to Layer 2 tokens. However, this strategy positions Ethereum for long-term dominance.

Ethereum has encountered a significant resistance level at $3,386, prompting a temporary correction. This pivotal region, marked by substantial supply, has led to a 6.59% price decline in the past 24 hours, bringing ETH to $3,161. Despite this short-term setback, Ethereum has seen a 21.22% increase over the past week. 

Meanwhile, Ethereum’s performance in recent years has lagged behind competitors like Bitcoin and Solana. According to a Hack VC report, Ethereum’s 121% year-to-date growth pales in comparison to Bitcoin’s 290% and Solana’s 1,452%.

The report attributes this underperformance to Ethereum’s decision to embrace modular architecture, which may have dampened its short-term price momentum.

Modular Approach Sparks Debate 

Hack VC highlights that Ethereum’s move toward a modular architecture, incorporating Layer 2 solutions and shared security protocols, has introduced trade-offs. Among these are lower fees and reduced token burns, which have affected ETH’s price dynamics.

As a result, market gains have shifted toward tokens within Ethereum’s modular ecosystem, particularly those associated with Layer 2 networks, leaving ETH holders at a disadvantage in the short term.

However, despite these challenges, Ethereum’s modular ecosystem retains a strong market presence, with a combined market capitalization that rivals Solana’s.

Long-Term Prospects of Ethereum’s Modular Strategy

Despite the short-term price challenges, the long-term benefits of Ethereum’s modular strategy are evident. Hack VC data indicates Ethereum has maintained a 75% market share over nine years, bolstered by Layer 2 solutions.

This modular strategy positions Ethereum for future technological advancements, helping to secure its dominance in the blockchain space for years to come.

Deflationary Dynamics 

Meanwhile, Ethereum’s supply dynamics have shifted positively, according to Onchain Foundation’s latest analysis. The network has re-entered deflationary territory, with more ETH being burned than issued.

As market momentum grows, this trend is expected to accelerate, creating a self-sustaining cycle of higher demand and reduced supply.

The report emphasizes that rising gas fees are contributing to the increased burn rate of ETH, further tightening supply. This deflationary mechanism, combined with Ethereum’s modular approach, supports a positive long-term outlook for the network despite the short-term market fluctuations.

Will BONK Break $0.00003483 Resistance for a New All-Time High?

As BONK challenges a crucial resistance with the ongoing recovery, will the bulls create a new all-time high this November?

The BONK meme coin is currently trading at $0.00003394. Due to the broader market pullback, the BONK price has fallen by 8.82% from its opening price of $0.00003724. 

Prior to the intraday pullback, the bullish revival in BONK price led to a 132% surge. The recovery rally started from $0.00001717 and peaked at $0.000040. Will this uptrend result in a new all-time high in BONK?

BONK Price Rally Provides Retest Entry Opportunities

The bullish recovery in BONK surpassed the 78.60% Fibonacci level, rising to $0.00003426. However, with the broader market pullback, the meme coin retests the Fibonacci level after facing opposition from a crucial resistance zone. The overhead supply zone extends from $0.00003766 to $0.00004109. 

BONK price chart
BONK price chart

Following a massive bullish engulfing candle with a 40% jump on Tuesday, the current bearish pullback is forming a piercing candle, suggesting a retest of the broken Fibonacci level. The lower price rejection seen in the daily candle increases the likelihood of a reversal.

Furthermore, the bearish pressure is hinting at an imminent golden crossover between the 50-day and 200-day simple moving averages (SMAs). Additionally, the 100-day SMA is showing an upward trend. Based on these moving averages, BONK appears to be in the midst of a strong recovery rally.

The MACD and signal lines are also showing a growing bullish gap, with positive histograms continuing to surge.

BONK Price Targets

In the weekly chart, BONK’s price action shows a bullish breakout of a triangle pattern. It formed a bullish pennant pattern with the prevailing uptrend.

BONK price chart
BONK price chart

However, the recovery run struggles to surpass the 23.60% Fibonacci level at $0.00003483 convincingly. Further, the weekly MACD indicator shows a positive crossover, supporting the bullish upside.

The 23.60% Fibonacci level, which was retraced during the late 2023 bull run, has acted as a key resistance point, holding back bullish growth four times.

This is the fifth attempt to break through. If the breakout succeeds, the next price targets are $0.00007542 and $0.00001408. A successful breakout would significantly increase the chances of BONK reaching a new all-time high.

Market Expert Predicts $100M Bitcoin as US Dollar Will Eventually Reprice to Satoshi

0

Samson Mow, Asian Bitcoin advocate and JAN3 CEO, has placed an ambitious Bitcoin prediction, tipping the premier asset to attain seven figures soon.

Mow asserts that Bitcoin will go parabolic soon, speculating a surge to a multi-million valuation per coin. The JAN3 CEO, famously known as the Asian Michael Saylor, based his lofty Bitcoin call on the macroeconomic landscape and growing US debt.

In an interview, Mow noted that US debts have increased to insane levels, placing the economy at risk of implosion. Data shows that the total outstanding public debt of the United States stands at $35.95 trillion.

The market expert noted that these debts are not sustainable. As a result, he believes there would either be a “debt jubilee” or the US would have to reprice its dollar valuation to a harder asset. Mow asserted that he sees the US dollar rebasing to one Satoshi.

Bitcoin to Surge to $100M on Rebasement Basis

The JAN3 CEO insisted that the United States would have to take a drastic approach to its growing debt. He stated this would happen as it could not pay the debt because it has outgrown its gross domestic product (GDP).

As a result, Mow sees the US government rebasing $1 to worth 1 Satoshi (SAT). Currently, 1 SAT trades at $0.000876. Repricing the dollar to the value of 1 SAT would spur Bitcoin to a value of $100 million.

Notably, Mow argued that the rebasement would eventually happen, noting it was a matter of when the US would make the move. He added that “it is inevitable that we do rebase to Bitcoin,” noting that $1 to 1 Satoshi was a “fair rebase plan.”

Mow’s Near-Term Assertion

Meanwhile, the JAN3 CEO stated that Bitcoin is on a path to $1 million per coin. He insisted that Bitcoin is severely undervalued at the current price and expects a massive parabolic expansion.

However, Mow noted that the premier asset would trade at $100,000 before the end of the year. He stated that Bitcoin would have attained the price mark but is still lagging from the FTX implosion and Grayscale sales hangover.

Notably, the famous Bitcoin advocate cited reasons for his six-figure assertion, which include the growing demand from the spot exchange-traded funds. The JAN3 CEO insisted that traction from the US Bitcoin investment vehicle would propel a surge past $100,000 before the next month ends.

Two Reasons Why Bitcoin Might See Sustained Rally: Expert

0

Attorney Jeremy Hogan discusses the recent developments surrounding Bitcoin, highlighting two major factors that could pave the way for a sustained rally. 

The price of Bitcoin has surged tremendously following the conclusion of the United States election, which saw the emergence of a pro-crypto president and over 200 lawmakers. With investors enthusiastic about cryptos’ prospects under the forthcoming administration, Bitcoin rallied to $89,956 a week after the election. 

2 Factors That Could Drive Government and Institutional Bitcoin Adoption 

Reacting, Attorney Jeremy Hogan, a partner at Hogan & Hogan law firm and pro-XRP lawyer, provided an overview of Bitcoin’s recent performance, suggesting that the premier crypto asset could see big gains in the coming months. 

He highlighted two factors that could drive government and institutional investments in Bitcoin, leading to a massive surge in BTC’s price. 

Government Adoption 

Attorney Hogan referenced the recent election result, which led to Trump’s victory and the Republican Party, with more pro-crypto lawmakers, winning the Senate and the House. 

The pro-XRP lawyer suggested that with additional support from the Democratic Party, there is a high likelihood that the United States ‘Bitcoin Purchase Program’ legislation might pass next year. 

For context, the legislation proposes that the U.S. government purchase not more than 200,000 BTC yearly over five years, bringing the total acquisition to 1 million BTC. This represents about 5.05% of Bitcoin’s 19.78 million circulating supply. 

The legislation recommends that the U.S. Secretary of State holds the acquired Bitcoin for at least 20 years to ensure long-term stability.  

Interestingly, Hogan emphasized that if the bill passes, it will potentially influence other countries to accumulate Bitcoin, thus driving the asset’s price significantly. 

Institutional Adoption  

Notably, Hogan claimed that MicroStrategy, which had a hint about the bill, embarked on a Bitcoin accumulation spree immediately after the election. Recall that MicroStrategy announced a purchase of 27,200 BTC worth $2.03 billion on November 11. According to MicroStrategy, the average cost of each BTC was $74,463. 

Currently, MicroStrategy holds 279,400 BTC, costing $11.9 billion. At the current price of $87,363, MicroStrategy’s Bitcoin portfolio is worth about $24.41 billion, representing a 105% ROI. 

Given MicroStrategy’s enormous profit, Hogan speculated that companies with excess cash reserves, like Microsoft, might face intense pressure from shareholders to invest in Bitcoin as well. 

Finally, Hogan envisages a future where Bitcoin could see a sustained rally driven by a combination of institutional and government-backed BTC investments. 

Analysts Confirm XRP Bollinger Bands Expanding After 19 Months of Contraction: A Massive Rally Incoming?

0

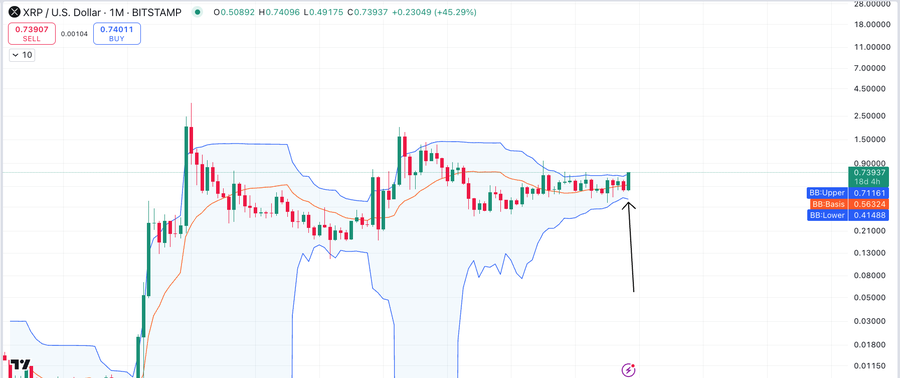
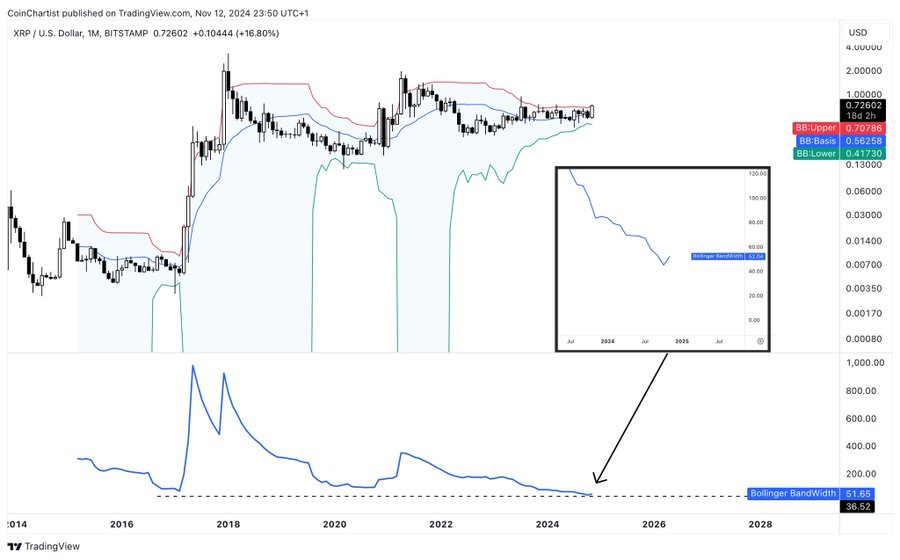
Amid the ongoing market uptrend, XRP monthly Bollinger Bands have finally begun to expand after an extended period of contraction. 

The latest development marks the end of a 19-month consolidation phase, the longest in XRP’s history. According to market analysts, historical data suggests that when XRP exits a contraction phase, it often undergoes substantial price surges.

For the uninitiated, Bollinger Bands has an upper, middle (moving average), and lower band. During periods of low volatility, these bands contract, indicating a “squeeze,” while high volatility causes them to expand. Such contractions typically lead to rapid price swings.

XRP Historical Bollinger Bands Expansions

The Great Mattsby, a market analyst, spotlighted this. For instance, XRP’s price has responded explosively after such Bollinger Band squeezes. An example occurred between August 2016 and February 2017, when XRP’s Bollinger Bands contracted for six months. 

XRP 1M Chart The Great Mattsby
XRP 1M Chart | The Great Mattsby

Following this contraction, XRP’s price soared from $0.00626 to $3.31 within a year, achieving a staggering gain of over 52,000%. This rally became one of XRP’s most remarkable historical price movements.

A similar, though less extreme, pattern emerged in late 2019 and 2020. The Bollinger Bands contracted from December 2019 to October 2020—a 10-month period. In the months following this squeeze, XRP’s price surged from $0.2419 to a high of $1.96 in April 2021, marking a 686% increase over seven months. 

However, unlike the 2017 rally, this price movement was somewhat restrained due to the Securities and Exchange Commission (SEC) lawsuit filed against Ripple in December 2020, which led to XRP’s delisting from several major exchanges and large-scale selloffs.

XRP’s Bollinger Bands Now Expanding

In the most recent scenario, XRP’s Bollinger Bands had been tightening since October 2023, creating a prolonged squeeze that, according to past patterns, could lead to a large price movement.

Currently, XRP is set for another potential breakout, as it benefits from the momentum of a broader market rally spurred by Donald Trump’s recent victory in the U.S. presidential election. XRP has already seen a 28.37% increase in November alone, bringing its price to the $0.65 region.

Chartered Market Technician Tony Severino noted XRP’s current position above the upper Bollinger Band, pointing out that the Bollinger Band Width (BBW) is now beginning to widen from the narrowest squeeze in XRP’s history. He described this movement as a potential setup for a “shock and awe” price rally.

XRP Bollinger Bands Tony Severino
XRP Bollinger Bands | Tony Severino

Currently, XRP changes hands at $0.6517, down 1.7% over the past 24 hours but up 22% in the last week. Its most immediate concern is reclaiming and holding above the $0.70 region before the next leg up.

As XRP Pumps by 45%, Analysis Suggests Further Uptrend Depends on FOMO and Balanced Funding Rates

0

XRP recently surged 45%, approaching its $0.74 year-high. Analysts caution that FOMO and funding rates on major exchanges could influence further gains.

XRP has posted a massive rise this week, gaining over 23% following an explosive performance on Tuesday. The token’s recent performance contrasts sharply with last week, when broader market momentum, spurred by Donald Trump’s U.S. presidential election victory, lifted most cryptos except XRP.

However, XRP has rebounded, climbing 7.13% in the past 24 hours, drawing increased investor interest.

According to the analytics platform Santiment, XRP has witnessed a surge in social discussions. Over 4% of all crypto-related conversations now center around XRP, fueled by its 45% price breakout over an eight-day period.

Image

XRP Uptrend Continuation Hinges Avoiding Excessive FOMO

This surge in social engagement often coincides with significant price movements, as highlighted by historical patterns. 

Santiment also noted that previous spikes in XRP’s social dominance have acted as reliable indicators of market shifts. A recent spike served as a signal for a market bottom, suggesting a recovery phase, while an earlier peak aligned with a market top, resulting in a correction.

Accordingly, Santiment cautioned that XRP’s ability to surpass its March high of $0.74 would depend on maintaining balanced funding rates on major exchanges like Binance. The platform emphasized that sustained price growth hinges on avoiding excessive long positions driven by fear of missing out (FOMO).


Technical Indicators With Bullish Outlook

Meanwhile, technical analysts are also projecting a bullish outlook for XRP. Dark Defender, a prominent market observer, highlighted that the token has broken through key resistance levels and is showing strong signals across key technical metrics.

The analyst pointed out a Golden Cross on XRP’s weekly RSI, which remains above the 50% threshold. This pattern is traditionally seen as a positive signal for continued upward momentum.

Dark Defender suggested that if XRP clears its immediate resistance at $0.6649, it could set the stage for a rally toward the $1 mark.

XRP Performance Amid Election Cycle Trends

In addition, crypto analyst Mikybull Crypto shared an optimistic outlook for XRP, pointing to historical trends. Mikybull noted that XRP has often rallied following U.S. election cycles. Based on these patterns, the analyst projected a promising future for XRP.

NEAR Protocol Targets $7.71 Amid Growing Network Activity, $5 Support in Focus

NEAR Protocol has retested the $5 mark after breaking through multi-month resistance. Will the NEAR token rebound to $7.71, or is a drop to $4.50 ahead?

Following the broader market correction, the price of NEAR’s native token has experienced a bearish reversal from a critical resistance level. The pullback has extended nearly 10% over the past two days, bringing the token back to the psychological $5 support level.

Will this bearish extension lead to a drop to the $4.50 support, or will a post-retest rebound send NEAR’s price toward $7.71? Let’s dive into the details.

Near Protocol Price Analysis

Taking a bullish reversal from the crucial support of $3.522, the bull run in Near Protocol’s native token extended from $3.50 to $5.75. The bullish recovery accounted for a 64.22% rise and seven consecutive bullish candles. 

NEAR Price Chart
NEAR Price Chart

However, the recovery rally failed to sustain dominance above the $5.50 mark, resulting in a bearish reversal. The bearish reversal started due to the massive supply at the 38.20% Fibonacci level at $5.56. It accounts for a price fall of nearly 10% in two days and forms an evening star pattern. 

Additionally, the recent pullback suggests that the Exponential Moving Averages (EMAs) will likely continue the sideways trend. The pullback has led to a declining gap between the MACD and signal lines, resulting in a drop in intensity in bullish histograms. 

Transactions and Fees Improve over Near Protocol

On-chain metrics for Near Protocol have been showing positive signs, particularly in the ongoing bull market. During the April 2024 rally, transaction fees spiked above $60,000.

Screenshot 2024 11 13 120401
NEAR PROTOCOL DAILY TRANSACTION CHART

Now, the trend is rebounding. A break above the $30,000 transaction fee could accelerate the recent recovery. Furthermore, the daily transaction count continues to form higher lows.

Screenshot 2024 11 13 120437
NEAR PROTOCOL TRANSACTION FEE CHART

On Tuesday, the total number of transactions reached 7.5 million, with 982,375 new addresses added to the network.

Given these growing metrics and improving market conditions, NEAR’s price could surge in the near future.

Will the Uptrend Reach $7.71?

In the daily chart, the NEAR token price has surpassed the long-coming multi-month resistance trendline. Essentially, the ongoing pullback comes as a potential retest. 

If the price holds above dynamic support (as indicated by the average line), the uptrend could continue, breaking above the $5.56 level (38.2% Fibonacci retracement). In this scenario, the bull run could target the 78.6% Fibonacci level, which stands at $7.71.

Experts Say Last Chance to Buy XRP Under $1, Predict Timeline for XRP to Reach $1

0

Amid XRP’s latest comeback, market experts are warning that XRP could soon break the dollar mark, predicting an aggressive pump into the double-digit range.

XRP has finally awakened from its slumber to join the bull market frenzy, breaking multi-month highs after previously underperforming and frustrating holders.

On Tuesday, XRP surged by an impressive 23%, rising from $0.5991 to as high as $0.7354—a price level last seen eight months ago in April. This remarkable turnaround coincided with Bitcoin’s attempt to break into the $90K price range on Tuesday.

While XRP capitalized on Bitcoin’s uptrend following months of anticipation, excitement has swept the XRP community. Now, market commentators are growing more confident that the elusive $1 price is within reach.

Last Chance to Buy XRP Under $1

As a result, analysts are issuing bold warnings to the crypto community that now may be the last chance to buy XRP cheaply under $1. Commentators like Edo Farina have asserted that the long-awaited $1 price level could be recaptured as early as Friday—just two days away.

Notably, since XRP broke into the $0.70 range, it has retraced to $0.6542 at the time of writing. From this point, reaching $1 would require XRP to rally by 53% in the coming days.

Meanwhile, analysts believe the $1 level will serve as a springboard for a sharp price pump.

XRP Price After $1 Breakout

Crypto educator Ralston Maximus suggests that the longer-term trendline for XRP points to the $1.09 to $1.10 range. He emphasized that once XRP surpasses the $0.75 resistance level, the next major challenge will be breaking through the $1.10 zone.

Maximus also pointed out that, regardless of short-term fluctuations, XRP has successfully broken out of its prolonged downtrend. Accordingly, he identified the $6.5 to $7 range as a potential target for the “smaller” move.

Looking further ahead, Maximus speculated that XRP could reach the $30-$35 range in the “bigger picture.” 

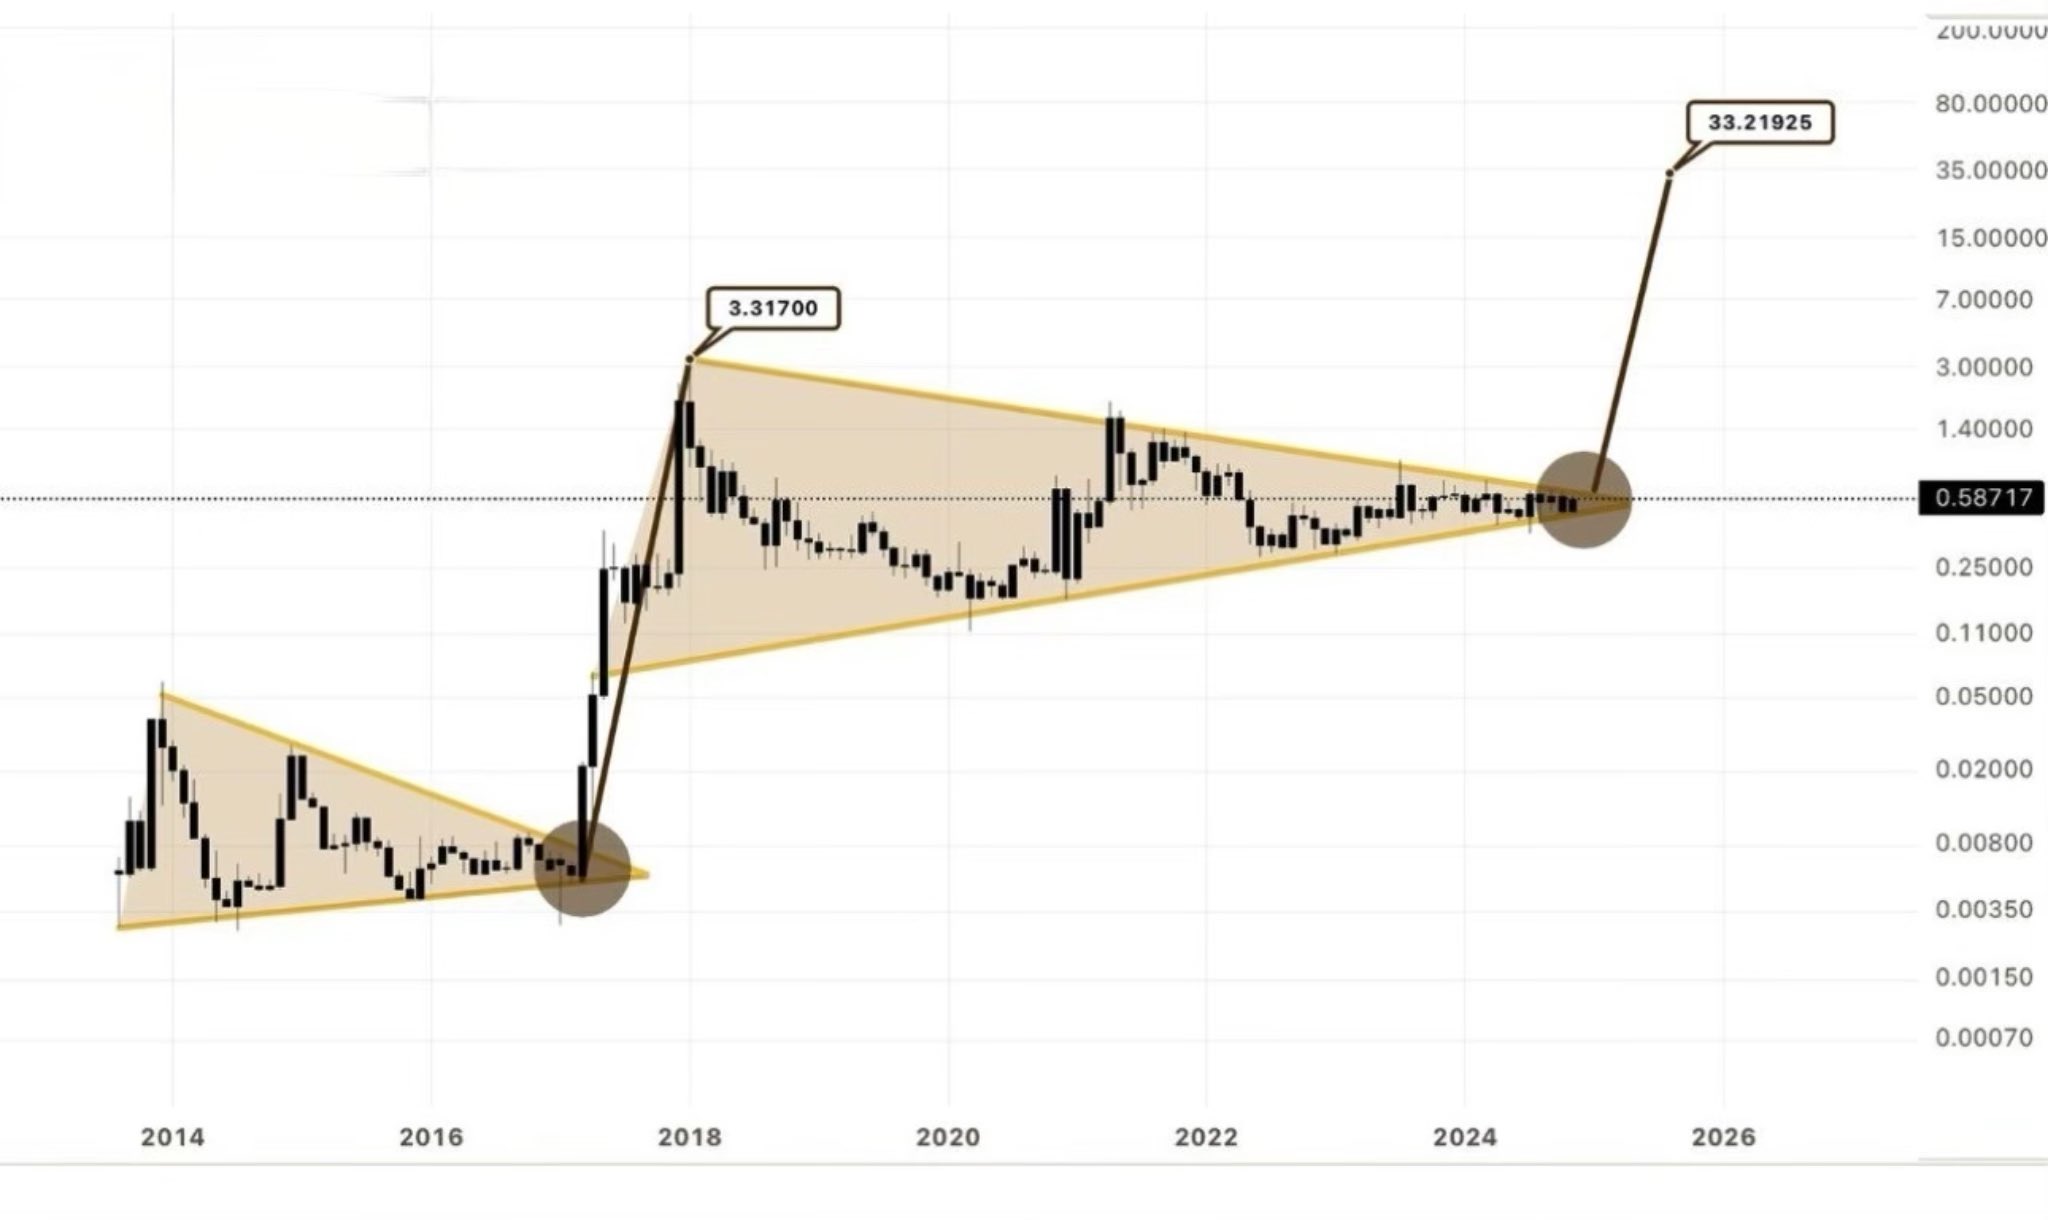
Crypto commentator Armando Pantoja shared a similar outlook in a separate analysis. He highlighted the symmetrical triangle pattern, MACD indicators, and increasing volume as key factors supporting a potential breakout for XRP.

Pantoja noted that a similar alignment of indicators played out previously, which led to XRP pumping from just a few cents to over $3. Accordingly, he suggested that after XRP surpasses the $1 mark, its price target could range between $8 and $30. 

Image
XRP Chart | Armando Pantoja