Home Blog Page 1133

Analyst Calls for Caution Amid Surging Retail Interest In Bitcoin; Here’s Why

0

Ali Martinez, a technical and on-chain crypto analyst, advises investors to be cautious following a surging retail interest in Bitcoin (BTC).

The analyst issued the notice today in a tweet, emphasizing that his warning is not bearish but a word of caution due to the rising interest in Bitcoin among retail investors. 

Bitcoin Underperforms During Rising Searches for BTC 

Martinez pointed out that even though growing retail interest in Bitcoin usually signals more capital inflow into the market, increased search for the premier asset historically aligns with price corrections. This suggests that the price of Bitcoin usually falls whenever its search activity increases. 

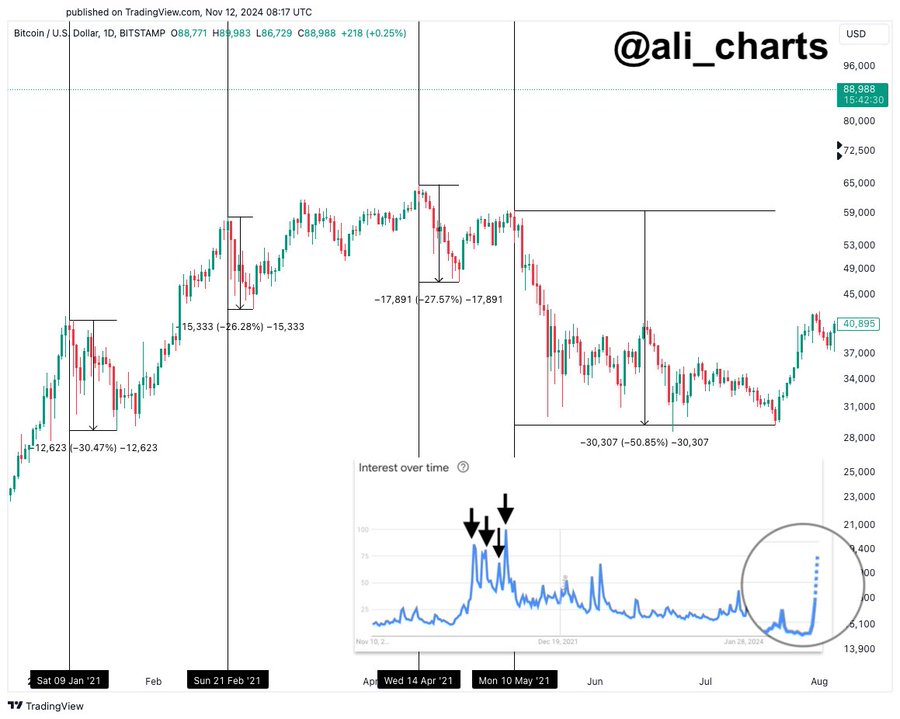
Providing more context, Martinez called attention to Bitcoin corrections in 2021, which coincided with spikes in search activity for the premier asset. According to the accompanying chart, Bitcoin registered a 30.47% correction on January 9, 2021, when Google searches for the top asset surged above 80. 

The following month, on February 21, the premier asset’s price also plunged 26.28%, coinciding with surging search activity above 75. Furthermore, Bitcoin saw a correction of 27.57% on April 14, 2021, when its global search neared a score of 70. 

Lastly, the world’s largest cryptocurrency by market cap witnessed another hefty correction of 50.85% between May and June 2021, coinciding with a Google search volume of 100. 

Notably, the chart showed that Bitcoin’s current search volume was hovering around 75, suggesting that BTC could witness another correction if the historical trend repeats itself. 
Recent Search Activity and Bitcoin Price Reaction 

According to data from Google Trends, the global search for Bitcoin stands at 52 at press time. The score peaked at 100 yesterday at 21:36 (UTC) and subsequently retraced to 72 an hour later. It has now declined to 52 in the hours leading up to press time. 

Meanwhile, Bitcoin, which attempted to break above a record high of $90,000 earlier today, has plunged to the $85,000 mark. Bitcoin is currently trading at $85,560, down 4.88% from its all-time high of $89,956. 

Binance Founder Warns Upcoming Volatility  

Besides Martinez, many crypto stakeholders have warned investors to exercise caution amid spikes in Bitcoin’s price. 

Last week, Binance co-founder Changpeng Zhao (CZ) warned that Bitcoin could experience significant volatility following its surge to an all-time high. 

He forecasted that the premier asset would register significant dips and highs in the coming days and encouraged investors to brace themselves for imminent volatility. 

“Control your greed. Don’t put all your eggs in one basket. Ape slowly,” he advised. 
Post-Halving Patterns Confirm XRP Still Needs 7 Weeks for Bull Run to Start

0

XRP is showing mixed performance amid Bitcoin’s all-time high, with analysts predicting a massive bull run to start in seven weeks based on historical post-halving trends.

Today, XRP registered a loss of 4% in its 24-hour performance, trading at $0.5841. This comes despite Bitcoin reaching an all-time high above $82K, with over 3% gains today.

Meanwhile, at its current price, XRP is 14% higher than its lower threshold from a week ago. XRP even reached a multi-week high of $0.616 yesterday before the recent retracement. However, when looking at the weekly performance of other top-ranking assets—Bitcoin included—XRP’s gains appear relatively modest.

For example, Cardano (ADA) and Dogecoin (DOGE) have surged by over 80% this week despite recent pullbacks. XRP’s weaker performance compared to its rivals has sparked significant discussion in the crypto community, with analysts attempting to provide reasons for holders to remain bullish on XRP.

In a recent analysis, “Block Bull,” a widely followed trader, issued a bold timeline for XRP’s full-scale bull run. According to the analyst, it’s not yet time for XRP’s violent bull run, but it will be in seven weeks. He emphasized that it will take another seven weeks for XRP enthusiasts to see their wildest dreams become a reality.

How the 7-Week Timeline Came About: Historical Trends

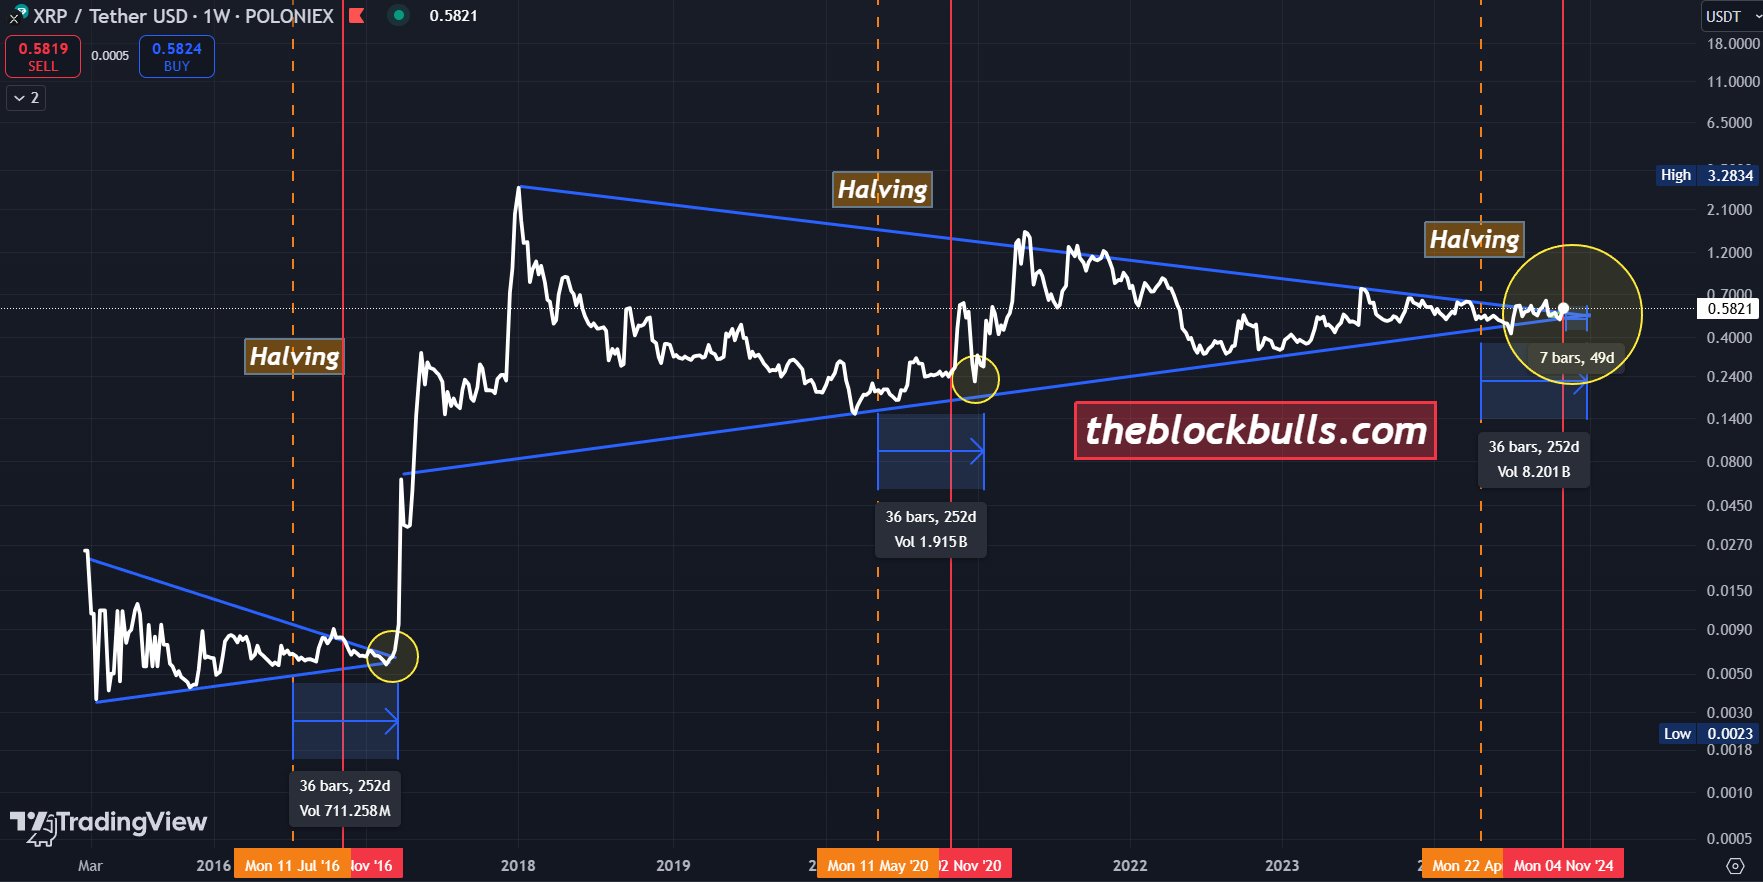
The analyst derived this bold timeline based on the time it took XRP to start its bull run in previous cycles following Bitcoin halving events. The chart accompanying the analysis showed that XRP took 252 days post-Bitcoin halving to begin its explosive rally in 2017, which culminated in XRP reaching an all-time high.

In the 2020/2021 cycle, XRP also took 252 days post-halving before breaking out and rallying by over 942%.

Image

According to this analysis, the timeline for XRP’s next run is still 49 days (or seven weeks) away, which would mark the 252-day point from the most recent Bitcoin halving—at which time XRP is expected to commence its dramatic surge.

Notably, other analysts agree with Block Bull’s perspective, predicting that XRP’s surge is imminent. Some have even pointed to other metrics, such as symmetric triangle breakouts, to support this view.

However, there is growing skepticism about XRP within the crypto community. Numerous bold predictions about XRP’s potential have failed to materialize in recent times. As a result, some critics have even suggested that Cardano (ADA) could overtake XRP as XRP enthusiasts continue to wait for the long-anticipated bull run.

MicroStrategy’s Bitcoin Holdings Now Worth $24.9B, Tesla $1B, El Salvador $550M, and Bhutan $1.1B

0

MicroStrategy, Tesla, and other major public entities record substantial gains on their stashes following Bitcoin’s price explosion past $88,000.

Large Bitcoin holders have been major benefactors of the asset’s recent rally to a new all-time high above $90,000. Firms like MicroStrategy and Tesla and countries like El Salvador and Bhutan sit on multi-million dollar unrealized gains at the current Bitcoin price.

MicroStrategy’s Portfolio Up 108%

The self-acclaimed Bitcoin development company has been one of the major beneficiaries of Bitcoin’s upsurge. Data from the Saylor tracker shows that MicroStrategy’s Bitcoin stash is now worth $24.96 billion.

Notably, the Michael Saylor co-founded software firm spent $11.98 billion to acquire its 279,420 BTC stash at an average price of $42,888. However, its Bitcoin portfolio has grown by over 108%, providing a staggering $12.97 billion unrealized gain.

Meanwhile, MicroStrategy is not selling its Bitcoin anytime, as Saylor stated they would keep buying Bitcoin forever. The firm bought 27,200 BTC with $2 billion yesterday and intends to become a Bitcoin bank ultimately.

Tesla’s Bitcoin Stash Exceeds $1B

Elon Musk’s Tesla spent $1.5 billion to acquire Bitcoin in February 2021, becoming the public firm with the largest Bitcoin holding at the time. Although the firm had sold 85% of the acquired stash, its 11,509 BTC stash has surpassed the $1 billion valuation.

Notably, when Tesla moved its Bitcoin portfolio to a new wallet almost a month ago, it was worth $773 million. The shuffle sparked selling speculations, but the electric car firm has held on to its stash, benefiting from the decision with a $258 million growth.

Elon Must, another company, SpaceX, holds $725.4M in Bitcoin. In total, Elon Musk’s Tesla and SpaceX now have $1.73B in Bitcoin.

El Salvador’s Bitcoin Portfolio Doubles in Value

Being the first country to adopt Bitcoin as a legal tender, El Salvador drew global attention to its small coast, populated by just 6.3 million people. The country has given itself to periodically acquiring Bitcoin until its pro-crypto President Nayib Bukere decided they would buy 1 BTC a day on March 16.

El Salvador’s portfolio tracker shows it has acquired 6,154 BTC since then at an average price of $44,324. Meanwhile, the stash is now worth $502 million, with 99.32% of its valuation ($136 million) an unrealized profit.

Bhutan’s Bitcoin Stash Crosses $1.1B

The small Asian country, which acquired Bitcoin through its mining activities, now holds over $1 billion worth of the crypto firstborn. When its stash went public two months ago, Bhutan’s Druk Holdings held 13,036 BTC, worth $770 million.

However, Bitcoin’s explosion past $88,000 has ensured that Bhutan’s 12,574 BTC has a valuation of $1.1 billion despite selling 935 BTC in October. Notably, Bhutan is the fourth-largest Bitcoin-holding government and the second to officially hold the asset.

Meanwhile, the German government missed out on a $1.7 billion profit by selling its stash a few months back. The Germans sold 50,000 BTC seized from Movie2K.to, a film piracy firm, at an average price of $54,000, realizing $2.7 billion.

At the current market price of $88,637, the 50,000 bitcoins would be worth $4.43 billion. Although the $2.7 billion was substantial in the contest that it realized the stash from seizure, the Germans would have had an extra $1.73 billion if it had waited till now.

Over 107 Whales Push Dogecoin Price to 3-Year High: Will More Whales Join the Rally?

0

Dogecoin is seeing astounding price surges, with retail wallet holdings increasing while 108 whales re-enter the market to boost the rally further.

Dogecoin is experiencing a surge in market activity, driven by increased interest from retail investors only days after Donald Trump won the U.S. presidential election. Recent data from Santiment, a market intelligence platform, highlights a notable increase in smaller Dogecoin wallets over the past month.

The report revealed that wallets holding less than 100,000 DOGE have increased by 74,885 over the last 30 days. However, while retail activity accelerates, larger wallet categories, such as shark and whale accounts, have decreased by 350 during the same period.

Meanwhile, 108 whale wallets have recently re-entered the Dogecoin market, contributing to Dogecoin’s rally above $0.40, marking its highest level in over three years.

Image

Santiment noted that sustained momentum for Dogecoin depends on simultaneous accumulation by both retail investors and large stakeholders.

The platform added that the coming days will be crucial in determining whether more sharks and whales will return to the market to support the ongoing rally.

Dogecoin Flowing out of Exchanges 

Concurrently, data from IntoTheBlock reveals a sharp increase in Dogecoin outflows from exchanges, a trend often associated with accumulation. Over the past 24 hours, outflow volume has surged by 157.64%, reflecting a strong movement of DOGE into private wallets. This trend becomes even more pronounced when viewed over longer periods. 

Over the past week, outflows have increased by 434.51%, while the 30-day outflow volume has risen dramatically by 1,820.58%. These sustained outflows indicate heightened interest from long-term holders, suggesting robust support for Dogecoin’s bullish momentum.

Potential Parabolic Growth

Amid these developments, analysts are closely monitoring Dogecoin’s price trajectory. Notably, technical patterns suggest the potential for a parabolic run for Dogecoin. Ali Martinez has pointed to Dogecoin’s recent breakout from a long-standing resistance trendline. 

This pattern, observed in previous bullish cycles, has historically preceded significant price surges. For instance, during the 2017-2018 cycle, Dogecoin’s breakout led to an 8,933% price increase, aligning with Fibonacci retracement levels. Based on historical data, Martinez identifies possible future price targets within the 1.618 to 2.272 Fibonacci levels, estimating a range between $3.95 and $23.25.

Will TRON Cross $0.20 with Rising Wedge Breakout Rally?

With a rounding bottom reversal, Tron (TRX) prepares for a rising wedge breakout rally. Will this uptrend cross $0.20?

Tron is showing a recovery rally as the broader market gains momentum. Currently trading at $0.1685, TRX has risen by 5.18% over the past four days, up from the $0.1602 level.

As the bull run nears a rising wedge breakout, the TRX price is teasing a high-momentum rally. Could this rally push TRON past the $0.20 mark? Let’s take a closer look.

TRX Price Analysis

With four consecutive bullish candles, Tron’s price trend is now challenging the 38.20% Fibonacci level at $0.1686. This marks a rounding-bottom reversal with a neckline at the same Fibonacci level. 

TRX Price Chart
TRX Price Chart

On a broader scale, the TRX price action is forming a rising wedge pattern following the bull run in August. Year-to-date, TRX has grown by 56.34%.

The rounding-bottom reversal is now challenging the overhead resistance line of the rising-wedge pattern. As the broader market recovers, the chances of a bullish breakout are increasing.

TronScan Reveals Positive Network Metrics

As Tron stands on the verge of a bullish breakout, TronScan reveals positive numbers over the network. The total value locked (TVL) has surpassed $18 billion, with a total transfer volume of $14.79 billion.

Tronscan
Tronscan

Transactions over the past 24 hours have surged, approaching 9 million daily transactions, currently standing at 8.92 million. Additionally, the number of total accounts has increased by 220,000, bringing the total to 271.38 million.

With increasing TVL and transaction volumes, demand for TRON is likely to continue rising.

Tron Price Targets

Supporting the bullish trend, the MACD indicator has shown a positive crossover as negative histograms decline. Meanwhile, the 50-day, 100-day, and 200-day SMAs remain in a positive alignment, signaling a buy signal for TRON.

If the breakout occurs, the trend-based Fibonacci levels suggest targets at $0.1621 (50% Fibonacci) and $0.1959 (78.60% Fibonacci). With the broader market recovering, the likelihood of TRON reaching the psychological $0.20 level has significantly increased.

On the downside, failure to break through the 38.20% Fibonacci level could lead to a pullback to the rising support trend line near $0.1650. Below that, the 23.60% level at $0.1597 serves as a crucial support level.

Analyst Recommends Buying Every Shiba Inu Dip After SHIB Made This Move

0

Popular crypto chartist CryptoAmsterdam encourages investors to see every price decline registered by Shiba Inu as an opportunity to acquire more SHIB tokens. 

CryptoAmsterdam made the recommendation yesterday while updating their previous forecast for Shiba Inu, issued on September 30. At the time, the analyst indicated that ‘Stage 4’ was printed on the higher time frames of  Shiba Inu’s chart, setting the stage for a potential upward trend. 

Following the printing of Stage 4 on the chart, CryptoAmsterdam said Shiba Inu formed a ‘mini-cycle structure,’ which propelled SHIB to a “macro range high.” 

Amid these developments, the chartist encouraged caution, urging investors to wait for two key signals. They include SHIB’s break above the corrective mini-range level of $0.25 or a false breakout that could confirm the authenticity of the move. 

Fresh Update 

Since CryptoAmsterdam issued the analysis on September 30, Shiba Inu has made some major moves, including surging to a 7-month high of $0.00003031. Hence, the analyst updated the analysis, emphasizing that SHIB has completed the mini-cycle formed as of November 30. 

According to CryptoAmsterdam, Shiba Inu recently completed the mini-cycle structure following its recent price increase. Interestingly, they expect Shiba Inu to continue its upward trend. 

However, the expert echoed that Shiba Inu’s “dips are for buying,” suggesting that every short-term dip presents an opportunity to acquire more SHIB in anticipation of an imminent price surge. 

Shiba Inu’s Incredible Performance 

November, which Shiba Inu’s lead Shytoshi Kusama referred to as GrowVember, has been favorable to multiple crypto assets, including SHIB. Shiba Inu’s rally commenced in early November after the United States re-elected pro-crypto president Donald Trump. 

Notably, SHIB has surged 59% month-to-date (MTD), 65.4% in the past seven days, 64.5% in the past month, and 182.7% year-to-date (YTD). Shiba Inu, which surged to a 7-month high of $0.00003031 earlier today, is changing hands at $0.0000289. 

Following this remarkable performance, Shiba Inu now ranks among the top 10 cryptocurrencies by market cap. It achieved the feat after flipping Avalanche (AVAX). Currently, Shiba Inu is the 10th biggest cryptocurrency, boasting a valuation of $17.09 billion. 

Given Shiba Inu’s rally, famous crypto expert Oscar Ramos projected that SHIB would soon reach a market cap of $100 billion. Notably, if the $100 billion projection becomes a reality, SHIB could trade at $0.0001697. 

In the meantime, investors must exercise caution when trading in the ongoing bull run, as massive volatility could arise in the coming days. 

As VeChain (VET) 50% Rally Nears $0.030, Is $0.067 Next?

VeChain (VET) has staged a 50% recovery rally and is preparing for a trendline breakout as it nears $0.030. 

With a market cap of $2.36 billion, VeChain has increased by 13.27% in the last 24 hours. With the newfound surge of buying pressure, the trading volumes have hit $130 million, a 42% rise in 24 hours. 

As the broader crypto market continues its bull run, VeChain is positioning for an explosive trend. Let’s take a closer look at VeChain’s price action.

VeChain Eyes Trendline Breakout 

On the daily chart, VeChain has experienced a V-shaped recovery, with a 50% price increase over the last 7 days. This rally has produced consecutive bullish candles and pushed the price above the 200-day Exponential Moving Average (EMA).

VeChain price chart
VeChain price chart

The bullish trend has also overcome the 38.20% Fibonacci level priced at $0.02795. Currently, it is trading at $0.02901 with an intraday gain of 1.75% from the opening price of $0.02845. 

Furthermore, as the bull run concludes the prevailing pullback, the previous pullback VET price action reveals a falling wedge breakout run. With a boost in buying pressure, the uptrend is heading towards the next immediate resistance at 50% Fibonacci level. This psychological mark is priced at $0.03140. 

With a boost in buying pressure, the 50-day, 100-day, and 200-day EMAs have all shown upward momentum. This increases the chances of positive crossovers regaining bullish alignment. 

The MACD and signal lines have generated a bullish crossover, accompanied by an increase in positive histogram bars. These technical indicators suggest a shift in market sentiment towards the upside.

Will VeChain Price Cross $0.050?

A bullish breakout of the 50% Fibonacci level will likely prolong the bull run to the 78.60% level at $0.04161. VeChain’s 52-week high stands at $0.05499, just above the 100% Fibonacci retracement level at $0.05137.

If the broader crypto market continues its uptrend, VeChain’s price could potentially reach the 1.272 Fibonacci extension at $0.06714, indicating an upside target of 131%.

Here’s How Much 1 Dogecoin Will Be Worth If DOGE Market Cap Hits $100B

0

Dogecoin could move close to setting a new all-time high (ATH) if its market cap surges to $100 billion amid the ongoing bull run. 

Dogecoin (DOGE) has remained one of the top gainers in the second phase of the bull run. Amid the recent rally, the dog-themed token has achieved jaw-dropping milestones, including hitting a 52-week high of $0.3032 and ranking as the sixth most valuable cryptocurrency on CoinMarketCap. 

At the current price of $0.4048, Dogecoin is up 45.6% over the past 24 hours and 141.04% in the past seven days. Interestingly, Dogecoin’s market cap has also increased by 45.6% in the past day to $59.42 billion. 

DOGEUSDT 2024 11 12 07 59 37

Dogecoin Solidifies Its Dominance in Memecoin Market 

To put this into perspective, Dogecoin accounts for 52.92% of the total memecoin market cap of 112.28 billion, cementing its position as the number one meme-based cryptocurrency. 

Shiba Inu closely follows Dogecoin in the ranking with a market cap of $17.1 billion, representing 15.28% of the total memecoin valuation. Pepe and Dogwifhat are trailing SHIB, with their valuations worth $6.08 billion and $3.22 billion, respectively. 

Dogecoin Could Hit $100B Market Cap Soon 

Following Dogecoin’s impressive run in the past few days, there are speculations that the asset could hit a market cap of $100 billion in the 2024/2025 bull run. Specifically, market observer Jake Gagain predicted that Dogecoin would be the first memecoin to hit a $100 billion valuation. 

Hitting this valuation requires an increase of 68.29% from the current market cap of $59.42 billion. This could further solidify Dogecoin’s dominance in the memecoin market and potentially elevate the cryptocurrency to the fifth spot in the global crypto ranking, overtaking BNB (BNB), which currently has a valuation of $93.78 billion. 

Here’s Dogecoin’s Price if it Hits a Market Cap of $100B

As the Dogecoin community anticipates DOGE’s surge to a $100 billion market cap, we analyzed how much a single DOGE could be worth if this projection materializes. 

First, we considered Dogecoin’s circulating supply, which currently stands at 146,757,136,384 (146.75 billion) DOGE. If Dogecoin hits the $100 billion market cap, DOGE will trade at $0.6813 per token, assuming its circulating supply remains stable. 

It is worth mentioning that the projected price of $0.6813 is still 7.63% below Dogecoin’s all-time high of $0.7376, registered on May 8, 2021. Meanwhile, the $0.68 target is close to other predictions issued by other crypto proponents. 

As reported in August, popular chartist Javon Marks projected that Dogecoin could surge to $0.6533 in the coming months, referencing key technical indicators like the asset’s Relative Strength Index (RSI). 

In the meantime, Dogecoin is still showing signs of upward momentum, with The Crypto Basic setting a potential target of $0.5408 based on Fibonacci projections. 

Experts Predict Bitcoin Could Hit $4.5M if History Repeats, Fueled by Consistent ETF Inflows

0

Ecoinometrics highlights the potential for Bitcoin to surge to $140K-$4.5M post-halving, fueled by ETF inflows and historical growth trends.

Bitcoin continued its upward trajectory on Tuesday, reaching a new high of over $89,000. This marks a significant increase from its $62,000 valuation just a month earlier.

Notably, the world’s leading cryptocurrency has gained more than 40% in just a few weeks. Despite this impressive rally, Bitcoin’s growth still lags behind the average historical trajectory typically seen after halving events.

Comparing Halving Cycles

Historically, Bitcoin’s halving cycles have triggered substantial price rallies. However, the current cycle has seen relatively modest gains so far.

According to a recent report by CME Group, after the first halving in 2012, Bitcoin’s price surged by 8,447% within a year.

The 2016 halving saw a 290% increase, pushing Bitcoin to nearly $20,000. More recently, after the 2020 halving, the cryptocurrency rallied by 559%, surpassing $60,000. However, post-2024 halving, Bitcoin has displayed lower upward movement that contrasts with the explosive growth observed in prior cycles.

Bitcoin Could Reach $4.5M Price if History Repeats

Despite this, data from Ecoinometrics suggests the possibility of a significant future surge. Their analysis highlights a potential price range of $140,000 to $4.5 million. 

According to the analytic platform, if Bitcoin mirrors the trajectory of past cycles, it could enter six-figure territory within months, especially with sustained ETF inflows.


Broader Market Trends and Comparison

While Bitcoin has experienced strong gains, it has not yet rallied in parallel with gold, which recently reached record highs, according to CME Group’s report.

Gold’s rise has been driven by widespread central-bank buying and growing concerns over budget deficits in major economies. These deficits, coupled with loose monetary policies, have made fiat currencies less attractive to investors seeking safer, hard assets. CME Group suggests that similar forces could eventually favor Bitcoin.

Historically, Bitcoin thrived during periods of low interest rates, gaining a first-mover advantage as the dominant digital asset. However, current interest rates remain above zero, and inflation levels are higher than pre-pandemic norms, potentially limiting central banks’ ability to ease monetary policy further.

Aptos Bull Run Eyes $13.71 Breakout for 190% Upside Potential

With an 82% rally, Aptos (APT) prepares for a critical breakout for an upside target of $40. 

With the Bitcoin price closing towards the $90,000 mark, the AI token market rally is starting to gain momentum. Among the top-performing AI tokens, Aptos stands out, having surged by 60% over the past seven days.

Currently, the Aptos (APT) token is trading at $12.95 and looks poised for a bullish breakout. Could this breakout push Aptos toward the $20 mark, setting a new all-time high?

Aptos Breakout Run Challenges 78.60% Fibonacci level

On the daily chart, Aptos shows a triangle breakout rally, encountering resistance at the $13.71 level, which corresponds to the 78.60% Fibonacci retracement. Following an intraday pullback of 5.46%, a bearish candle has formed, signaling potential caution for the bulls.

Aptos Price Chart
Aptos Price Chart

Meanwhile, the ongoing bull run originated from a Morning Star pattern at the 200-day EMA, with the price rising from $7.73 to $14.11, reflecting an 82.54% increase.

Aptos Partners with Zero1 Labs as TVL Surpasses $1B

Aptos is experiencing significant network growth, with the total value locked (TVL) crossing the $1 billion mark, currently standing at $1.073 billion. Additionally, trading volume has surpassed $50 million.

A recent partnership with Zero1 Labs will likely further boost the APT token. As part of this collaboration, Zero1 Labs will provide developers with resources to scale AI-powered decentralized applications using Aptos’ unique features. These will include Aptos’ DeimBFTv4 consensus protocol and a parallel execution engine.

Will Aptos Cross $20?

Currently, Aptos faces resistance at the 78.60% Fibonacci level, with the price experiencing a minor pullback. However, as the broader market recovers, the APT price is likely to overcome this resistance and challenge the 100% Fibonacci level at $18.07.

Aptos’ 52-week high stands at $20.39, and the Fibonacci retracement tool suggests a potential target of $25.66. This implies that a new all-time high for Aptos in 2024 is within reach. Beyond that, the 1.618 Fibonacci extension at $40.07 indicates a possible upside of 190% if the price breaks out at $13.71.

On the downside, the psychological support level at $10 is expected to hold as crucial support for Aptos.