Home Blog Page 1199

Analyst Suggests XRP Macro Cycle Wave 3 Could Push Prices to $12+

0

Macro technical analyst Chetan Gurjar recently presented a macro cycle projection for XRP, suggesting it could witness a price surge to two-digit figures.

Gurjar presented his analysis in a recent report on X. He highlighted the potential for XRP to surpass the $12 mark, based on Elliott Wave Theory (EWT), as the altcoin is set to enter its third macro wave. 

Wave 1 and Wave 2 Breakdown

According to Gurjar, XRP’s price structure can be divided into a series of macro cycles, the first of which began in the 2014–2017 bull run. 

During this period, XRP completed a five-wave impulsive move to the upside, which culminated in an impressive price rally. For context, XRP changed hands at $0.00403 when this first macro cycle began in June 2014. However, by January 2018, when it ended, XRP had spiked to $3.31.

XRP 1W Chart Chetan Gurjar
XRP 1W Chart | Chetan Gurjar

This first pattern, which he called “Wave 1” in the chart, represents an upward extension in XRP’s value, which set the stage for the subsequent phases of consolidation.

Following the completion of Wave 1 in January 2018, XRP entered a prolonged corrective phase, forming what is known as an ABCDE structure. This pattern began in 2018 and continued through multi-month and multi-year sideways trading, with XRP oscillating between support and resistance levels. 

Gurjar labels this extended consolidation as “Wave 2,” which took the form of a triangle pattern. Multiple market analysts have also identified this symmetrical triangle, typically a sign of market indecision and preparation for the next major price movement.

XRP Poised for Wave 3 Breakout

Gurjar suggests that XRP may now be positioned to enter “Wave 3,” which in EWT is usually the most explosive part of a bull cycle. This wave features strong upward momentum as market participants increasingly recognize the asset’s potential. 

Notably, at the time of reporting, XRP appears to be on the verge of breaking out of its triangle pattern, which would mark the completion of Wave 2. Gurjar projects a potential price target of $12.75 for XRP, based on the Fibonacci 1.618 level.

Meanwhile, in the short term, XRP continues to linger at the $0.53 region, currently changing hands for $0.5338. XRP recently faced a massive correction at the start of October following the SEC’s appeal notice in the Ripple lawsuit. 

However, the price has stabilized at press time, with a meager 1.45% drop over the last 24 hours. XRP would need a short-term decisive push to breach the upper boundary of the triangle and slip into Wave 3. However, analysts believe nothing significant will happen until Bitcoin (BTC) resumes its bullish trend.
Bitcoin Remains the Best-Performing Asset Class in 2024 Despite Weak Q3 Gains, Says NYDIG

0

Bitcoin gained 2.5% in Q3 2024, per NYDIG, with ETF inflows and corporate adoption rising.

Bitcoin’s third-quarter performance in 2024 saw a modest gain, according to a detailed analysis by NYDIG, a financial services and infrastructure firm. Per the analysis, the crypto posted a 2.5% recovery following a previous decline in the second quarter. Despite this rebound, Bitcoin’s price remained confined to a narrow range, trading between $70,000 and $54,000 over the past six months. 

The report emphasized that while the crypto struggled to make significant upward moves, it demonstrated resilience in a challenging market environment. This report caught the attention of the crypto community.  The head of research at Uphold, Martin Hiesboeck, reiterated a statement by NYDIG that Bitcoin remains the best-performing asset class in 2024 regardless of the weaker Q3 performance.

Market Influences and ETF Activity

NYDIG’s analysis highlighted key developments that affected Bitcoin’s price in the third quarter. The resolution of major bankruptcy cases, notably the Mt. Gox proceedings, led to the return of substantial amounts of Bitcoin to creditors. This, combined with significant sales of Bitcoin by the U.S. and German governments, exerted pressure on the asset.

NYDIG suggests that the anticipation of these coins entering the market had a more substantial impact on Bitcoin’s price than the actual sales themselves. 

On the other hand, exchange-traded funds (ETFs) played a positive role, with U.S. spot Bitcoin ETFs drawing $4.3 billion in inflows. BlackRock’s iShares Bitcoin Trust emerged as the top contender, significantly outperforming competitors. However, Grayscale’s introduction of its Bitcoin Mini Trust added to the competitive landscape, although its effect on Grayscale’s larger operations was felt.

New Developments in ETFs 

The report also pointed to disappointing results for Ethereum-based ETFs, which saw $523 million in outflows during their first quarter of launch. NYDIG attributes the underperformance to a lack of strong catalysts and Ethereum’s different use case compared to Bitcoin.

However, corporate involvement in Bitcoin continues to grow, with companies such as MicroStrategy increasing their Bitcoin holdings to a total of $15.2 billion. Marathon Digital also added $249 million worth of Bitcoin to its balance sheet.

Other firms, including Semler Scientific and Metaplanet, adopted Bitcoin treasury strategies, contributing to corporate ownership growth during the quarter.

Anticipated Impact of Regulatory Changes

In a recent interview, Mike Novogratz, CEO of Galaxy Digital, indicated that the approval of options trading for Bitcoin ETFs could significantly boost demand. He also highlighted the ongoing inflows into Bitcoin ETFs, which he predicts will continue over the coming years. 

Looking ahead, regulatory clarity in the U.S. could accelerate traditional finance’s adoption of crypto and stimulate innovation in blockchain technology. Notably, Novogratz suggested that both the House and Senate are likely to adopt pro-crypto stances, regardless of the outcome of the 2024 U.S. presidential election.

Analyst Says Cardano Now 10x Stronger than Last Cycle

0

Analyst Dan Gambardello says Cardano (ADA) is now ten times more robust this season than it was in the last cycle.

He cited various developments that have shaped the network’s growth over the past three years to reinforce his perspective on ADA’s potential for a substantial bull run this season.

Why Cardano is Seen as 10X Stronger

First, Gambardello pointed out that the Cardano project is now community-owned, indicating a fully decentralized blockchain. Notably, this status emerged following the recent network update brought by the Chang Upgrade. The Chang team launched the technical upgrade on September 1 after several months of anticipation.

Gambardello also noted that the Cardano development team, Input Output Global, has burned the genesis keys. This action is linked to Cardano’s transition into community management. The Cardano founder announced the destruction of the genesis keys in a post on X days before the official launch of the Chang Upgrade.

Another key factor Gambardello believes has strengthened Cardano in this cycle is Hydra. This is Cardano’s layer-2 scaling solution, designed to enhance transaction throughput. This technology aims to maintain Cardano’s security and decentralization while addressing scalability challenges.

Cardano’s Improved Market Position

Furthermore, the analyst noted that Cardano boasts a stronger market position now than in the last cycle. In October 2020, when ADA traded at a significantly low price before its all-time high rally, it had a market cap of just $2.997 billion, ranking at position 12.

However, as of today, ADA commands a market cap of $12.64 billion while in a similar cycle position as four years ago.

Gambardello also emphasized Cardano’s resilience during challenging times since the last cycle. He pointed out that Cardano maintained a position in the top ten market rankings throughout the bear markets of 2022 and 2023.

While it mostly maintained a top ranking, it has recently slipped out of the top ten amid its underperformance in the current bull season.

Pivotal Partnerships

Other factors Gambardello cited that he believes make Cardano 10x stronger include extensive partnerships, an expanded DeFi ecosystem, and robust security offerings.

Notably, in September, Cardano’s founding entity, Emurgo, announced three partnerships to bolster the blockchain’s global integration, enhance interoperability, and attract investors. Additionally, Cardano is engaged in multiple collaborations with the government of Argentina to integrate blockchain into public administration.

Gambardello has highlighted these factors to strengthen his bullish perspective on Cardano this season. In previous analyses, he argued for a potential all-time high of $11 for ADA.

Cardano and Solana Set to Unlock $85M+ Within This Period

0

Cardano (ADA) and Solana (SOL) are set to unlock a combined value exceeding $85 million worth of tokens to their circulating supplies this month.

According to data from Token Unlocks, collated and shared by blockchain reporter Colin Wu, this development would occur from Oct. 8 to Oct. 14. These unlocks could affect market conditions as they will increase the circulating supplies of both tokens, although the impact may vary.

Solana and Cardano Token Unlocks

Specifically, Solana, one of the largest token unlocks during this period, is poised to release 524,030 SOL tokens, worth an estimated $78.57 million in linear unlocks over the next week. Data confirms that this represents 0.11% of Solana’s circulating supply. 

Solana’s past token unlock events have been a regular annual process designed to boost the circulating supply and gradually reduce inflation. Even though the proportion of new tokens added may appear minimal, the substantial financial impact could be significant, particularly during periods of market instability.

Most recently, Solana also experienced the unlocking of $340 million worth of tokens in August 2024. This event is important for Solana’s mission to stabilize its inflation rate over the coming three years.

Meanwhile, the latest data confirms that Cardano will unlock 18.53 million ADA tokens valued at $6.5 million in a single cliff unlock over the next seven days. This value constitutes just 0.05% of its circulating supply. 

Cardano’s tokenomics strategy is more conservative compared to Solana, with unlocks typically tied to its developmental milestones. Notably, such unlocks for Cardano have not led to significant market volatility, as the percentage of unlocked tokens is relatively small.

The Crypto Basic confirmed late last month that Cardano and Solana would witness large token unlocks from Oct. 1 to 7, amounting to a combined value of nearly $96 million. Of this figure, Cardano accounted for $14.34 million, amounting to 15%, while Solana’s unlocks totaled $81.56 million.

Over $451M in Token Unlocks 

The latest token unlocks, set for the next seven days, are part of a broader trend in the crypto market, with more than $451 million worth of tokens from various projects becoming available. 

Token Unlocks
Token Unlocks

Among these projects, Worldcoin (WLD) will release 37.23 million tokens, accounting for 7.32% of its circulating supply. Other notable unlocks include Bittensor (TAO), Avalanche (AVAX), and NEAR Protocol (NEAR), with values ranging from $15 to $74 million.

Meanwhile, at press time, the crypto market is in an indecisive state, with a few altcoins seizing the moment to record unique gains. However, SOL and ADA are only witnessing meager price increases, respectively up 4.29% and 3.53% over the last 24 hours.

Shiba Inu Full Send Loading as Breakout and Backtest Completed: Analyst

0

Technical analyst Charting Guy predicts a potential price surge for Shiba Inu, citing successful breakout and backtest signals in the buoyant meme coin market.

Today, the meme coin market is booming, with some tokens creating new all-time highs while others register impressive price surges. Notably, Shiba Inu is benefiting from the buoyant meme coin market, albeit mildly.

At the time of reporting, Shiba Inu has seen a growth of 3.34%, trading at $0.00001793, although its weekly performance remains in cumulative negative territory.

While Shiba Inu’s price action has not been spectacular in the past few days, technical analyst Charting Guy believes the dog-themed meme coin is gearing up for a massive price pump.

Shiba Inu Breakout and Backtest Checked

Taking to X today, the analyst pointed out that Shiba Inu is in the final waiting phase, anticipating a significant upside in the near future. He shared a historical weekly chart showing that Shiba Inu has successfully broken out from the protracted downtrend that commenced seven months ago in March.

Notably, the breakout occurred in the last days of September when Shiba Inu staged a growth of over 40% within two days, recapturing the $0.000021 territory. However, SHIB has since corrected most of its gains, retesting a low of $0.00001553.

At press time, Shiba Inu is gradually recovering, having attained an intraday high of $0.00001878 before pulling back.

Meanwhile, Charting Guy believes SHIB has successfully completed the backtest with its current market position. With the breakout and retest confirmed, the technical analyst suggests that Shiba Inu’s “full send” is loading, implying that a violent price pump is imminent for the meme coin.

Image
Shiba Inu chart by Charting Guy

Potential Price Targets for SHIB

This latest commentary updates one from September 23, when he declared that Shiba Inu “is ready.” At that time, Shiba Inu was trading at $0.00001429. Remarkably, the meme coin went on to surge by 49.82%, reaching $0.00002141 days later.

Now, Charting Guy is confident in his forecast of another uptrend for SHIB. His chart outlines immediate resistance at $0.00002266. Notably, if this level is reclaimed, SHIB will target the $0.0000312 resistance next.

For context, Shiba Inu only needs a spike of 26% to reach $0.00002266, a price level last seen in June. Additionally, the analysis outlines immediate support levels at $0.00001104, where the bulls are likely to defend against any significant selling pressure.

Dogecoin Forms Familiar Triangle Pattern Hinting at Likely 207% Surge

0

Currently trading at $0.1115, Dogecoin has continued to build momentum this Monday, extending gains after successfully retesting a key support level last week.

This recovery indicates potential strength as the cryptocurrency remains above its critical price range. Analysts are closely monitoring familiar chart patterns, with some speculating that Dogecoin may be preparing for its next significant rally.

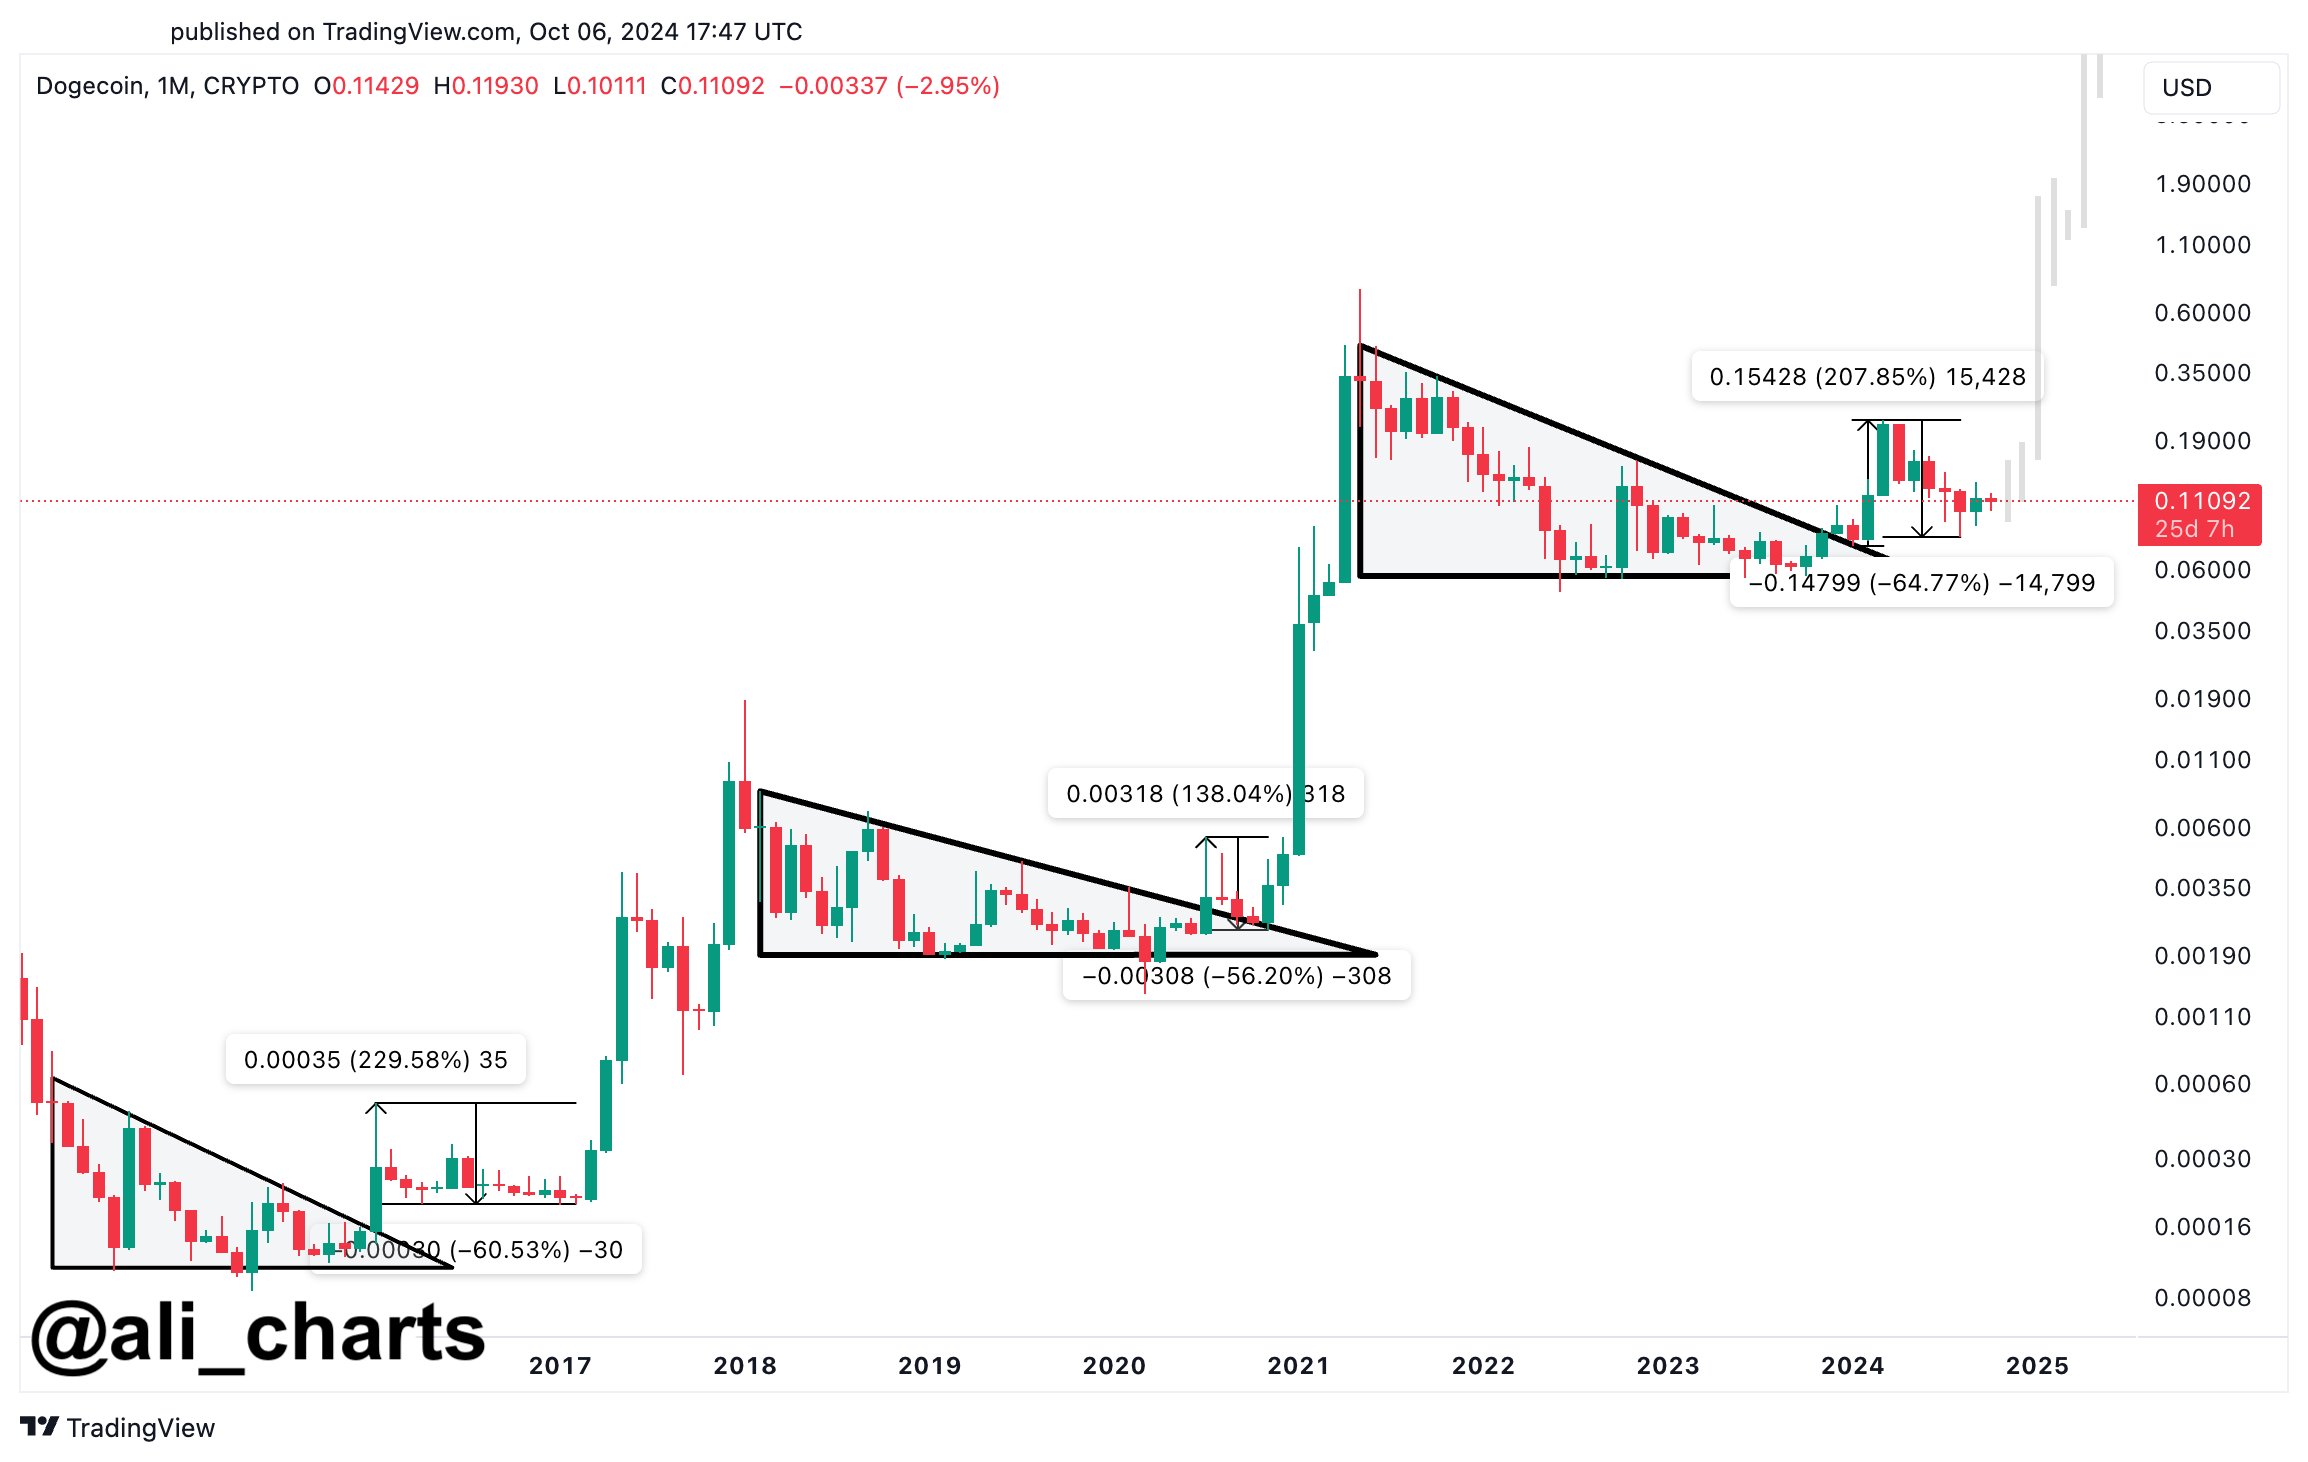
Analyst Ali Martinez has drawn attention to a potential repetition of historical movements, suggesting that Dogecoin could follow a pattern seen in previous cycles.

Historical Patterns Show Potential for Rally

Martinez’s analysis highlights a specific recurring pattern in Dogecoin’s price action. The first instance of this pattern, from 2015 to 2017, saw Dogecoin undergo a 60.53% decline over several months before forming a descending triangle.

Following the breakout from this formation, Dogecoin surged by 229.58%. Similarly, between 2018 and 2020, Dogecoin experienced a 56.20% drop, followed by a breakout and a 138.04% price increase.

The third and most recent pattern occurred from 2021 to 2023, during which Dogecoin retraced by 64.77% before rallying by 207.85%. Martinez suggests that Dogecoin could be on the verge of repeating this pattern once again.

The recent 65% pullback from its March yearly high could set the stage for another breakout, potentially leading to a sizable price surge. Historical data shows that similar pullbacks have often preceded significant rallies.

Image
Dogecoin historical chart

Additional Insights on Dogecoin’s Movement

Data indicates that large Dogecoin holders accumulated 2.07 billion DOGE over the past week, marking the largest net inflow since January. This significant increase in net flow among large holders signals strong interest from whale investors, which could potentially influence price movement.

Retesting Key Levels

In addition to the historical analysis, Dogecoin’s current price action shows promising signs. Martinez notes that Dogecoin is retesting a breakout from a falling wedge formation.

At the time of Martinez’s post, Dogecoin had been hovering around the broken resistance trendline after a four-day period of downward movement, during which its market cap fell by 20%.

Despite the downturn, Dogecoin held near the psychological level of $0.10, achieving an intraday gain of 1.07%. Meanwhile, as of today, it has seen a more impressive 2% gain, trading at $0.1121.

Expert Says XRP Will Do Nothing Significant Until This Happens

0

Crypto analyst Charting Guy asserts XRP will continue to make menial price movements until Bitcoin, the largest crypto asset, finds its footing.

The mood around XRPL’s native token, XRP, has looked gloomy recently following the recent appeal notice by the US Securities and Exchange Commission (SEC). For context, the US securities watchdog filed a notice of appeal on October 2 to contest Judge Analissa Torres’s ruling.

Although up 1.33% in the past 24 hours, XRP is down over 16% over the last seven days. Nevertheless, bullish sentiments continue to swell around the XRP Ledger ecosystem, with experts speculating ambitious price targets like $6, $20, and $44. 

However, market expert Charting Guy has asserted that XRP will not see substantial price actions until Bitcoin “breaks to price discovery.”

XRP, Altcoin Movement Tied to Bitcoin

Charting Guy noted that the market will continue consolidating until Bitcoin’s next notable price action is known. For context, multiple crypto analysts have confirmed that the premier asset has been on a range since March.

A recent analysis Javon Marks confirmed that Bitcoin has been ranging since its all-time high of $73,949 in March. The asset’s price has shuffled between mid-$60,000 and $50,000 since then.

Veteran Peter Brandt also confirmed this price range in several analyses. In one of his analyses, Brandt noted that Bitcoin has shown no clear price direction, urging traders to wait for a confirmation before opening positions.

Amid these commentaries, Charting Guy believes altcoins like XRP will have to wait till Bitcoin’s next clear price direction becomes evident before they move substantially. It bears mentioning that the dependence on Bitcoin is glaring, as the largest crypto asset by market cap exacts 56% dominance over the sector.

Meanwhile, analysts have speculated that Bitcoin would see higher prices, drawing optimism of a broader market surge. Per an earlier report, a Bitcoin insight and documentary provider tipped the premier crypto asset to trade at $80,518, $89,727, and $106,718 by the end of October, November, and December, respectively.

Analyst Gives XRP Price Range till Bitcoin Breakout

While XRP awaits Bitcoin’s breakout, Charting Guy asserted that the altcoin would continue to range between the $0.43 and $0.67, within the Bollinger Bands. Notably, XRP is within that price range, trading at $0.5373 at the time of writing.

XRP Price Prediction per Charting Guy

The market expert predicted that an XRP monthly close above $0.67 will push the asset to higher prices, while a close below $0.43 will prompt further price downtrends. 

Notably, Charting Guy asserted that the XRP Bollinger Bands will continue to tighten until Bitcoin’s next move is confirmed. The analyst also stated that other altcoins will follow a price pattern similar to the XRPL native token.

Can Solana Hold Support or Plunge Below $140 Amid Market Volatility?

Will Solana (SOL) drop below the short-term rising channel for a plunge to $140 amid increasing volatility?

On the one-hour chart, Solana’s recent price recovery shows a quick bounce back from the $134 level. Solana formed a low after hitting $133 last week, driven by escalating global political tensions.

The price quickly rebounded, revealing a rising channel pattern characterized by increasing momentum.

Solana’s Recovery At Risk

The recovery rally surpassed the local resistance trendline, peaking with an 11.40% surge near $150.39. However, a swift rejection from the overhead trendline caused Solana to fall below the $147 mark, indicating a negative cycle within the channel.

During this ongoing negative cycle, Solana’s market cap has dropped by 2.29% and is approaching the support trendline.

Solana Price Chart
Solana Price Chart

According to the Fibonacci levels throughout the correction phase, the negative cycle has struggled to maintain dominance above the 50% Fibonacci level at $147.43. Currently, with a bearish engulfing candle reflecting a 0.98% drop, Solana’s price is trading at $146.95.

Additionally, the correction phase is approaching the 200-day EMA. The rising 50-day EMA hints at a potential golden crossover, suggesting a possible bounce near this dynamic support.

However, the correction cycle within the channel has resulted in a negative crossover on the MACD indicator. This puts a risk over the support trendline and the dynamic average lines.

Will SOL Uptrend Cross $150?

A breakdown below the rising channel could jeopardize the 23.60% Fibonacci level at $140.75, with the next support level for Solana at $134.77. On a more optimistic note, the ongoing correction may be viewed as a retest phase of the broken local resistance trendline. Therefore, a bullish bounce could challenge the overhead resistance trendline for a breakout.

In case of a breakout rally, the Fibonacci levels suggest a target of $154.60 at the 78.60% and 100% Fibonacci levels.

Should the Solana price action reach the neckline at $160, it would complete a rounding bottom reversal. In the event of an extended bullish trend, the next resistance levels for Solana are projected at $166.98 and $175.74, corresponding to the 1.272 and 1.618 Fibonacci levels.

Expert Forecasts XRP and Solana Prices if BTC Hits $120K

0

The crypto market is gearing up for the second phase of the ongoing bull market, with analysts expecting altcoins like XRP and Solana to capitalize on the Bitcoin lead.

Renowned market commentator Erwin is one such analyst. In his latest report, he laid out ambitious targets for several crypto assets, projecting massive percentage increases for some of the market’s biggest names.

Among the standouts are Solana and XRP. Both assets, according to Erwin, could experience massive gains if Bitcoin climbs to $120,000—an 88% rise from its current price. However, their paths toward these targets have been different in the ongoing bull run.

Solana Positioned for a 541% Surge

Solana (SOL), currently trading for $148 at the reporting time, has already shown its resilience and potential during the first phase of the bull run, which began in late 2023. 

The altcoin skyrocketed to a two-year high of $210.18 in March 2024, surpassing $200. This marked a staggering 779% increase from its Q4 2023 price of around $23.88. Although Solana has since corrected some of these gains, its current price still represents a 519% increase since Q4 2023.

Erwin believes that Solana could rally even further in the next phase, predicting that it could soar by an additional 541% to hit a new all-time high (ATH) of $950. This would surpass its previous ATH of $259, which was set during the November 2021 bull run. 

XRP Poised for an 825% Rally After Slow Start

In contrast to Solana, XRP has had a more challenging ride during the first phase of the current bull market. While many assets saw explosive growth from Q4 2023 through Q1 2024, XRP’s performance remained relatively muted. 

The digital asset, which is embroiled in a high-profile legal battle with the U.S. Securities and Exchange Commission (SEC), only reached a peak of $0.74 during this period—representing a modest 42% increase from its opening price in Q4 2023.

Several market analysts believe XRP’s inability to fully capitalize on the first phase of the bull run stemmed from the uncertainty surrounding the SEC’s legal case. 

However, with the market preparing for a second wave of bullish sentiment, XRP could finally break through the psychological barrier of $1, a threshold it hasn’t crossed in three years. 

Erwin is even more optimistic, projecting that XRP could surge by 825% from its current price of $0.54 to reach a new ATH of $5 during the upcoming rally. This would mark a significant reversal of fortunes for the asset, which recently dipped to $0.52 following the SEC’s appeal in the Ripple case.

Other Altcoin Predictions

Beyond Solana and XRP, Erwin believes Ethereum (ETH) could rise by 303% to $10,000, and Binance Coin (BNB), could increase by 195% to $1,700. Erwin’s predictions also include other emerging assets like TAO, predicted to hit $2,100, and Chainlink (LINK), which could climb to $150.

Shiba Inu Ready for Breakout: Analyst Targets $0.00047 Based on Buy Signals

0

Market analyst Cantonese Cat highlighted Shiba Inu (SHIB) as one of the only ten altcoins currently flashing a buy signal.

The market commentator discussed this in one of his recent YouTube analyses, sharing a chart that shows Shiba Inu is now showing promising potential for a massive price rise.

Shiba Inu Flashes Buy Signal

Cantonese Cat confirmed that the primary indicator backing this bullish sentiment is the “L3 Banker Fund Flow Trend Oscillator,” which has triggered a buy signal for Shiba Inu. 

This buy signal is extremely rare, and at the moment, several other crypto are missing it despite the current market conditions. The analyst explained that the last time this signal appeared for SHIB was in July 2023. At the time, Shiba Inu traded between $0.000007 and $0.000008.

After this signal, the price remained relatively flat for several months before a substantial rally in February 2024 on the back of the broader market bull run. SHIB experienced a notable price increase, with the $0.000045 peak in March representing 5x gains from the initial buy signal.

The chart reveals that Shiba Inu may again be in a position to replicate a similar rally. The chart shows Fibonacci retracement levels that provide a clearer idea of the price targets. 

Shiba Inu 1W Chart Cantonese Cat
Shiba Inu 1W Chart | Cantonese Cat

SHIB Price Targets 

The ultimate target for Shiba Inu is at the 1.618 Fibonacci extension level, which sits around $0.00047. Reaching this level could result in a 30x gain. However, the analyst also cautions that while this target is achievable, it would require SHIB to break through strong resistance zones.

Looking at the overall market conditions, Cantonese Cat compared the SHIB chart to a broader altcoin market index, excluding major cryptocurrencies such as Bitcoin, Ethereum, and stablecoins. 

This index revealed a large “cup-and-handle” formation that could lead to massive gains. The altcoin index has recently broken out from this handle pattern after a retest of the trendline, a positive sign for altcoins like Shiba Inu.

Moreover, Cantonese Cat indicated that Shiba Inu could surpass its all-time high if it continues to follow the bullish momentum suggested by the current setup. While he expects a breakout above the projected resistance arcs to propel SHIB toward $0.00047, he believes this scenario remains speculative.

The chartist was cautious in his projections, noting that such a move might be overly optimistic in the near term. Instead, he emphasized more conservative expectations, with the 10x gain being a more realistic outcome in a rally to $0.000139.

At the reporting time, Shiba Inu has gained 7% over the past 24 hours to change hands at $0.00001855. The market analyst confirmed that altcoins such as Ethereum, Solana, XRP, and Dogecoin are not exhibiting similar buy signals.