Home Blog Page 1250

XRP Eyes $9 as Stoch RSI Finally Breaks 14-Month Downtrend

0

XRP shows signs of potential price breakout, as its Stochastic RSI finally breaches a downtrend that has plagued it for over a year.

Market analyst Big Mike confirmed this on Twitter, sharing a 1-month XRP chart to corroborate his findings. The chart indicates that monthly Stoch RSI had been moving underneath a downward trendline since it dropped from the 87.97 peak in July 2023.

Stoch RSI Breakout

For context, this Stoch RSI peak last July coincided with XRP’s rapid price spike during that period, which saw it reclaim $0.93 on the back of the pivotal summary judgment in the Ripple v. SEC lawsuit.

However, XRP corrected the gains it picked up weeks later, leading to a slump in the monthly Stoch RSI. Nonetheless, after dropping to a low of 3.27, the indicator appears to be recovering. Despite the ongoing market uncertainty, the Stoch RSI has recorded an impressive spike in recent times.

It has now broken above the downtrend, which lasted for 14 months. This development coming up during times of market uncertainty indicates that XRP is showing strength despite the ongoing turbulence. This could fuel an extensive rally if the bulls maintain this strength.

Elliott Wave Pattern Suggests Rally

The projection of a breakout coincides with XRP entering the final leg of an Elliott Wave structure. In the monthly chart, XRP is currently moving through an Elliott Wave structure, currently in the fifth wave. 
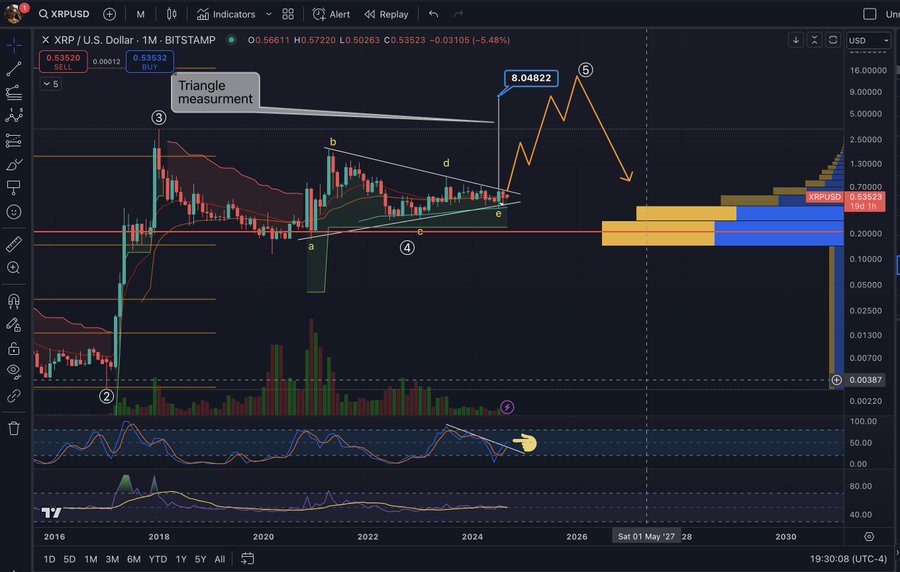
XRP Monthly Chart BigMike
XRP Monthly Chart | BigMike

This fifth wave is the final impulsive wave following the fourth wave, which often leads to corrections. According to the projection from Big Mike’s chart, XRP could surge as high as $9+, marking the top of the fifth wave.

The chart also features a symmetrical triangle, supporting this bullish outlook. Symmetrical triangles usually indicate periods of consolidation, followed by a breakout. With XRP nearing the apex of this triangle, a breakout appears imminent, possibly propelling the price towards the $9 region.

XRP Volume Profile and Support Levels

Meanwhile, the XRP volume profile reveals a strong support base between $0.20 and $0.30. This zone serves as a psychological barrier where buying interest could prevent prices from falling significantly in case of any pullback. 

In addition, it also suggests that any corrective movement after the projected wave 5 rally could find stability around these levels. 

Beyond the Stoch RSI, the traditional Relative Strength Index (RSI) confirms the prevalent market uncertainty. Notably, the monthly RSI has steadied between 55 and 47 since last July. A rapid surge triggered by the breakout could push it above 70 just as in April 2021. XRP currently trades for $0.5377.

Shiba Inu Eyes Double-Digit Gains as 2 Key Indicators Turn Bullish

0

The Shiba Inu downward trend could soon be over as the meme coin looks primed to register double-digit gains.  

Shiba Inu has endured a multi-month downtrend, which began after its price surged to around $0.000045 in March. Ever since, Shiba Inu’s price has plummeted heavily, plunging to a low of $0.00001075 on August 5 before a recovery.

Shiba Inu Primed for 14.92% Gain 

Although Shiba Inu has rebounded to $0.00001337 at press time, investors are not pleased with the asset’s recent downward trend.

SHIBUSDT 2024 09 12 07 43 44
Shiba Inu 1D Chart

However, this trend might soon be over as two key SHIB indicators recently turned bullish, indicating potential gains for the asset. 

Specifically, Shiba Inu’s Moving Average Convergence Divergence (MACD) signaled positive momentum as the histogram bar above the neutral lines turned green. 

Additionally, the Relative Strength Index (RSI) of Shiba Inu edged close to the neutral level at 50. The dog-themed token boasts an RSI of 45, suggesting that a double-digit gain is imminent. 

Consequently, Shiba Inu could stage a rally to $0.00001525, marking a surge of 14.92% from its current price of $0.00001337. This could take Shiba Inu closer to hitting last month’s high of $0.00001610. 

Several factors, including the massive influx of developers to Shibarium, could also support Shiba Inu’s potential double-digit gains. 

Following the launch of the Shibarium development portal (ShibDev), the L2 network witnessed a growth in developer activity. This was reflected in the increase relating to deployed contracts. 

Specifically, on September 5, developers deployed 34 contracts on Shibarium, only slightly lower than the 3-month high of 36 contracts registered on July 25. As more developers flock to Shibarium, the network could welcome more decentralized applications (dApps), which could intensify SHIB burns.  

Shiba Inu Is Undervalued 

In the meantime, Santiment data shows that Shiba Inu’s Market Value to Realized Value (MVRV) ratio over the 30-day timeframe stood at -2.067%. For context, the MVRV indicator determines whether a token is overvalued or undervalued within a specific timeframe. 

With SHIB boasting a negative MVRV of -2.067% over the past 30 days, it indicates that Shiba is undervalued. 

Also, Shiba Inu’s Network Realized Profit/Loss Metric shows that SHIB traders have incurred losses in the past 30 days. This is reflected in the negative spikes on the chart. These negative spikes stem from the losses investors have suffered, resulting in the liquidation of several long positions. 

Top Analyst Says Solana to Hit $4,000 Target If It Repeats Previous 51,250% Rally

0

Solana (SOL) has shown signs of recovery, consistently rising over the past week despite broader market downturns affecting major cryptos. 

A recent analysis by TradingShot reveals the potential for a significant rally for SOL. According to the analyst, Solana is projected to rise as high as $4,000 in this cycle, contingent on key technical factors.

Possible Surge to $850 and $4,000

According to TradingShot, Solana’s one-week moving average (MA50) is a critical support level that has played a significant role in previous cycles.

In June, the expectation was for Solana to test this MA50, which it did early last month before rebounding. However, recent corrections have raised concerns that the MA50 might not hold.

If this support fails, the price could next test the 1W MA200, potentially jeopardizing the continuation of the bullish cycle.

SOL 1W Chart / TradingShot

Additionally, Solana’s 1-week relative strength index (RSI) is a crucial indicator to monitor. Following a double top in March, Solana has been in a correction phase and is approaching the bull cycle’s buy zone, where buying interest typically increases during bullish phases.

In the previous cycle, Solana experienced an extraordinary rise of over 51,250%. TradingShot noted that if a similar pattern unfolds, the potential peak could exceed $4,000.

However, the analyst noted that a target of $850 offers a realistic outlook for shorter-term investors seeking a more conservative approach.

Notably, with Solana trading at $134 at press time, attaining $850 demands a growth of 534%. Meanwhile, his most ambitious target of $4,000 would amount to a staggering return of over 2,885% for current investors.

Whale Activity Boosts Market Confidence

Another factor contributing to Solana’s potential rise is the activity of whales. Notably, one whale recently purchased 34,807 Solana tokens, worth approximately $4.52 million, bringing the total to around 207,000 tokens valued at $29 million. 

This whale has steadily moved tokens to self-custody since February, signaling a strategic approach to accumulation. Moreover, the whale staked 115,135 SOL, valued at $15.3 million, reinforcing the long-term bullish outlook among major holders.

A Surge in Daily Active Users on the Solana

Further supporting Solana’s bullish case is the surge in daily active addresses on its network. Recent data revealed a record high of 5.5 million active users, surpassing other blockchain networks like NEAR, which recorded 2.9 million. 

This increase in user activity, particularly notable given the market’s recent downturn, underscores growing adoption. The uptick began in late August and accelerated sharply by September 8, when Solana’s user count more than doubled within days.

Solana Targets $161 as Network Activity Hits Record Highs

Solana’s ongoing price recovery is gaining momentum as network growth continues. Could this drive the price past the psychological barrier of $150?

With a bullish recovery this week, Solana has increased by 3.50% since Monday, resulting in a price jump of 7.75% over the last seven days. However, the SOL price action faces opposition from the 20-day EMA and struggles for a bullish comeback.  

Will the rise in buying pressure amid the recovery run resurface the trend reversal above $150?

Solana Shifts Momentum In 1-hour Timeframe

On the 1-hour chart, a bullish reversal appears to be forming an inverted head-and-shoulders pattern. The neckline for this pattern is positioned at the 38.20% Fibonacci level, which is $136.53.

Currently, SOL’s price action suggests a potential right-shoulder formation, with a recent pullback of 0.76% over the past three hours. If the pattern holds and the Fibonacci levels guide the movement, the breakout rally could potentially target $145, aligning with the 61.80% Fibonacci level.

Solana Price Chart
Solana Price Chart

Furthermore, the 100 EMA and 200 EMA are nearing a bullish crossover on the 1-hour chart, indicating potential upward momentum. However, critical support for Solana is currently at the 20 EMA, which stands at $133. According to the Fibonacci retracement, the immediate key support level is 23.60%, around $130.68.

At press time, Solana trades at $135.

Solana Network Hits 5.5M Daily Active Addresses

Amid the recovering rally, Solana registered a massive network surge on September 10. With a boost in daily active addresses, Solana recorded a recent high of 5.5 million daily active account addresses. 

This impressive figure surpasses both competitors and leading Ethereum layer-2 projects. Notably, these 5.5 million accounts represent roughly twice the daily active addresses across major networks.

Further, the Solana blockchain maintains scalability with 500 true transactions per second, beating rival chains by a huge margin and supporting the massive surge in daily active addresses. 

Massive Supply Incoming?

However, in recent news, the FTX/Almeda-associated wallet has redeemed 177,693 SOL tokens worth $23.75 million from Solana’s Proof of Staking. As the crypto market stands on the verge of a bullish recovery, the FTX/Almeda may soon transfer these SOL tokens to a centralized exchange to cash out. 

Currently, the address holds up to 7.0757 million SOL tokens worth $943 million in staking. Notably, most of the SOL held by FTX could have been sold through over-the-counter deals.

Will Solana Surpass $150?

In the larger picture, the inverted head-and-shoulders pattern and the 7-day recovery suggest a potential rounding bottom pattern on the 1-hour chart. The neckline for this significant trend reversal pattern is at the previous swing high of $161.

Therefore, based on the current price action analysis, Solana’s upside potential could be approximately 19.74% from its current market price.

Analyst Sees Shiba Inu Cracking $0.001, Here’s the Breakout Timeline

0

Krao, a TradingView analyst, remains bullish on Shiba Inu, predicting that the meme coin could hit $0.001 within the next few months.

He expects this ambitious rally to occur following a breakout from a multi-month descending trendline that has prevented SHIB from recording a massive uptrend since 2021. If the breakout rally materializes, Shiba Inu’s price would skyrocket by 7,379% from its current level.

Shiba Inu Potential Breakout

A monthly chart shared by Krao indicates a long-term descending trendline that has kept SHIB under pressure since late 2021. After peaking in October 2021 at the all-time high of $0.00008854, Shiba Inu collapsed along with the broader market.

Following a recovery course, the meme coin slipped into a consolidation period. This period featured a series of lower highs and relatively flat movement between a low of $0.000005 and a high around $0.00003. The extended period of low volatility suggests SHIB may be gearing up for a massive move.

Shiba Inu 1M Chart
Shiba Inu 1M Chart

Krao’s chart also presents resistance formed along the descending trendline. The analyst anticipates a breakout through this trendline from January to February 2025. Interestingly, his target for this breakout is the psychological milestone of $0.001, a 7,379% increase from current levels. 

Moreover, Shiba Inu volume, though volatile, has largely leveled off, and the monthly RSI hovers around neutral. This suggests that SHIB is neither overbought nor oversold. 

While it may take time for momentum to build, Krao’s prediction focuses on the coin breaking through its descending wedge structure. Market analysts often associate this pattern with reversals or strong breakouts.

Short-Term SHIB Movements

Meanwhile, on the daily chart, Shiba Inu is currently forming a smaller symmetrical triangle. With prices converging following the fall from the $0.00008845 peak, the coin is nearing a decision point. 

The green trendlines on the daily chart show tightening price action, with the support level forming higher lows and the resistance level creating lower highs.

Shiba Inu 1D Chart
Shiba Inu 1D Chart

This symmetrical triangle shows a battle between buyers and sellers, but neither side has gained dominance yet. However, symmetrical triangles tend to resolve in the direction of the prevailing trend, which, given the preceding downtrend, may suggest further downside pressure. 

However, if the bulls can muster enough strength to push SHIB through the upper resistance, a short-term breakout could be on the cards.

Notably, Shiba Inu is currently hovering around the pivot level (P) of $0.00001337. If the price breaks above the first resistance (R1) at $0.00001562, it could signal bullish momentum.

Nonetheless, if SHIB fails to clear this resistance, it could slide toward the support levels around S1 ($0.00001154) and S2 ($0.00001028). This makes the $0.000015 range a critical area to watch.

Expert Clarifies XRP Confusion in Swift’s Latest Plan to Integrate Regulated Assets

0

A leading crypto figure clarifies the confusion concerning XRP in Swift’s move to advance its infrastructure to enable transactions with regulated assets.

On Wednesday, renowned payment processor Swift published a report about its efforts and plans to integrate digital assets and cryptocurrencies into its service. The report highlighted that Swift is working to enable transactions with regulated digital assets on its network.

This move follows successful experiments and research in blockchain interoperability and central bank digital currencies (CBDCs). Leveraging its extensive experience in global interoperability, Swift aims to address current challenges in the digital asset space, such as fragmented platforms and regulatory issues. 

The goal is to create a unified network that supports various asset classes and currencies, including tokenized assets and CBDCs. Swift is actively developing and testing solutions to facilitate these transactions, with plans to share more details and progress in the near future.

XRP Community Reacts

Notably, Swift’s latest publication has sparked significant interest from crypto enthusiasts, especially the XRP community. Some XRP supporters have interpreted the report as hinting that XRP may be central to Swift’s plans. 

This speculation is based on Swift’s mention of enabling transactions with “regulated digital assets.” Proponents believe it refers to XRP, given its recent regulatory clearance from a federal U.S. court.

However, other community members have pointed out this misconception. One such member is Zach Rynes, a community liaison for Chainlink, who addressed misinterpretations with alternative facts. 

Swift Not Hinting at XRP 

Rynes pointed out that Swift’s report is actually a continuation of its work with Chainlink and 12 other financial institutions on blockchain interoperability, specifically through Chainlink’s Cross-Chain Interoperability Protocol (CCIP). 

This protocol helps connect Swift member banks to public and private blockchain networks, easing the settlement of tokenized assets.

Rynes emphasized that there was no reference to XRP in Swift’s update. Instead, the report highlights the continued collaboration with Chainlink, suggesting that the XRP community may be reading too much into the publication.

Furthermore, he criticized the XRP community for being “stuck in an echo chamber,” getting overly excited about minor mentions and outdated proof-of-concepts while institutions are openly working with Chainlink.

Rynes also poked fun at the XRP community’s reaction, saying they are “instinctually reacting to a word they see like preprogrammed non-player characters,” implying that they are responding to superficial cues rather than the actual content of the report.

Ethereum Founder to Only Discuss Stage 1+ Layer 2 Projects Starting Next Year

0

Ethereum Co-Founder Vitalik Buterin recently announced a shift in his approach to discussing Layer 2 (L2) projects. 

Starting next year, he plans to publicly mention only those projects that have achieved at least stage 1 decentralization. This decision is intended to maintain the ecosystem’s standards and ensure that the projects highlighted have reached a certain maturity.

Buterin emphasized that, despite his personal investments or connections, his future discussions will focus on L2s that have met specific benchmarks, allowing a short grace period for new projects that show genuine promise.

In a statement shared on X, Buterin clarified his criteria for recognizing L2s, noting that several zero-knowledge (ZK) rollup teams have indicated they expect to reach stage 1 by the end of the year.

He expressed enthusiasm about the progress of these projects, signaling a move towards cryptographic security and trust in the Ethereum ecosystem. His updated stance aligns with his vision of ensuring that rollups are more than just multisigs, but rather, cryptographically secure systems that uphold user trust.

Buterin’s Definition of Stage 1 Rollups

Buterin outlined the specific requirements for a project to be considered a stage 1 rollup. These include the need for a 75% threshold on the council to override the proof system, with at least 26% of the council members coming from outside the rollup team.

He stressed that the shift to stage 1 is a moderate but necessary milestone to ensure the security of the proof systems without rushing to remove the “training wheels” prematurely. 

Furthermore, Buterin updated the community on the multisigs projects in which he is involved, noting that he has not witnessed any significant issues in recent years. 

End of Rollups as Multisigs

Vitalik Buterin also declared the end of the era where rollups functioned primarily as multisigs, indicating that it is now time for cryptographic trust to take center stage.

Meanwhile, his comments follow recent discussions about his involvement with L2 tokens and the sale of his ETH holdings. While some have raised concerns about these sales, Buterin clarified that the latest sale was executed automatically through a pre-set cowswap twap order, established on August 29.

These developments also come amid ongoing discussions about Ethereum’s market performance, with some analysts predicting another consolidation phase. However, despite the market uncertainty, Buterin’s sustained optimism regarding Ethereum’s future syncs with the growing bullish sentiment among its community.

Solana Dump? FTX Set to Sell 177,693 SOL After Unstake

0

Bullish sentiments around Solana remains intact as an FTX/Alameda-tied wallet unstakes $23.75 million worth of SOL.

Solana experienced a period of increased selling pressure after the FTX implosion, as the defunct exchange had a large share of the “Ethereum killer.” Although FTX and Alameda have sold most of their SOL holdings, an address tied to the US-based crypto venture holds a substantial amount of Solana.

Per Solscan, a wallet address tied to the defunct exchange unstaked 177,693 SOL, worth nearly $24 million, late Wednesday. Although the wallet has not moved the funds to a centralized exchange, speculations of an impending sale have circulated within the crypto community.

Is FTX Dumping Solana?

Notably, market participants typically send their tokens to exchanges for selloffs after unstaking them. As a result, FTX’s unstake of $23.75 million worth of Solana has come as a caution to asset holders.

A more concerning detail of the latest transaction is that the 177,693 SOL was a minute portion of what the address “H4yi… agFZ” holds. Data from Solscan shows that the FTX/Alameda-tied wallet has a staggering 7.1 million SOL ($953 million) staked.

Notably, the amount of SOL held by the address accounts for 1.5% of the asset’s circulating supply. An unlock and sales of such a considerable amount of Solana would have huge market implications on the asset’s price.

For context, Ethereum and the broader market saw significant price capitulation when Jump Trading started selling its Ether stakes. The trading platform sold over $400 million worth of Ethereum in a few weeks, causing Ethereum’s price to fall below $2,336 in early August.

Solana Unperturbed

Meanwhile, the growing speculations have nothing on Solana, as it maintained a bullish stance. SOL is up 2.5% in the past 24 hours, trading at $135.26 at the time of writing.

This trend could be tied to unswayed bullish sentiments around the asset. With the Breakpoint hype and a broader cryptocurrency rebound in view, the Solana community has remained bullish on the asset. 

Per CoinMarketCap, the community votes showed a 77% bullish sentiment around the asset. Solana has the bullish community stance among the top five crypto assets, with Ethereum and Bitcoin having bearish sentiments.

Expert Says XRP FUD is a Strategy to Keep Retail Investors Away from Low Prices

0

Prominent crypto expert NotFinancialAdvice (NFA) suggests that the FUD surrounding XRP and Ripple could be part of a strategy to prevent retail investors from purchasing XRP at low prices.

According to a short clip posted on X yesterday, the market pundit noted that he no longer believes in FUD (Fear, Uncertainty, & Doubt) surrounding XRP and Ripple. 

Persistent FUDs Targeting XRP and Ripple 

Like many cryptocurrencies, XRP has received its fair share of FUD. Over the years, multiple commentators have circulated different narratives about the coin, which some believe is an attempt at manipulating market sentiment. 

Earlier this year, pro-XRP lawyer Bill Morgan highlighted three persistent FUDs circulating within the XRP community.

They include the XRP price suppression theory, the suggestion that XRP has no legal clarity, and the idea that Ripple’s stablecoin (RLUSD) could make XRP irrelevant. These FUD narratives have gained momentum within the community despite moves to debunk them.

FUD Appears Staged 

Interestingly, NotFinancialAdvice said he is not distracted by this FUD, as it could be a broader strategy to manipulate market sentiments. According to him, some powerful entities might introduce these narratives to prevent retail investors from purchasing XRP at low prices.

Explaining the rationale behind this assertion, the expert mentioned how some entities leverage social media to socially engineer people with artificial narratives. 

“[…] Certain narratives we perceive as naturally occurring could be part of an overall strategy,” he remarked. 

Moves to Discourage Retail Investment and Give Control to Institutions

Notably, the expert said Ripple holds significant potential in the future of digital payments, adding that the company also has several influential partners, such as the International Monetary Fund (IMF) and the United Nations (UN). 

Given Ripple’s potential in digital payments, NFA suggests that it is probable that powerful entities might create FUD to control the public’s perception of XRP and prevent retail investors from buying the coin at discounted prices.

“Many of these [narratives] feel artificial or designed to discourage retail investors from buying this chosen token at a low price by introducing ideas engineered to cause uncertainty,” he added.

While the FUD discourages retail investment in XRP, it maintains institutional interest in Ripple’s technological potential in the long term. 

This notion suggests that as these powerful entities discourage retail investors from purchasing XRP, they could secure more control over the token. 

Chartist Expects XRP 42,140% Rise To $227: Here’s Why

0

A market analyst, CryptoBull, shares an analysis of XRP, forecasting a potentially significant breakout from its persistent symmetrical triangle formation. 

Notably, XRP has historically followed similar patterns across past cycles, and CryptoBull anticipates a massive price rally. Based on chart patterns dating back to 2013, the analyst projects XRP’s value could skyrocket by a nassive 42,140%.

XRP’s Initial Symmetrical Triangle 

An accompanying 1-month XRP chart shows two symmetrical triangles formed over the years. The first began in 2013, when XRP hit the then all-time high (ATH) of $0.0614 in December of that year. Following this peak, XRP experienced a severe price correction, falling as low as $0.00281 by July 2014. 

XRP Monthly Symmetrical Triangles CryptoBull
XRP Monthly Symmetrical Triangles | CryptoBull

This correction initiated a symmetrical triangle that lasted for about 38 months. From late 2013 to early 2017, XRP’s price consolidated as it established higher lows and lower highs. This signaled that a breakout was on the horizon.

Interestingly, in March 2017, XRP finally broke out of the triangle. The breakout led to a parabolic price surge that culminated in XRP’s January 2018 ATH of $3.31. Notably, this price represented an astonishing 110,233% increase from its floor price in January 2017.

XRP Forms a Second Triangle

Following the peak in January 2018, XRP again experienced a steep decline. This ensuing retracement marked the beginning of the second symmetrical triangle. 

Unlike the first triangle, this current formation has persisted for over 80 months and is still active. XRP’s price movements have continued to follow the pattern of higher lows and lower highs. Notably, it has failed to breach the upper trendline of the triangle.

Despite the extended consolidation, CryptoBull believes a breakout is imminent. The current setup closely mirrors the conditions leading up to the 2017 breakout. This has led the market analyst to anticipate another dramatic price surge, with a primary target of $227.

XRP to $227: Feasible or Overly Ambitious?

Interestingly, multiple market analysts have predicted an imminent breakout from this symmetrical triangle. However, their targets for when the breach occurs have varied. CryptoBull’s $227 goal is one of the most ambitious.

Despite this projected target seeming far-fetched at first glance, historical data confirms XRP’s potential. In 2017, XRP’s price skyrocketed from $0.003 to $3.31, achieving a much greater 110,233% gain. 

However, CryptoBull’s forecast of a 42,140% surge, while lower in percentage terms than the previous rally, is a more challenging task due to XRP’s current market structure.

This is because a move to $227 would require a massive influx of capital into XRP. With a circulating supply of 56.3 billion tokens, XRP’s market capitalization would reach an astronomical $12.78 trillion if it hit the projected target. To put this into context, the entire crypto market valuation currently stands at $2.02 trillion.

The significant hurdle for XRP in achieving this $227 target is liquidity and market cap limitations. At press time, XRP trades for $0.5374, down by more than 3% over the past seven days.