Home Blog Page 1255

Analyst Predicts a Huge Bitcoin Pump to $83,000

0

The Bitcoin market could be poised for a rebound as a notable market analyst predicts an impending surge to a new all-time high.

Bitcoin’s recent downtrend may be short-lived, as analyst Mikybull has indicated an underlying market surge. According to him, Bitcoin may rally to a new all-time high above the $80,000 mark, placing bulls in full command of the market.

The largest crypto asset has seen a notable 3% rally in the past 24 hours and a 7.5% recovery from the $52,859 low seen on September 6. However, Mikybull Crypto has tipped it to continue this uptrend, citing a bullish pattern its higher time frame.

Per a Tuesday tweet, Mikybull Crypto posted a 2-day BTC/USDT pair chart showing a head-and-shoulder reverse pattern. The analyst’s chart showed that Bitcoin might be headed for $83,000, a new all-time high, if it continues on its current path.

Bitcoin Reverse Head and Shoulder Pattern

Market Recovery?

Mikybull Crypto’s Tuesday analysis correlates with his earlier assertion of an impending breakout from a bullish diamond formation seen on Bitcoin’s 8H time frame yesterday. The rally from the bullish pattern would see Bitcoin hit $83,387, a similar price target to his predictions today.

Bitcoin Diamond Formation

An upsurge to $83,000 would break veteran trader Peter Brandt’s $73,300 price target for a flip in market sentiment. According to an earlier report from The Crypto Basic, Brandt stated that Bitcoin needs to break its previous all-time high to notify his megaphone pattern and set the bull run back on track.

Notably, Bitcoin’s price seems to follow analyst Michael Van De Poppe’s predictions. He speculated the dump to $54,300 and a rebound to $57,3000, precisely what Bitcoin has done in the past few days. The veteran, however, warned that a rejection from the resistance at the $57,300 level would see Bitcoin test lower prices.

Bitcoin was rejected at $58,041 earlier on Tuesday but continued to trade above $57,000 at the time of writing. BTC traded at $57,041, with a 45.8% surge in its trading volume in the past 24 hours. Most of its volume was from centralized exchanges, as about $33.76 billion in Bitcoin was traded on CEX and a mere $100 million on DEX.

Experts Predict Bitcoin May Surge to $245K by Q4 2025 Amid Post Halving Trends

0

Bitcoin price has consistently shown crucial movements in relation to its halving events, and analysts continue to track its behavior as the next run approaches.

According to a recent analysis by Rekt Capital, Bitcoin’s previous cycles have exhibited a trend of reaching a peak 518 to 546 days after the halving. If this trend persists, Bitcoin’s peak in the current cycle could occur between mid-September and mid-October 2025.

He asserted that historical patterns suggest that the more Bitcoin consolidates after the latest halving, the stronger the synchronization with past cycles, which may lead to substantial upward movements.

Historical Comparisons to Previous Cycles

Previous Bitcoin halving cycles, particularly in 2015-2017 and 2019-2021, showed similar timelines for price peaks. The 2015-2017 cycle saw Bitcoin reach its peak 518 days post-halving, while the 2019-2021 cycle took slightly longer at 546 days.

Rekt Capital suggests that if the current cycle mirrors these historical patterns, the next price peak could materialize within a similar timeframe. However, Bitcoin has accelerated by 84 days in this cycle, which could influence its price trajectory, although the overall timing is still aligned with traditional expectations.

This ongoing consolidation, which has so far triggered investor angst, could benefit the price, allowing it to resynchronize with historical trends.

Volume Trends and Price Action in 2024

Rekt Capital’s chart also notes Bitcoin’s volumes during previous periods. In 2016, the trading volume reached approximately 5.294 million BTC, while the 2020 cycle recorded slightly lower figures of 3.466 million BTC.

Currently, volume for 2024 remains lower at 287.592 BTC. The lower volume levels suggest that the market may not be overheated, providing further room for upward movement.

Rekt Capital expects Bitcoin to potentially reach $245,000 by mid-September or mid-October 2025 if historical patterns hold and volume picks up in the coming months.

Market Forecasts from Other Experts

Other market commentators have also weighed in on Bitcoin’s potential trajectory. Despite recent volatility, with Bitcoin’s previous drop to $53,000 and a rise later, there remains optimism in the market. 

For example, well-known cryptocurrency influencer Ben Armstrong has forecasted a price target of $146,641 for Bitcoin, though his projection is not tied to specific analytical models. Armstrong’s target coincides with predictions that the U.S. presidential election may influence Bitcoin’s trajectory, potentially leading to significant movements in 2025.

Fantom (FTM) Eyes $0.50 Breakout: Can It Surge to $0.76 in the Ongoing Bull Run?

Will Fantom (FTM) continue the three-day bullish run by surpassing the $0.50 psychological barrier for a breakout run to $0.76?

Fantom starts a fresh recovery run with the broader market recovery and is ready for a breakout run. However, the uptrend faces crucial resistance and is ready for a massive surge ahead. Is this breakout run possible?

Fantom Nears Falling Channel Breakout

With an 11% jump in the last 24 hours, the Fantom token trades at $0.4905. Accordingly, its valuation now stands at over $1.367 billion, ranking it the 51st  biggest crypto asset in the market. 

In the daily chart, the FTM price reveals a solid resistance trendline, keeping the bearish influence intact. However, with the presence of a declining support trendline, the Fantom price action reveals a falling channel pattern.

Fantom price Chart
Fantom price Chart

In the ongoing bull cycle, FTM struggled to maintain dominance above the 100-day EMA, leading to a pullback from late August. This correction, occurring between August 26 and September 6, saw a 29% decline from $0.5229 to $0.3702.

However, the market showed a positive reversal last weekend, with FTM rebounding by 31.02% and forming a triple white soldier pattern, signaling renewed bullish momentum.

Crypto Rand Highlights Fantom Breakout Run 

Amid the recovery rally, Crypto Rand, a known trader and investor behind RR2 Capital, recently tweeted about the FTM breakout. He noted that FTM has breached the local downtrend resistance, following a bounce and the formation of a new higher low.

This higher low has contributed to the triple white soldier pattern mentioned earlier. Additionally, the stochastic RSI on his chart indicates a positive trend, reinforcing the bullish outlook.

Will Fantom Surpass $0.50?

Currently, Fantom (FTM) is trading at $0.4848, testing the 23.60% Fibonacci level at $0.49. The price is also challenging the 100-day EMA, having already surpassed the 20- and 50-day EMAs, though the latter two remain in a bearish alignment.

Despite this, recent bullish momentum has led to a positive crossover between the MACD and signal lines, suggesting an increased likelihood of a breakout rally.

Should FTM continue its upward movement, the next key targets based on Fibonacci levels are the 38.20% level at $0.6175 and the 50% level at $0.7181. On the downside, crucial support levels include the 50-day EMA at $0.43 and the psychological mark of $0.40.

Shiba Inu Wave 3 Ready for 10x Surge: Analyst Predicts New All-Time High

0

Technical analyst “Charting Guy” recently highlighted the potential for Shiba Inu to witness a massive price surge beyond its 2021 highs.

According to the analyst, Shiba Inu (SHIB) is mimicking Dogecoin’s price patterns, setting the stage for a breakout. Charting Guy expressed this sentiment in response to a community member’s inquiry about which altcoins have the potential to deliver a juicy 10-fold return soon. He suggested Dogecoin, XRP, and FET. 

The notable absence of SHIB from the list prompted a concerned Shiba Inu enthusiast to ask why Charting Guy often overlooks SHIB’s potential.

Shiba Inu Also has Potential for a 10X Surge

Responding to this query, the analyst highlighted that the outlook for Shiba Inu is as promising as it is for Dogecoin. He provided technical information to back his bullish sentiment on SHIB.

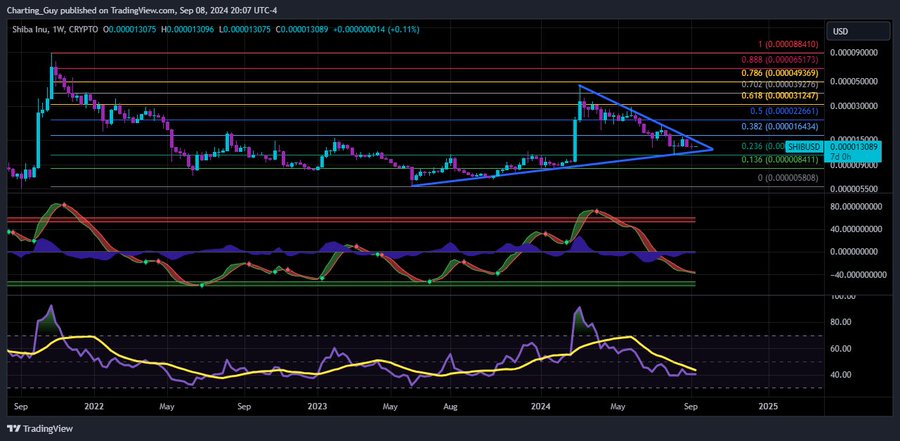
The analyst noted that SHIB recently faced rejection at the “golden pocket,” a critical Fibonacci retracement level between 0.618 and 0.65 that often serves as a resistance zone. This occurred when Shiba Inu returned to the $0.000031 to $0.000045 price range a few months ago.

Following this rejection, the analyst highlighted that SHIB has found strong support at the 0.236 Fibonacci level. This level aligns with Shiba Inu’s current price of around $0.000013. It suggests that the SHIB price may have stabilized around this area to continue its earlier upward trajectory. 

Shiba Inu Set to Take Out its ATH

Furthermore, the analysis noted that SHIB’s ongoing movement aligns with the classic wave 1 and 2 formation from Elliott Wave Theory, which describes alternating bullish and corrective phases.

With the first two waves now complete, the market could be setting up for wave 3, which historically tends to be the most powerful.

According to the analysis, this wave 3, if it plays out as predicted, could send Shiba Inu soaring past its all-time highs (ATH). Notably, Shiba Inu’s ATH is at $0.00008845 and it needs a growth of over 556% to surpass the threshold.

Charting Guy noted that not just Shiba Inu but many altcoins are showing similar patterns. He stressed that the anticipated bullish wave will be explosive, causing most altcoins to crack their previous ATHs.

Expert Explains How XRP Could Benefit from the Launch and Adoption of Ripple’s RLUSD Stablecoin

0

Ripple is rapidly advancing its plans to introduce its new stablecoin, Ripple USD (RLUSD), and this development could have profound implications for XRP. 

The stablecoin, backed by the U.S. dollar, is currently in beta testing on the XRP Ledger and Ethereum, according to Ripple’s official updates. Interestingly, some pundits have speculated that Ripple could be looking to replace XRP with RLUSD as the bridge asset for ODL transactions.

In response to this, Ripple CTO David Schwartz maintained that Ripple aims to allow the use of XRP in areas where it is optimal.

Potential Impact on XRP Utility

Notably, recent discussions suggest that while RLUSD’s launch could streamline cross-border payments and boost liquidity, some believe that XRP’s utility might also increase through its integration into these transactions.

In a commentary on X, crypto YouTuber Eri noted similarities between XRP’s role on the XRPL and how Ethereum’s ETH serves as a gas token. She stressed that, just as ETH is critical for Ethereum’s transactions, XRP plays a vital role as gas for transactions on the XRP Ledger.

According to Eri, RLUSD could bring trillions of transactions onto the XRPL Mainnet, covering multiple currencies. Remarkably, such a development is likely to boost the utility of XRP, being the gas token of the XRPL.

Importantly, she noted that Ripple’s On-Demand Liquidity (ODL) solution is “price neutral,” per disclosures from Ripple and documents in the SEC case. This means that ODL activities do not directly impact XRP’s price. Nevertheless, the increase in network activity could indirectly create more demand for XRP as a utility token.

This commentary triggered discussions. One community member asked Eri about earlier claims by former Ripple employee Bob Way, who suggested that market makers could raise XRP’s price by leveraging ODL volume for profit through fees and spreads. 

Eri clarified that the delivery model for ODL had significantly changed since those claims, signaling that the current iteration of ODL is focused more on efficiency than speculative price impact.

The Ripple Stablecoin

Ripple first announced RLUSD earlier this year, and the stablecoin is expected to launch in the next few weeks. Testing began on the XRP Ledger Mainnet and Ethereum, marking a major milestone in Ripple’s goal of expanding liquidity and institutional use cases. 

RLUSD seeks to provide stability by pegging its value to the U.S. dollar and is part of Ripple’s larger vision to facilitate more efficient cross-border payments. With regulatory approval still pending, Ripple is ensuring that RLUSD meets the highest standards of security before its public release.

Ripple’s focus on regulatory compliance sets RLUSD apart from other stablecoins like USDT, which have faced scrutiny. For instance, several exchanges such as Uphold have limited access to USDT on the back of MiCA.

While Ripple maintains that ODL does not directly affect XRP’s price, the sheer volume of transactions that RLUSD could bring to the XRP Ledger could enhance XRP’s role within the ecosystem. Increased usage of XRP for gas fees could lead to a rise in demand, which could positively influence the token’s market value over time.

This Data Suggests Solana Will Surge as the Breakpoint Event Approaches

0

Analyst speculates that a historical Breakpoint rally could see Solana trade at a 21-month high before the September 20 conference.

Bitcoin’s brutal underperformance spilled to Solana and the broader crypto market. The fifth largest crypto asset by market cap is now down over 15% from the $161 high seen in early August.

Solana’s gross price underperformance could metamorphose, as data has pointed to a catalyst to historical surges in the asset’s price. According to multiple analysts, the SOL price would see an uptick following the impending Breakpoint event.

The fast-approaching annual meeting has historically positively impacted the Solana price. Hence, analysts forecast that the altcoin could see higher prices in the days leading up to the event.

The BreakPoint Event

Following its in September 2021, the Breakpoint event has become a crucial meeting for the Solana ecosystem. The multi-day annual conference has allowed the Solana Foundation to commune with its community.

The event brings together the Solana team, key industrial players, developers, and the community to share knowledge and acclimate to the network’s latest and future trends.

This year’s event hosts notable speakers like Circle’s CEO Jeremy Allaire, SkyBridge managing partner Anthony Scaramucci, Jupiter co-founder Siong Ong, and Helius co-founder Mert Mumtax, among other professionals.

The event, set to happen between September 20 and 21 in Singapore, has historically coincided with historical SOL price surges. This year, market speculators and Solana proponents are placing their bets on a repetition.

Analyst Speculates 62% Price Uptick

According to MartyParty, Solana has surged at a yearly average of 62% on account of the Breakpoint conference. Further analysis showed that SOL grew 68%, 42%, and 58% in 2021, 2022, and 2023, respectively, catalyzed by the annual conference.

According to the data, the SOL rally started 19 days before the maiden Breakpoint event in 2021. In 2022, the upsurge waited three more days than it did the previous year, kicking off 16 days before the conference. However, 2023’s price rally started 14 days before Breakpoint, the latest so far.

Solana’s price showed bullish momentum in the past 24 hours, surging over 4% to trade at $135. If MartyParty’s 62% prediction is put into perspective, SOL has another 58% underlying rally. A 58% growth at market price would see SOL trade at $213.3 before the September 20 conference, a high last seen in December 2021.

Ethereum Price Risks 48% Crash to $1,200 as Wedge Formation Resembles 2019

0

Ethereum has faced challenges in recovering fully from its weekly lows, and historical performance suggests further downside risks. 

According to market analysts, the recent price structure shows similarities to past cycles, potentially leading to additional declines. Benjamin Cowen, the founder of IntoTheCryptoverse, provided an in-depth analysis that highlights a comparison between Ethereum’s wedge formation in 2019 and 2024.

Cowen suggests that Ethereum might experience a breakdown similar to 2019, potentially leading to a fresh bottom.

Ethereum’s Wedge Formation in 2019 and 2024

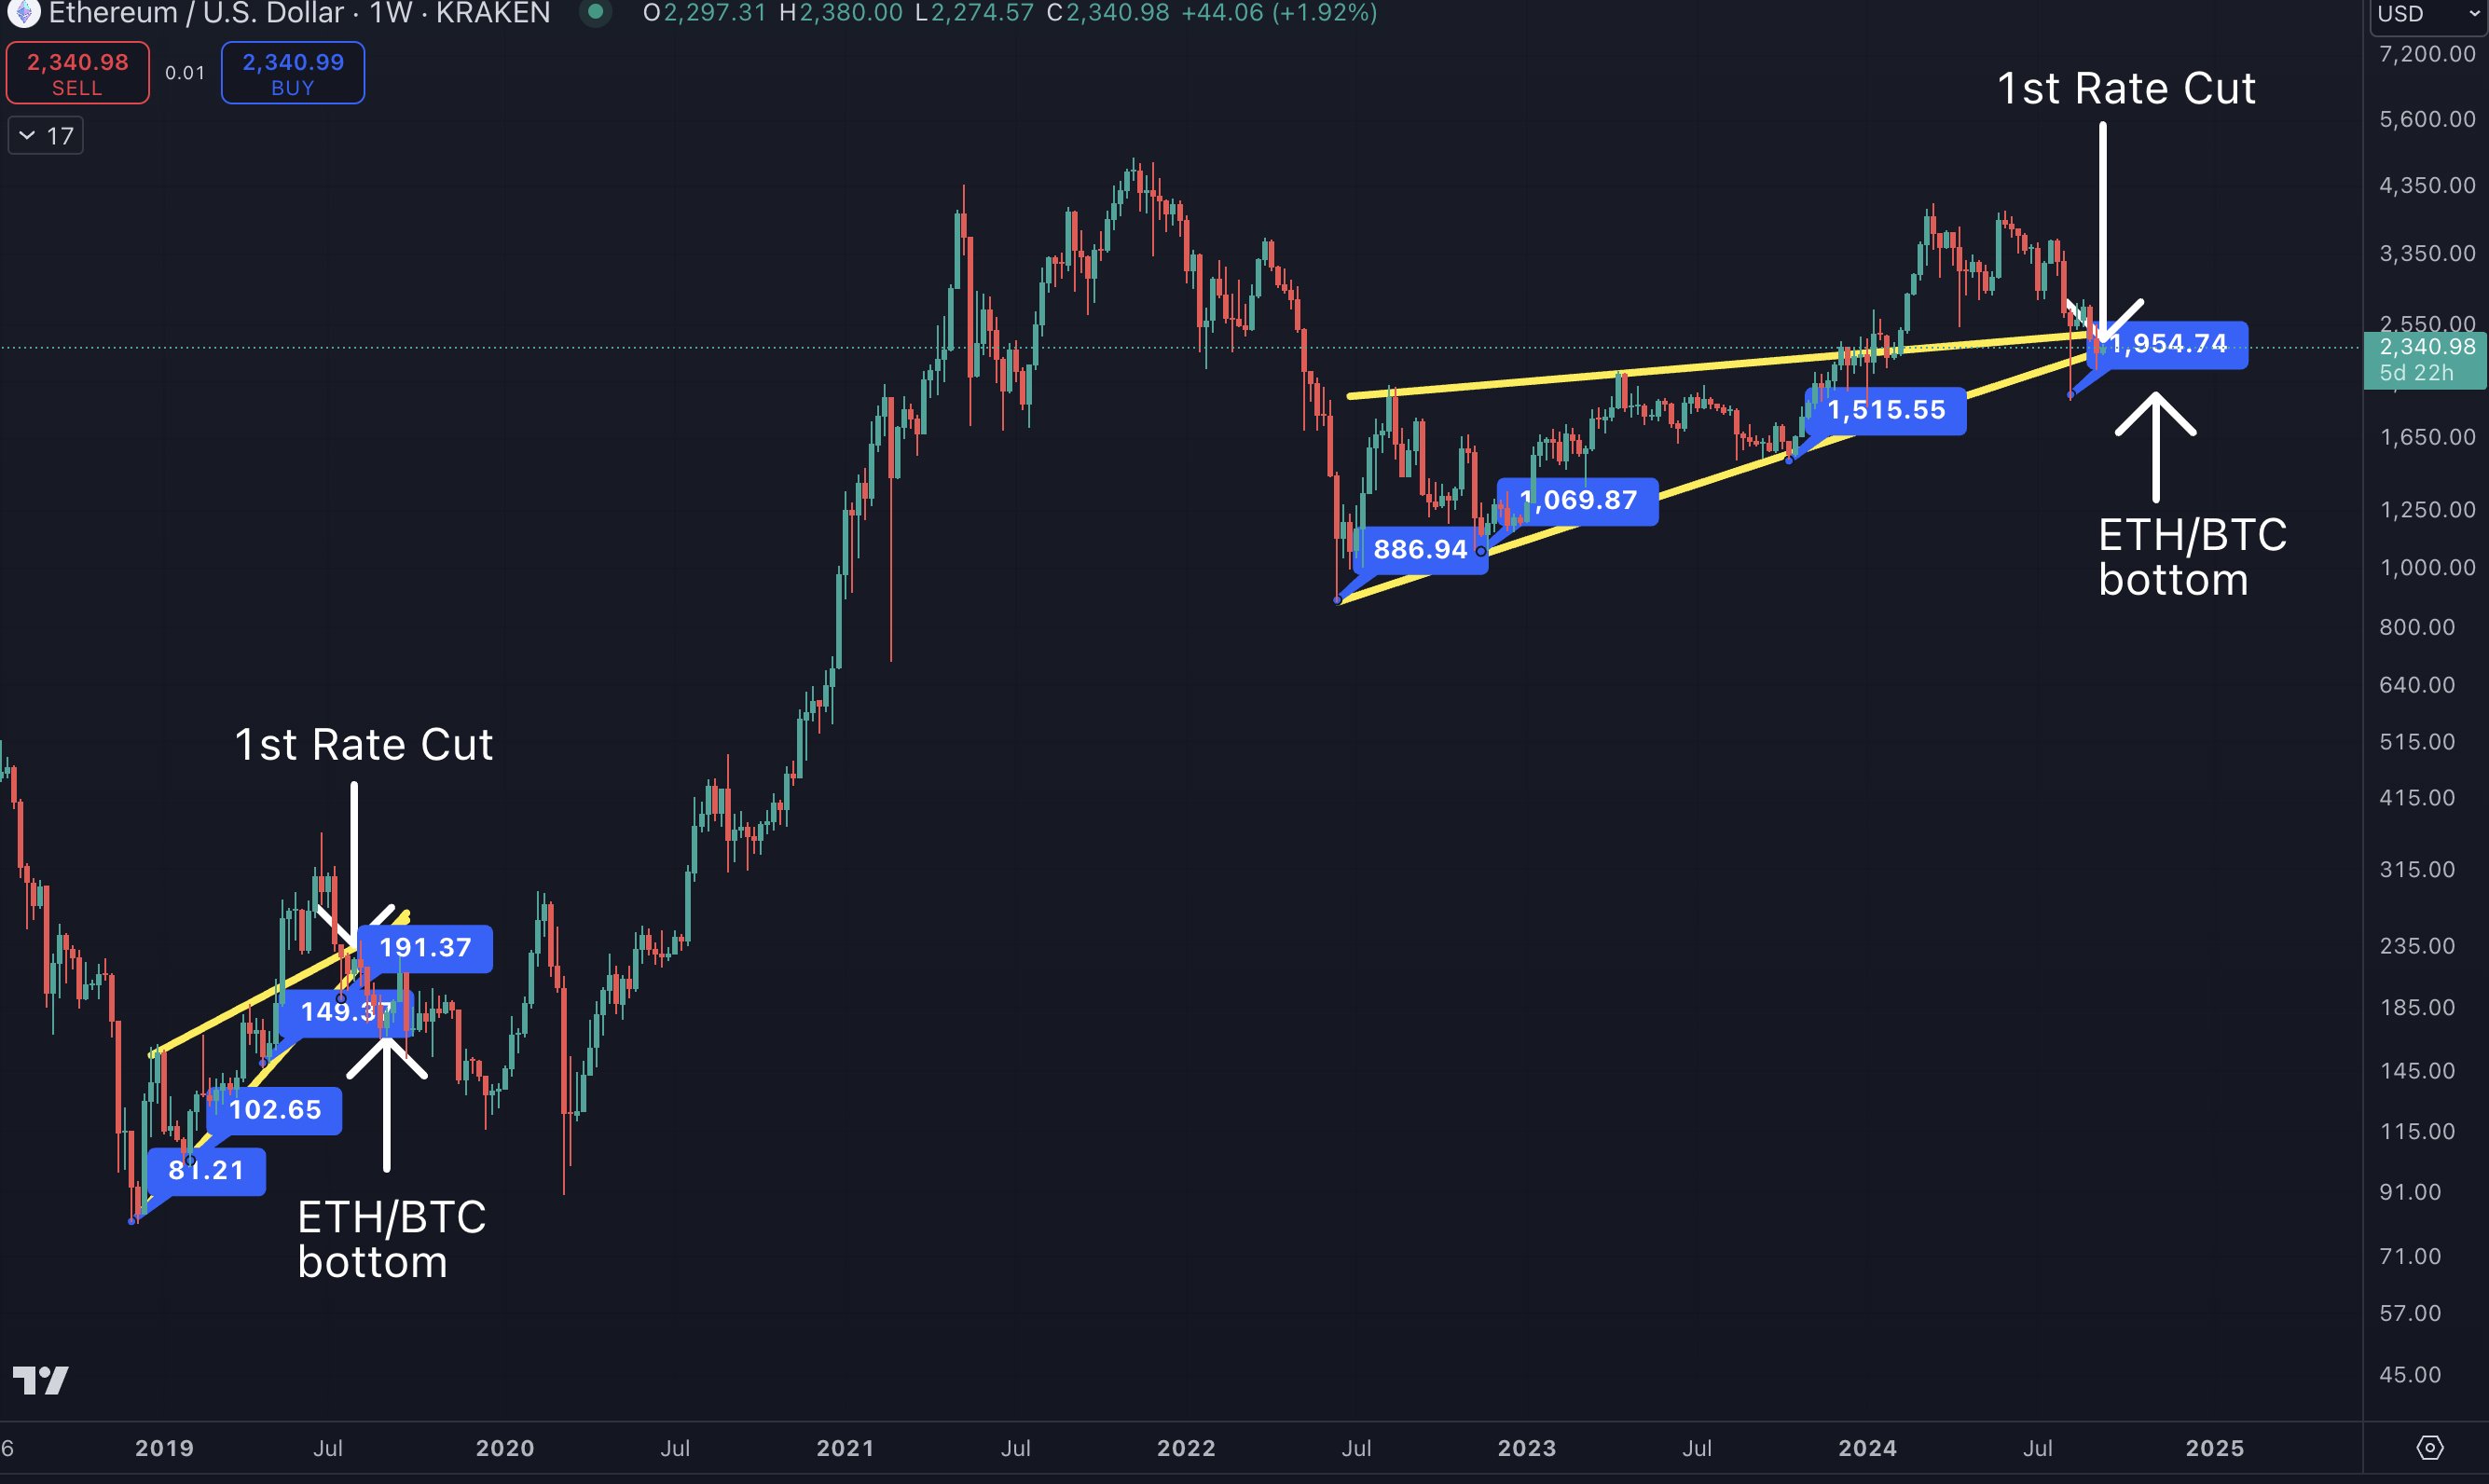
For context, in 2019, Ethereum formed a wedge pattern, where prices steadily made higher lows. Key levels noted include $81.21, $102.65, $149.31, and $191.37.

The wedge structure preceded a significant decline, with Ethereum falling back into the pattern before the Federal Reserve’s first rate cut in 2019. Following the rate cut, Ethereum dropped below the wedge, which led to further price declines before the ETH/BTC pair bottomed out. This marked the end of the downtrend, with Ethereum beginning a new upward trend after that.

Fast-forwarding to 2024, Ethereum has formed another wedge, albeit with significantly higher lows compared to 2019, according to Cowen’s analysis. The current cycle has seen lows at $886, $1,069, and $1,515, with the most recent level near $1,954.

Interestingly, Ethereum has fallen back into the wedge ahead of the anticipated 2024 rate cut, mirroring the 2019 pattern. This similarity suggests that Ethereum may break down below the wedge once again, potentially leading to further downward pressure.

Ethereum historical chart by Benjamin Cowen

Predictions of Further Downside Pressure

Benjamin Cowen has projected that Ethereum could see a fresh bottom near $1,200 by December 2024. This prediction is based on historical data from 2016 and 2019, where Ethereum experienced a 70% drop following similar market conditions. 

Cowen highlights the potential for Ethereum to reach a similar risk. He suggests that the $1,200 level could represent a soft landing for Ethereum before the market turns upward in the first half of 2025. 

Notably, ETH currently trades at $2,342; a drop to $1,200 would amount to a significant 48% crash.

Selling Pressure on ETH

Recent whale activities have added to the bearish sentiment surrounding Ethereum. On-chain data reveals that a foundation wallet recently transferred ETH valued at approximately $2.38 million to a multi-signature wallet.

Notably, this activity follows a previous transfer of 35,000 ETH worth over $94 million from the Ethereum Foundation to the Kraken exchange. The Ethereum Foundation’s continuous offloading of ETH tokens has fueled worries about the potential impact of these sales on the market’s future direction.

Dogecoin Spikes 8% as Elon Musk Says “Call Me Dogefather”

0

Dogecoin (DOGE) stages an impressive rally after Tesla CEO Elon Musk recounts his appearance on a comedy skit where he asked to be called The Dogefather. 

The American businessman discussed this experience during a recent episode of the All In podcast. For context, Musk featured in a short comedy show on Saturday Night Live (SNL) in 2021, explaining key features of Dogecoin.

The Dogefather 

In his recent appearance on the All In Podcast, the billionaire investor recreated a scene from the famous Award-Winning movie The Godfather with a Dogecoin twist. 

During the redo, Musk portrayed himself as the “Dogefather” while envisioning himself in a tuxedo and speaking like the famous Don Vito Corleone. 

Jason Calacanis, one of The All In Podcasts hosts, sets up a scenario in which someone asks Musk for Dogecoin instead of Bitcoin at his daughter’s wedding.  

Musk chips in, imagining the person asking for private keys. He questions whether the person is a true friend, emphasizing that he should be called The Dogefather.  

Dogecoin Spikes Over 8% 

Prior to Musk’s appearance on the All In Podcast, DOGE’s price had already skyrocketed 8.21% after the billionaire investor joked that the “Department of Government Efficiency” would use Dogecoin as its official mascot. This agency is the “task force” Musk is expected to head if Donald Trump wins reelection by November.  

Meanwhile, like other major cryptos, Dogecoin has not had it easy with the recent market downturn. Last week, Dogecoin’s price crashed from $0.09907 to a seven-day low of $0.08962. However, the DOGE price staged an impressive rally yesterday to recover its losses, skyrocketing to a daily high of $0.1046. 

At press time, DOGE is trading at $0.1034, up 8.02% over the past 24 hours. Dogecoin’s recent uptick indicates that Musk’s comments still have significant influence over the token. 

Recall that Musk was instrumental in the token’s remarkable rally to an all-time high of $0.7376. Musk’s appearance in the SNL skit and other support from the businessman contributed to driving the token to an all-time high on May 8, 2021. However, DOGE has slumped 85.97% from this peak.

XRP Finally Moves Close to a Major Squeeze: Here Are Possible XRP Targets

0

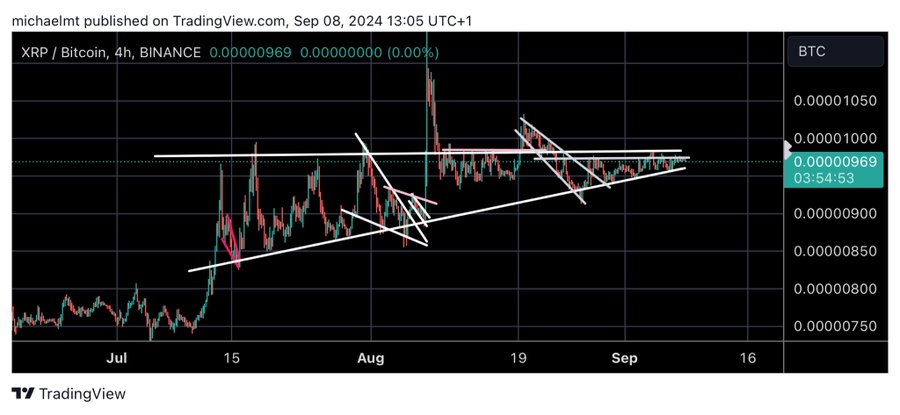
The XRP chart against Bitcoin suggests a potential major squeeze is on the horizon, and crypto analyst MichaelXBT has pointed this out in his recent analysis. 

Notably, in an accompanying chart, the market watcher drew out several significant patterns such as converging trend lines and wedge formations that XRP has formed against Bitcoin on the 4h timeframe. These patterns signal that XRP is near a moment of volatility.

MichaelXBT identified a series of descending triangles combined with symmetrical triangles that have formed since mid-July. The larger symmetrical triangle began when XRP recorded an impressive push against Bitcoin from July 10.

XRPBTC 4H Chart MichaelXBT
XRPBTC 4H Chart | MichaelXBT

Remarkably, the altcoin spiked 28% from 0.00000752 BTC to a peak of 0.00000962 within three days. Since then, XRP has been slowly recovering its lost grounds against BTC despite a slowdown in the upsurge. This has resulted in the formation of the upward symmetrical triangle.

Notably, the emerging trend lines indicate that XRP has been steadily testing resistance points while maintaining a long-term upward support trend. The analyst points to this as evidence of bullish sentiment brewing beneath the surface. 

Meanwhile, the market has remained relatively flat in terms of volume and volatility due to trader apathy amid uncertainty. However, the converging patterns on MichaelXBT’s chart signal the possibility of a big move ahead, with price action compressing into a narrow range. 

The analyst believes that these trends suggest that the “squeeze” is about to occur, leading to the possibility of a large price movement that could happen shortly once one of the key levels is broken. However, he failed to provide any price targets. 

Possible XRP Targets

Meanwhile, MichaelXBT has been vocal about his bullish stance on XRP in the past few weeks. According to his earlier statements, his primary target for XRP is around $2. 

He revealed plans to focus his strategy on maximizing profits from XRP’s expected rise and then rotating the gains into other altcoins for further portfolio diversification. 

However, XRP has been stalled at the resistance line for an extended period, which Michael refers to as the “7-year pennant resistance.” This level has historically prevented further upward movement for XRP, but the analyst remains confident that a major breakout is imminent. 

He suggested that when this resistance is finally breached, the price surge will be swift and sharp—fast enough that many investors may miss the move if they don’t act quickly.

Recently, Michael noted the importance of the $0.62 level for XRP. He believes this is the critical resistance zone that, when broken, will activate an XRP rally.

Currently, XRP changes hands at $0.5366, having increased 1.4% over the past 24 hours. It also trades for 0.00000944 BTC, a 25% increase from the July 5 low.

Finance Veteran Says XRP is a ‘Slave Coin,’

0

Financial pundit and well-known Bitcoin advocate Rajat Soni has again voiced strong opposition to XRP, calling it a “slave coin.”

His comments come in response to dated claims that XRP could be adopted by banks globally for various financial purposes. However, Soni believes this prospect would further centralize financial power.

Why XRP is Branded “Slave Coin”

Soni’s critique focuses on XRP’s association with Ripple, which partners with governments and financial institutions for Central Bank Digital Currencies (CBDCs) initiatives. He argues that CBDCs would give central banks more control over individuals’ wealth.

For Soni, this represents a threat to financial freedom. “CBDCs are going to be used to enslave us, and the XRP army wants you to support that agenda?” he said.

In contrast, Soni advocates for Bitcoin as a decentralized alternative to XRP and CBDCs. He sees Bitcoin as a solution that empowers individuals by moving away from the control of large institutions and central banks. 

While XRP has been lauded for its potential to facilitate faster cross-border payments, critics like Soni warn that this convenience may come at the cost of further entrenching the power of centralized financial systems.

Notably, Soni is among the longstanding XRP critics who have continuously branded the token a scam coin. In an earlier critique, he argued that banks would prefer Bitcoin over XRP and falsely claimed that Ripple Labs created XRP, “making it centralized.”

He predicted that XRP would become “worthless” if banned in the U.S. and criticized its limited global adoption.

Soni’s latest remarks extend his criticism of XRP, which he now describes as a “slave coin.” He believes that many individuals hold XRP in the hope that banks will adopt it, but he considers this hope to be misguided.

“Never Buy XRP”

Interestingly, Soni is not the only prominent figure in the Bitcoin community who has recently directed criticisms at XRP. In a separate conversation on X, “Sensei BTC” stressed that  Bitcoin outperforms XRP in price performance. A comparison of recent price actions supports this observation.

In the last 24 hours, Bitcoin has risen by over 4%, whereas XRP has only increased by 1.5%. Over the past year, the disparity has been even more pronounced, with Bitcoin gaining 34% and XRP falling by 12.75%.

Accordingly, Sensei advised newcomers to the crypto world to avoid buying XRP, labeling it a “shitcoin.”

However, it is worth noting that XRP proponents have consistently disputed these critiques from Bitcoin maxis. The Bitcoin and XRP communities have long been at odds.