Home Blog Page 1265

Ethereum Founder Unlocks 1.268 Million STRK Worth $470,000

0

Vitalik Buterin unlocks 1.268 million STRK tokens worth $470,000.

Ethereum founder Vitalik Buterin recently unlocked 1.268 million STRK tokens. The unlocked tokens are worth $470,000. This transaction occurred at 13:15 UTC+8, marking a substantial increase in Buterin’s holdings of STRK tokens.

Following this event, Buterin’s total STRK holdings have crossed 2 million holdings, worth an estimated $781,000. This makes STRK the most valuable asset in his portfolio outside of Ethereum, reflecting his early involvement in the Starknet project as an investor.

This token unlock is part of Buterin’s ongoing activity, which has caught the attention of the crypto community. Prior to this, several tokens, including OMKAM, PIKA, ETH, DIMO, and POKT, were moved between various wallet interacting with his addresses.

Wallet names such as “OpenSea User,” “bogged.eth,” and “pikaboss.eth” appeared repeatedly in these transactions.

Top Holdings in Buterin’s Portfolio

Vitalik Buterin’s portfolio currently holds 240,171 ETH, valued at $575.05 million, despite a recent drop in Ethereum’s price to $2,394.33.

Vitalik Buterin Holdings

This decline led to a $26.61 million net loss in the asset’s value. STRK, priced at $0.38, forms a smaller portion of the portfolio but has shown a slight price gain, adding $14.04K to its total worth.

Other holdings, such as 869,509 KNC (Kyber Network Crystal), have experienced a minor loss, with the token’s value decreasing by $15.08K after a small price drop to $0.43.

Increased Activity Raises Questions

Buterin’s Ethereum address has displayed increased activity in recent days. Notably, he transferred 800 ETH, valued at $2.01 million, to a multi-signature wallet on the same day.

Following this transfer, 190 ETH were exchanged for 477,000 USDC. This transaction follows several earlier transfers, including one on August 9, when 3,000 ETH worth $8.04 million was moved to the same multi-signature wallet.

The crypto community continues to speculate about the purpose of these movements, with some questioning if the transfers indicate charitable donations, internal reallocations, or other intentions.

Buterin has previously stated that he has not sold ETH for personal profit since 2018. Instead, his ETH transactions are mostly linked to donations. Most recently, Buterin donated $530,000 worth of “Animal Coins” to charity, following requests from the community after he liquidated his portfolio of “NEIRO on Ethereum” tokens.

Binance to Debut Solana-based Staking Token in September

0

Binance plans to launch the liquid staking token BNSOL later in September, redefining staking on centralized exchanges.

Leading cryptocurrency exchange Binance has announced it will launch its Solana-based staking token (BNSOL) by the end of September. The wrapped token will be issued to users who intend to engage their Binance-staked Solana in other on-chain activities.

Upon staking the Solana, users can mint BNSOL from Binance while still earning the percentage remuneration for the value of their staked SOL token. These liquid staking tokens could be used in the same vein as the staked SOL and can be sold, lent, or traded on Binance and any other decentralized platform that adds support for BNSOL.

Binance is one of the first exchanges to issue a liquid-staking version of Solana. The product mimicked the Ethereum version that the leading staking platform, Lido Finance, issues to users who stake ETH with them.

Binance to Enhance Staking

The venture is part of Binance’s quest to enhance SOL staking on its platform. The leading exchange aims to provide options and flexibility to investors who wish to stake Solana on its platform.

Vishal Sacheendran, Binance’s head of regional markets, noted that the new staking mechanism outweighs the traditional system. He said that, unlike the native staking method, users could still earn rewards while possessing liquidity to carry out on-chain activities on the platform and other protocols where they are accepted.

Binance will calculate the earnings on the SOL stake with a dynamic annual percentage rate (APR), which is adjusted in real time to correlate with the staking commission and the value of BNSOL to SOL. The platform will also allow users to redeem their tokens anytime, depending on the redemption waiting period.

Furthermore, Binance noted that it designed the BNSOL through its Stake Pool Program, which is managed by Binance Labs. The exchange stated that notable liquid staking token (LST) providers have tested the reliability of their stake pool several times.

Binance’s BNSOL is a testament to the relevance of the Solana network and its native token, SOL, in the crypto space. Last week, Robinhood wallets expanded to the blockchain, hosting the fifth-largest cryptocurrency by market cap.

However, Solana’s latest traction is yet evident in its price as the asset continued trending downwards amidst a wider market capitulation. At the time of writing, SOL traded at $128, down over 4% in the past 24 hours.

XRP Looking Like a Treat, Says Top Analyst as This Breakout Nears

0

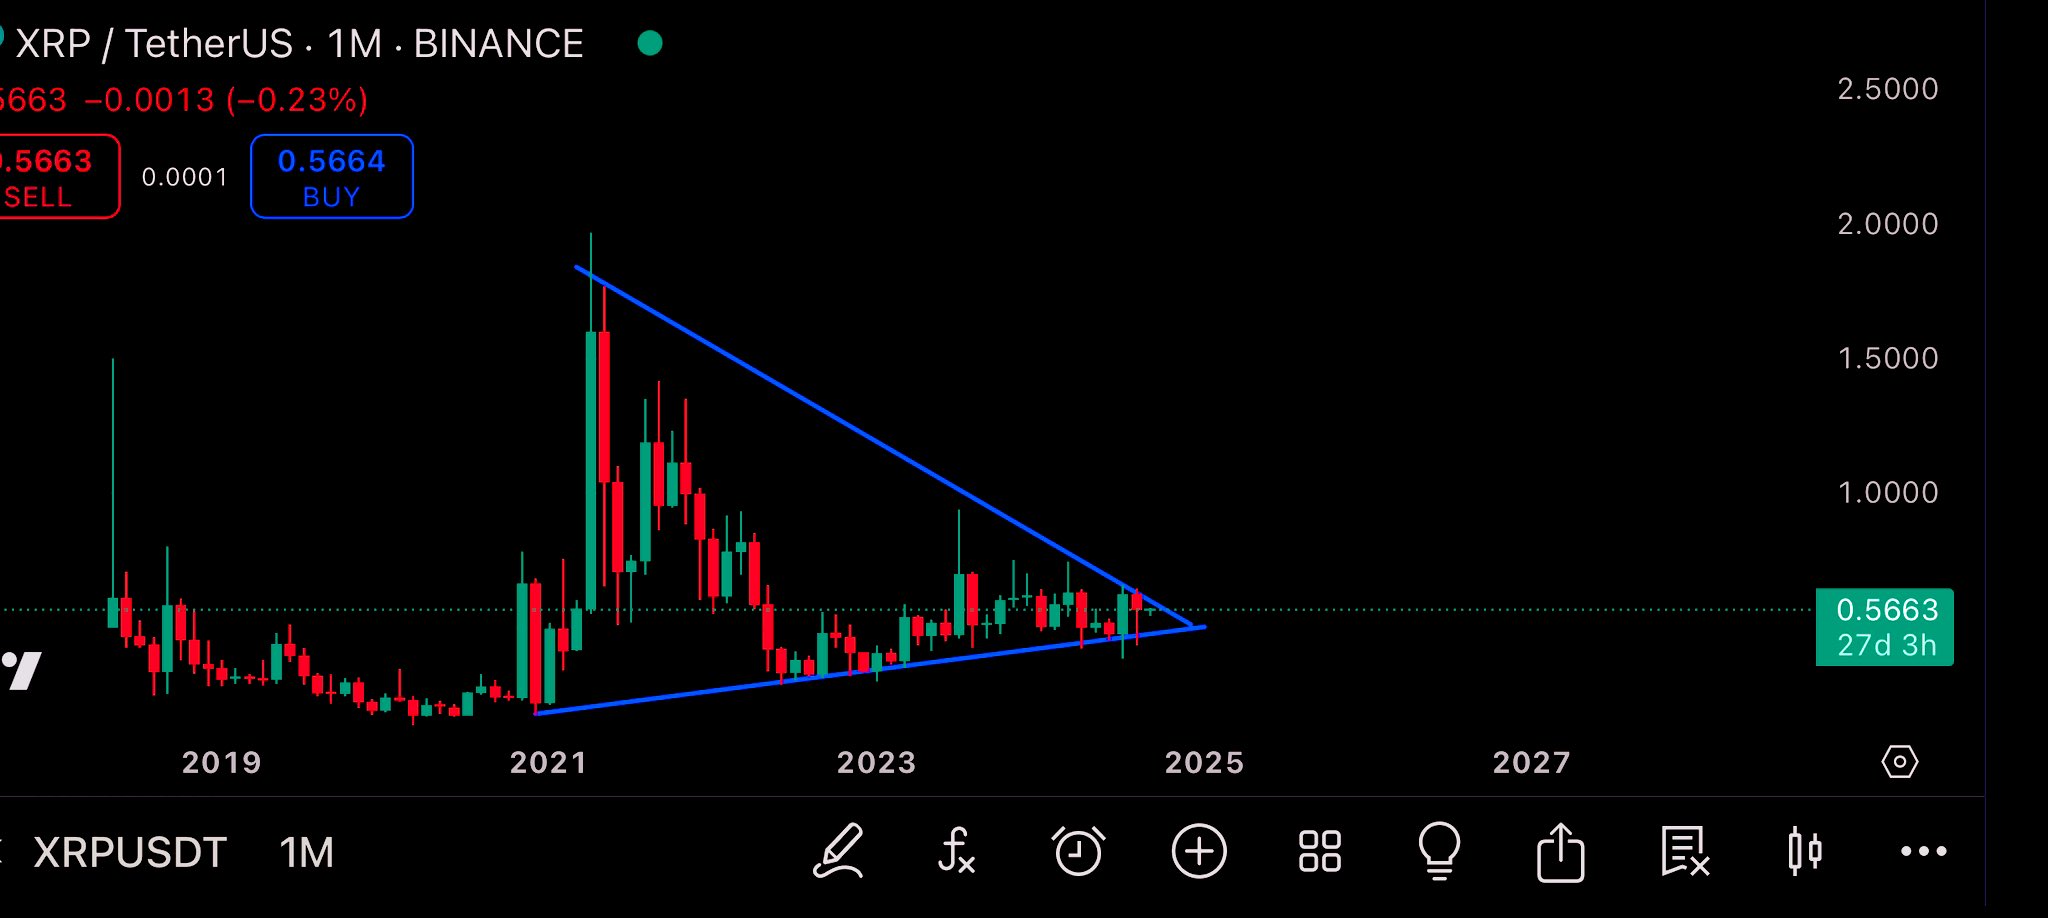
XRP has continued to garner attention in the crypto community as it forms a classic symmetrical triangle pattern on the monthly chart, with prospects for an explosive upside move. 

Crypto analyst Mr. Xoom recently highlighted this formation, noting that XRP’s “coiling” action could soon lead to a significant return on investment. The analyst described XRP as “looking like a real treat,” pointing to the technical setup that has been developing since the asset’s 2021 peak.

The commentary featured a symmetrical triangle pattern XRP formed since its 2021 bull run. The formation is characterized by a narrowing price range due to lower highs and higher lows. Analysts have emphasized that this configuration often precedes significant market moves.

XRP chart by Mr. Xoom

Should XRP break above the upper trendline of the triangle, it could trigger a bullish rally, potentially driving the cryptocurrency to new highs. Conversely, a break below the lower trendline could signal a bearish downturn.

Mr. Xoom’s latest update follows a post from two weeks ago, in which he discussed how XRP’s historical chart shows that the tighter the coil, the more substantial the potential returns for steadfast holders. However, the analyst did not provide specific price targets for this potential move.

Market Participants Not Optimistic about XRP

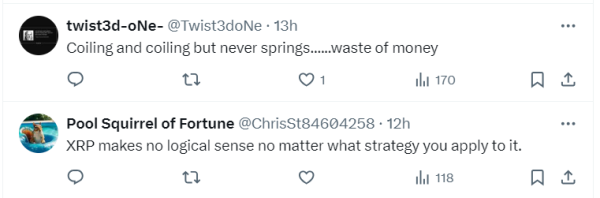
However, market participants reacting to the latest update do not share the analyst’s optimism in XRP. A few users on X have expressed skepticism about the symmetrical triangle pattern’s validity and the likelihood of a significant breakout.

One user questioned the legitimacy of the pattern, arguing that the lines drawn to form the triangle do not accurately touch the wicks or candle bodies. Another user expressed frustration, suggesting that while XRP has been “coiling” for a long time, it has yet to deliver the promised gains, calling it a “waste of money.” 

Others echoed similar sentiments, noting that XRP’s performance has been disappointing, and it remains difficult to predict its future based on any strategy.

Community reactions
Community reactions

These pessimistic commentaries emerged considering XRP’s performance for most of this year. Today, XRP is trading at $0.5497, down 4% over the past week. On a year-to-date scale, XRP is down 12%, while some of its competitors post over 50% gains. 

Moreover, XRP last created a new ATH seven years ago. As a result, market participants are increasingly less optimistic about its prospects despite the hype around the token.

Shiba Inu Price Prediction: 56% Upside to $0.00002050 Likely as Falling Wedge Pattern Emerges

0

Shiba Inu (SHIB) shows early signs of a potential breakout after a prolonged downtrend. 

A falling wedge pattern has emerged in recent market data, suggesting a possible shift in momentum. This bullish reversal pattern, characterized by converging downward trendlines, indicates that SHIB may soon break above its current resistance levels. Currently, SHIB is trading near the lower end of this wedge, hinting at a potential upside movement as the pattern narrows.

Critical Support and Resistance Levels

The support level for SHIB sits at approximately $0.00001092, where buyers have consistently stepped in to prevent further declines. Above this, the first resistance is located at $0.00002054, marking the initial challenge if SHIB breaks the wedge pattern. 

SHIB/USDT Price Action

The next key resistance levels are at $0.00002755 and $0.00003505, each presenting significant barriers where SHIB could encounter heavy selling pressure. These resistance levels are important indicators for future price movements, particularly if the token manages to rally.

Shiba Inu is currently eyeing a potential breakout, with a target price set at $0.00002050, signaling a significant upside if the pattern holds. The meme coin would need to rise by 56.25% to reach the target price from its current price of $0.00001312. ​​

Increased Whale Activity 

On-chain data indicates a significant rise in large transactions involving SHIB, pointing to renewed interest from institutional investors. According to IntoTheBlock, the number of transactions above $100,000 surged to 45, up from a 7-day low of 34 transactions.

This increase signals growing confidence among large investors, with over 1.97 trillion SHIB changing hands, the highest volume seen since the start of September.

SHIB large transactions

This uptick in whale activity follows a recent dip in SHIB transactions, with just 696.5 billion SHIB transacted on September 1. Notably, the value of these large transactions reached $25.8 million in the past day, reflecting a decline from the $49.37 million recorded on August 30. However, the recent activity hints at a potential price rebound for SHIB.

Renewed Interest in Meme Coins

A recent report by The Crypto Basic highlights that the brief recovery in the broader crypto market has reignited interest in meme coins like Shiba Inu. With a market cap exceeding $7.7 billion, SHIB is now under close watch as traders anticipate a potential bullish breakout.

The report also notes that SHIB is still within a falling wedge pattern, with its price hovering just below key resistance levels. Any upward movement could see SHIB testing the $0.000015 region.

Why Hasn’t XRP Reached $100, Pundit Explains the Factors Holding Back Its Surge

0

Crypto commentator Levi Rietveld recently attempted to address why XRP has been an underwhelming crypto asset for several years. 

In his view, certain negative influences have contributed to XRP’s inability to reach the $100 mark. In a recent video, Rietveld focused on the role of misinformation and fear, uncertainty, and doubt (FUD) in shaping XRP’s market performance. 

Specifically, he cited comments by Raoul Pal, a well-respected figure in the crypto community, as a case study.

“FUD” from the Likes of Raoul Pal Hindered XRP

Recently, Pal suggested that XRP is outdated and that investors should move on to newer cryptocurrencies or more trendy narratives like those around Solana.

Rietveld, who has often aligned with Pal’s views in the past, expressed disappointment in Pal’s remarks. He labeled them as misinformed and potentially harmful to the XRP community.

According to Rietveld, Pal’s statements reflect a misunderstanding of XRP’s technological advancements. He highlighted that, contrary to Pal’s claims, XRP has been outperforming other major cryptocurrencies like Solana in recent weeks, holding steady despite broader market downturns. 

Indeed, when observing XRP and Solana over shorter time frames, XRP clearly has the upper hand. For instance, XRP posted positive performance over the last 30 days and a more impressive 60-day growth of 28%. Meanwhile, SOL is down by 9% and 5% over the same time frame.

However, on a yearly scale or year-to-date timeframe, Solana significantly outperforms XRP, with XRP wallowing in the red.

Notably, Rietveld emphasized that XRP’s technological advancements, particularly in cross-border payments, are key reasons to remain bullish on XRP.

Refuting Pal’s Characterization of XRP

Furthermore, the XRP pundit refuted Pal’s characterization of XRP as a relic from previous bull markets. He argued that such claims overlook the unique hurdles XRP has faced, such as the legal battle with the SEC. 

Rietveld stressed that the lawsuit has not only tested XRP but has also provided valuable clarity for the entire industry.

Interestingly, Rietveld brought attention to Pal’s past endorsement of Terra Luna, which collapsed after being touted as “risk-free.” He suggests that this historical misstep calls into question Pal’s current judgments on valuable crypto projects.

Call to combat XRP FUD

Essentially, Rietveld believes that FUD, along with the lawsuit, has significantly prevented XRP from reaching as high as $100.

In conclusion, Rietveld urges viewers to stay informed and share accurate information to counteract the spread of misinformation and support XRP’s potential.

Opposing View

Meanwhile, other XRP community pundits, like Attorney Bill Morgan, have disagreed with Rietveld’s assessment. Morgan argues that while FUD and the lawsuit may have contributed, they are only part of the reason.

According to him, nobody really knows or can fully explain XRP’s price behavior over the last seven years.

NEAR Struggles Below $4, Eyes W-Shaped Recovery in Bear Channel

Despite an intense bearish phase, the NEAR price shows RSI divergence near critical support. Is it enough for a bullish comeback?

AI tokens are on a downhill path as the crypto market’s bearish phase progresses. The situation worsened when the Department of Justice ordered a subpoena to NVIDIA, causing the AI crypto market cap to drop to $25.55 billion. 

With top AI tokens losing critical levels, the NEAR token hangs tight with the hope of a double-bottom reversal pattern. Will the Near protocol rise again?

NEAR Trapped in a Falling Channel

In the daily chart, the NEAR token shows a falling channel pattern, accounting for a fall from $8.28 to the current market price of $3.73. Further, the ongoing bear cycle within the channel accounts for a 25% drop and registers nine out of ten bearish candles. 

Currently, the AI token is trading at $3.73 with a long-tail rejection before hitting the  $3.49 level. 

NEAR Price Chart
NEAR Price Chart

Further, the crucial EMAs in the daily chart maintain a declining trend following the death cross between the 50 and 200-day EMAs. 

However, on bullish support, the bullish divergence in the RSI line is clearly visible. This projects a high likelihood of another positive cycle to challenge the overhead resistances. 

Unique Accounts Drop With Daily Transaction Going Strong

Amid the bearish continuation, data from Near Blocks, a Near Protocol blockchain explorer, reveals a significant decline in the number of unique accounts on the NEAR protocol. The number has dropped dramatically from 2.25 million unique accounts in April to around 700,000 currently. 

Near Unique Accounts Chart

While the number of unique accounts has experienced dips throughout the year, these were typically followed by quick recoveries. However, over the past three weeks, the trend has not rebounded, highlighting a concerning lack of new unique accounts.

Near Daily Transactions Chart

On a positive note, year-to-date transaction growth has shown improvement. Starting the year with 3.991 million total transactions on January 1 and 1.169 million new addresses, the latest data indicates 7.459 million total transactions, with 712,000 new accounts maintaining a steady flow.

Will NEAR Price Rise Again?

Despite the bear channel and the declining trend in crucial EMAs, the demand at $3.495 support level for the NEAR token stands strong. With a lower price rejection and an early reversal, the intraday bullish pin bar candle teases a comeback. 

Based on the Fibonacci level, the upcoming resistances are at 23.60% and 38.20% levels at $4.62 and $5.32. 

1.97T Shiba Inu in 24-Hours as Bears Still Dominating

0

On-chain activities point to increased traction towards SHIB, an indicator of a possible price rebound.

The second-largest memecoin, Shiba Inu, might be on the path to a notable rebound after on-chain activities showed increased whale activities. Data from IntoTheBlock shows a momentous increase in the number of large transactions on the network, signaling the reawakening of whales.

According to the data, the number of large transaction volumes involving SHIB reached 45 in the last day, bouncing from a 7-day low of 34 transactions. This signals a notable surge in transactions above $100,000 as institutional investors show renewed interest.

SHIB large transactions

Remarkably, these transactions have led to the movement of over 1.97 trillion SHIB in the past 24 hours, the highest since the start of September. Whales seemed to take a break from the Shiba Inu ecosystem at the beginning of the month when just 696.5 billion SHIB were transacted on September 1.

The increased traction has seen the USD worth of large transactions in the Shiba Inu market reach $25.8 million in the past 24 hours. However, this is a decline from the $49.37 million seen on August 30.

SHIB Burn Spikes 40%

Increased whale presence was not the only positive in the Shiba Inu ecosystem. Data from community-driven burn tracker Shibburn shows increased SHIB burn activity, with a notable 40.5% spike. Per the data, about 2,064,565 SHIB was incinerated on Tuesday.

However, Tuesday’s burn falls below the famous August 31st burn sponsored by the Living the Dream (LTD) project. The team behind the Shiba Inu-tied token burned 500 million SHIB in two days.

Bearish Trend Persist

Despite the positive activities around Shiba Inu, its price has continued to show weakness. SHIB continued has continued its downward trend this morning, now down over 2.5% in the past 24 hours to trade at $0.00001322.

Also, the number of bears in the past seven days stands at 138, while that of bulls is at 132. For context, bulls are addresses that have bought more than 1% of the token’s 24-hour trading volume, and bears are those that have sold.

Bull to Bear
Bull to Bear

FBI Issues Critical Alert About Bitcoin and Ethereum ETFs 

0

The Federal Bureau of Investigation (FBI) warns companies associated with Bitcoin and Ethereum ETFs about a potential attack from North Korean hackers. 

According to a notice issued yesterday, the FBI warned that these fraudulent North Korean hackers target crypto ETF companies through sophisticated social engineering attacks. 

It revealed that North Korea’s cyber actors have been investigating these companies over the past few months, with possible plans to attack them.

North Korea’s Sophisticated Tactics 

The FBI stressed that North Korea leverages sophisticated and elusive tactics to steal digital assets from companies with large funds. 

Per the announcement, North Korea’s cyber actors use social engineering tactics, such as extensive pre-operational research and impersonation, to deceive employees into granting access to their companies’ networks. 

Furthermore, the FBI claimed that these malefactors boost their impersonation credibility using realistic imagery of individuals known to victims.

Indicators and Safety Measures 

Specific indicators of North Korea’s social engineering tactics include malicious investment offers from notable crypto companies, requests to run suspicious codes, and unsolicited job offers with unrealistic compensation. 

To prevent falling prey to scammers, the FBI advised crypto ETF-related companies to develop unique methods of verifying contacts. It also advised these firms to avoid storing crypto wallet information on devices linked to the internet.  

Additionally, the FBI shared tips to protect companies already impacted by these social engineering tactics. They include disconnecting affected devices from the internet, reporting incidents to the FBI’s complaint center, and sharing experiences with employees. 

Bitcoin and Ethereum ETFs Attract Significant Attention 

It is worth mentioning that the U.S. SEC approved multiple Bitcoin and Ethereum spot-based ETFs earlier this year. While Bitcoin spot ETFs have attracted significant investments from traditional investors, the Ethereum funds have not been impressive. 

Data from Farside Investors shows that Bitcoin ETFs have attracted $17.31 billion in inflow since their launch on January 10. Conversely, Ethereum ETFs have recorded an outflow of $524.8 million since July 23.

Notably, the outflow witnessed in the Ethereum spot ETF market stems from Grayscale’s converted Ethereum Trust ETF. Nonetheless, other Ethereum ETF issuers have registered significant inflows, attracting the attention of investors and scammers. 

Meanwhile, North Korean cyber actors have been targeting crypto exchanges in the past years. As reported earlier, North Korean hackers stole over $70 million worth of BTC, ETH, and XRP from CoinEx last year. In 2022, North Korean cyber actors also made a failed attempt to steal funds from an unidentified Israel-based exchange. 

Notably, most North Korea-related scams are carried out by popular hacking organization, the Lazarus Group.

XRP Poised for a Climb to $27.3 After Finally Bottoming Against Bitcoin: Expert

0

XRP has been underperforming against Bitcoin for quite some time, but recent analyses suggest that this trend may be changing. 

According to market analyst EGRAG Crypto, XRP has finally reached a bottom against Bitcoin. This occurrence has triggered optimism among XRP investors who look forward to a potential price surge.

A Look at the XRP/BTC Pair

With an accompanying chart, EGRAG showed the long-term performance of XRP against Bitcoin, stretching back several years. 

In his initial analysis, EGRAG highlighted what he called the “Atlantic & Pacific Line,” drawing an analogy to the meeting point of two different oceanic bodies that do not mix. He used this metaphor to describe two distinct targets on the chart. 

Image

The lower target, set at 0.00000500 BTC, represented what EGRAG called the bottoming point for XRP in its macro view against Bitcoin. This level marked the lowest point XRP could reach relative to Bitcoin. Notably, from this base, the only direction is upwards. 

Meanwhile, the second target was 0.00013000 BTC. EGRAG set this target much higher, corresponding to a previous all-time high for XRP against Bitcoin. The initial analysis suggested that XRP could first drop to the 0.00000500 BTC low before recovering to 0.00013000 BTC.

After the May analysis, XRP continued to drop against Bitcoin, a trend that persisted since Q4 2023. Despite Bitcoin also facing a correction, the sharp collapse of the XRP/BTC ratio since then confirmed that XRP’s rate of decline was much harsher than Bitcoin’s due to greater volatility.

XRP and Bitcoin Targets

In his recent update, EGRAG confirmed the formation of a bottoming structure on the XRP/BTC chart following the drop. 

He believes this structure indicates that XRP is preparing for a significant upward movement. The analyst suggests that the fourth quarter of the year will be a critical period for XRP. This period could potentially mark the “ignition stage” for this anticipated rally.

He then set ambitious price targets for both Bitcoin and XRP, with the 0.00013000 BTC target in sight. If XRP reaches the upper target of 0.00013000 BTC, and assuming Bitcoin’s price hits certain milestones, XRP could see substantial gains. 

For instance, if Bitcoin reaches $80,000, XRP could be valued at around $10.40. This valuation only grows more lucrative with higher Bitcoin prices, potentially reaching as high as $27.3 if Bitcoin itself hits $210,000.

Repeated Rejections from Solana Signal Potential Reversal Towards $55

0

Solana (SOL) has encountered consistent challenges in breaking above its bull market support band, raising concerns about potential price declines. 

According to market veteran Benjamin Cowen, SOL continues to face rejection from this critical resistance zone, which has been a key factor in its price trajectory. The bull market support band, represented by moving averages, acts as a key resistance level that SOL has struggled to surpass.

This pattern raises questions about whether Solana may fall back into its previous technical formations, potentially echoing movements demonstrated by Ethereum (ETH).

Bull Market Support Band Rejection

In the analyst’s chart, the bull market support band represents key medium-term trends, often defined by the 20-week and 21-week exponential moving averages (EMAs). SOL has repeatedly faced rejection when attempting to break above this band, signaling strong resistance in this range.

With the current price sitting at $129, SOL has been unable to sustain its upward movement, most recently being rejected near the $190 mark in July.

Wedge Pattern Suggests Potential Reversal

The rising wedge pattern on Cowen’s chart suggests a possible reversal. This pattern, often a precursor to price breakdowns, has shown that SOL may soon retest lower levels. Initially breaking out of the wedge to the upside, SOL now risks falling back into this formation. 

Should this occur, the bottom of the wedge around the $55 mark may act as a new support level. This coincides with Cowen’s prediction that SOL could behave similarly to Ethereum, which also retraced after a rejection.

Development Activity and Whale Selling Pressure

Beyond technical patterns, SOL’s development activity has also seen notable fluctuations in recent months. While development activity remained steady from March to May, a spike occurred in June, coinciding with upward price movement.

SOL Development Activity

However, by late August and early September, development activity began to taper off, falling to 30.86. This decrease in development activity aligns with SOL’s price decline.

Adding to the downward pressure, major Solana whales have been offloading their holdings throughout 2024. Notably, a large Solana whale, possibly an institutional entity, has sold 695,000 SOL since January 1, worth $99.5 million.

Despite these sales, the entity still holds 1.88 million SOL, valued at approximately $255.89 million, which remains staked. The steady liquidation of large holdings contributes to speculation of further price declines, particularly if whale selling continues at its current pace.