Home Blog Page 1275

Expert Challenges XRP Supporters: Asks to Prove XRP Price Rise Without Using Charts, Hype, or Influencer Opinions

0

Popular XRP community figure David “XRP Lion” challenges market watchers and analysts to provide a reasonable and sound analysis to support a potential price rise for XRP. 

According to David, the analysis must exclude commonly used methods like bull run terms, technical analysis charts, and potential influence from XRP’s correlation with Bitcoin (BTC).

Additionally, he emphasized that the analysis must not reference opinions from popular XRP influencers like Ben Armstrong (BitBoy). Interestingly, David claimed that only one person has met these criteria so far. He noted that the person’s identity will be revealed in an upcoming XRP pricing video. 

Why Past Performance Doesn’t Support Future Price Action 

Furthermore, the XRP community member asserted that an asset’s past performance does not determine its future price action. He buttressed this assertion using XRP’s price movements during significant updates from the SEC v. Ripple lawsuit. 

David stated that nothing happened to XRP’s price after July 13, 2023. Although this day was marked as the official date when Judge Analisa Torres issued the summary judgment decision in the Ripple case, David claimed it was the period when the “SEC released Brad Garlinghouse and Chris Larsen” (Ripple executives). 

He also suggested that the relisting of XRP on United States-based exchanges following Judge Torres’ summary judgment ruling did not lead to any price changes for the asset. Lastly, the user said nothing also happened when Judge Torres drastically reduced the SEC’s proposed fine in the case from nearly $2 billion to $125 million. 

It is worth noting that David’s commentary reinforces the need for robust evidence to support a potential increase in XRP’s price. 

XRP Performance After Judge Torres Final Verdict  

Meanwhile, XRP witnessed substantial gains whenever there were positive updates from the SEC v. Ripple lawsuit. For instance, the price of XRP spiked by over 70% after Judge Torres released the summary judgment decision. The asset’s price also increased by over 30% shortly after the final judgment was released. 

Nonetheless, these gains have not been sustainable. At press time, XRP has plummeted 11.98% from the monthly high of $0.6416 registered on August 7, the same day Judge Torres released the final judgment. Currently, XRP is trading at $0.5647, marking a daily decrease of 1.61% and a weekly decline of 6.02%. 

XRPUSDT 2024 08 30 09 22 24
XRP 1D Chart

Analyst Says Bitcoin to $250K as Most Powerful BTC Bull Run Phase Begins

0

As Bitcoin struggles at the $60,000 territory, market analyst Aurelien Ohayon recently asserted that its most powerful bull run has just begun.

Ohayon’s recent calls attention to an interesting pattern in Bitcoin’s long-term price movements. With this, he suggested that the most potent phase of the current bull run is just beginning.

Historical Pattern

Notably, the accompanying chart traces Bitcoin’s historical tops and bottoms across three previous market cycles. Each cycle features a steep climb to a new all-time high, followed by a significant decline and a period of consolidation before the price surges once again. 

Bitcoin Cycles Aurelien Ohayon
Bitcoin Cycles | Aurelien Ohayon

This pattern was evident from Bitcoin’s first major peak on the chart, attained in November 2013 when the price soared to $1,163. After reaching this peak, Bitcoin underwent a steep correction, eventually bottoming out at $152 in January 2015.

From this low, Bitcoin embarked on a remarkable recovery, culminating in a second peak of $19,666 in December 2017. The subsequent decline was equally dramatic, with the price reaching a low of $3,122 in December 2018. 

After this bottom, Bitcoin hit its third peak of $69,000 in November 2021. Meanwhile, following the November 2021 high, Bitcoin entered a prolonged downturn, hitting a low of $15,479 in November 2022. This formed the third significant bottom on the chart. 

Bitcoin in the Current Cycle

Nonetheless, in a pattern inconsistent with previous cycles, Bitcoin’s latest recovery saw it hit a new all-time high of over $73,000 by March 2024. This high came up sooner than market analysts projected.

Notably, during previous cycles, Bitcoin never reached a new all-time high before a halving event. However, the March 2024 all-time high came up a month before the latest halving event in April. Some have attributed this to the advent of institutional investors through the spot Bitcoin ETFs, launched in February.

Despite this impressive gain, Ohayon suggests that Bitcoin has not yet reached its peak for this cycle. The chart indicates that the most powerful phase of the bull run is still ahead, with the potential to drive Bitcoin’s price to an astonishing $250,000. 

The analyst based this projection on the assumption that Bitcoin will follow a similar trajectory to previous cycles, with the final stage of the bull run featuring exponential gains. Market Veteran Brandt had previously asserted that $73K was the top for this cycle. Nonetheless, he recently reviewed his analysis, projecting another pump to $92K.

Bitcoin’s monthly Bollinger Bands also confirm that this cycle’s top might still be in the works. Notably, in previous cycles, the Bollinger Bands tightened during consolidation and expanded whenever the cycle top reached. As BTC trades for $59,107, the Bands have remained tightened at press time.

Bitcoin Bollinger Bands

Chainlink Reversal Run Supported by On-Chain Data Eyes $12.49

With a minor pullback, Chainlink sees a double-bottom reversal to ignite a breakout rally. Will the uptrend reach $12.49?

Amid increased liquidations in the market and high volatility in the DeFi segment, Chainlink is preparing for a trend reversal. The underlying sentiments are teasing a bounce back from $10.85. Is this the best dip to buy? 

Bulls Back For Chainlink 

In the 4-hour chart following the triangle pattern breakout, the recovery rally in Chainlink continued to reach $12.50. The recovery run, which started from $8.47 in early August, reached the pinnacle of $12.49, accounting for a 47% price jump. 

The recovery run comes after a massive drop from $13.90 to the bottom support of $8.47. Based on the Fibonacci levels retraced over the correction phase, the 78.60% level at $12.49 remains a crucial resistance level. 

COINBASE:LINKUSD Chart Image by Trojan69420

The recent pullback from $12.49 forms a small resistance trend line. Currently, Chainlink shows a consolidation phase between the 50% and 61.80% levels at $10.85 and $11.50, respectively.

Furthermore, the 4-hour price action reveals a potential double-bottom reversal to challenge the newly formed resistance trend line. 

The daily RSI line shows a massive bullish divergence between the two bottoms at the 50% Fibonacci level, reflecting high uptrend chances. Meanwhile, the MACD indicator supports the breakout chances as it prepares for a bullish crossover. 

Bullish Influence Grows Over On-chain 

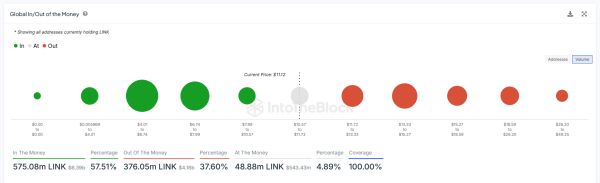
Regarding the on-chain indicators, IntoTheBlock data reveals that 57.51% of the Chainlink volume, consisting of 575 million LINK tokens, is in the money. Thus, profitable holders hold $6.39 billion worth of LINK tokens. 

Screenshot 2024 08 30 131243

Meanwhile, 37.60% of the volume, accounting for 376 million LINK tokens, were bought at higher prices. These tokens account for $4.81 billion and are out of the money. Additionally, 48.88 million LINK tokens were bought between $10.57 and $11.72, currently at break-even points, accounting for 4.89% of the entire volume.

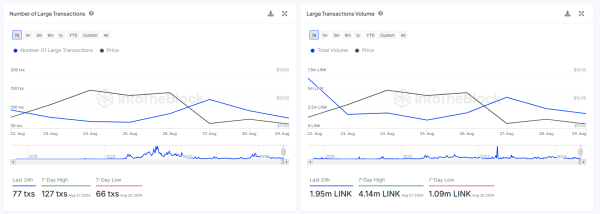
The Chainlink network shows high fluctuations in the number of last transactions and their volumes. In the last seven days, the number of transactions has dropped from 99 to 77, with the seven-day high at 127 and the lowest at 66. 

The volume of these transactions has dropped massively in the last seven days, from 6.72 million to 1.95 million LINK tokens. 

Screenshot 2024 08 30 131454

Will Chainlink Hit $12.49?

The Chainlink price shows two consecutive bullish candles accounting for a price jump of 1.50% and forms a morning star pattern. With a potential bullish breakout, the uptrend can find resistances at 61.80% and 78.60% levels at $11.50 and $12.49, respectively. 

Following the breakout, the uptrend could reach the $13.90 peak or the $16.76 resistance level. On the bottom side, the 38.20% and 23.60% support levels are at $10.23 and $9.52, respectively. 

BlackRock, Fidelity, and Grayscale Sell Bitcoin as US ETFs See Third Straight Outflow Day

0

The US Bitcoin spot ETFs sold 1,213 BTC on Thursday as investors pulled funds from the products amid Bitcoin’s underperformance.

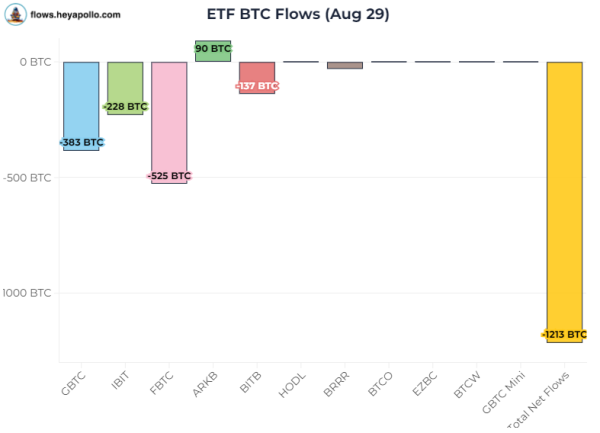
A majority of US exchange-traded funds (ETFs) sold their Bitcoin stash on Thursday, marking the products’ third consecutive outflow day. The ETFs sold a total of 1,213 BTC ($71.73 million) as investors continued to take a cautious approach amidst market uncertainties.

Thursday’s net outflow saw BlackRock’s IBIT record its second outflow since its launch. The leading asset manager sold 228 BTC ($13.51 million) on August 29, taking its cumulative net inflow to $20.92 billion.

IBIT’s last outflow day came on May 1, when the broader spot Bitcoin ETF market saw one of its largest-ever single-day outflows. That day, the funds recorded a $563.7 million outflow, while $36.9 million flowed out from IBIT.

Fidelity’s FBTC saw its second successive outflow on Thursday and its third in the last five days. The fund sold 525 BTC ($31.17 million) on Thursday, almost three times its 176 BTC ($10.37 million) Wednesday sales. However, the fund still has the second-largest cumulative inflow and is closing in on Grayscale’s net asset.

More Outflows

Grayscale’s GBTC saw a net outflow of $22.68 million on August 29 after selling 383 BTC. It was the third consecutive day that the fund had net outflows, losing Bitcoin worth $49 million cumulatively. The fund has seen a net outflow of $19.78 billion since January 11.

Data from Arkham showed that Ark Invest sold $100 million worth of Bitcoin on Tuesday. However, the asset manager was the only issuer to record a net inflow yesterday after buying 90 BTC ($5.34 million). Ark Invest’s ARKB has sold 1,686 BTC ($155 million) in the past three days.

Bitwise’s BITB and Valkyrie’s BRRR saw cumulative outflows of $9.77 million on Thursday. BITB sold 137 BTC, while BRRR sold 28 BTC. Other issuers like Grayscale’s BTC and VanEck’s HOLD recorded zero flow.

Bitcoin
US ETFs Bitcoin Sales August 29

Notably, Thursday’s trading volume declined compared to Wednesday’s. The trading volume on August 29 was $1.64 billion, while that on August 28 was $2.18 billion.

Thursday’s US ETFs’ Bitcoin sales saw the asset continue its price consolidation below $60,000. Bitcoin traded at $59,271 at press time, with a 24-hour trading volume of $33.2 billion.

Expert Says Bitcoin “Will Do Better” Under Kamala Harris

0

As the 2024 U.S. Presidential Election draws near, discussions among Bitcoin supporters are becoming increasingly focused on the potential impact of the election’s outcome on the crypto market. 

Recent debates, particularly within the Bitcoin maximalist community, reveal diverging opinions on which candidate would be more beneficial for Bitcoin. 

One vocal Bitcoin supporter, Rajat Soni, has sparked conversation by suggesting that a Kamala Harris victory could have significant consequences for Bitcoin.

According to Soni, the U.S. dollar could experience rapid devaluation under a Harris administration, which he believes would drive a shift toward Bitcoin as an alternative means of transaction. 

Soni’s argument centers on the idea that as the dollar loses value, the demand for Bitcoin would surge, making it a more attractive asset for those looking to preserve wealth. He further emphasized that while real estate prices might rise due to dollar devaluation, Bitcoin’s potential for growth could far outpace that of traditional assets.

Divergent Views on Bitcoin’s Future 

Notably, some Bitcoin community members express contrasting views, with one commenter suggesting that Bitcoin would benefit more under Donald Trump’s leadership.

The commenter speculated that Trump’s plan to have the U.S. government purchase one million Bitcoin for the strategic reserve would significantly bolster the asset’s value.

However, Soni responded with skepticism, doubting Trump’s commitment to such a plan, arguing that it could lead to an intentional devaluation of the dollar. 

Tight Presidential Race

The intense speculation among Bitcoin enthusiasts is mirrored in the competitive nature of the 2024 Presidential race, as observed in the betting market on Polymarket.

The platform’s odds reveal a closely contested election, with Donald Trump and Kamala Harris nearly tied in terms of probability. 

Screenshot 2024 08 30T110201613
Polymarket

As of the latest update, Trump holds a slight edge with a 50% chance, while Harris follows closely at 49%. This slim margin reflects the high stakes and uncertainty surrounding the election’s outcome, which could have far-reaching implications for the cryptocurrency market.

Analyst Predicts $16,000 Bitcoin if Harris Wins

Conversely, the prospect of a Bitcoin dump under a Harris administration is also widespread. On Thursday, a well-known crypto trader issued a prediction that Bitcoin could plunge to the $16,000 level if Vice President Kamala Harris secures the U.S. presidency in the upcoming November elections.

Bitcoin last reached this level during the 2022 market downturn, which was driven by events such as the collapse of Terra and the bankruptcy of FTX. 

Essentially, these predictions highlight the influence that macroeconomic factors, including government policies, can have on Bitcoin despite its decentralized nature.

Pundit Says XRP $1,000 Prediction Is Unrealistic but $15 Achievable

0

XRP community member “Financial Freedom” has challenged the notion of XRP reaching $1,000, dismissing it as unrealistic while noting that $15 may be attainable.

This comes as members of the XRP community recently unearthed old commentaries by the U.S.-based exchange Uphold concerning XRP reaching $1,000. While some XRP proponents remain optimistic about the ambitious target, others, like “Financial Freedom,” are calling for a more realistic outlook.

First, the commentator criticized the community for entertaining such “insane price predictions,” pointing out the unrealistic nature of the forecast given current market dynamics.

Specifically, “Financial Freedom” noted that at the hypothetical $1,000 price, XRP would command a valuation of approximately $100 trillion, whereas the global crypto market is only $2.07 trillion today. Of this value, Bitcoin commands more than 50% with a $1.16 trillion market cap, while XRP makes up only 2.71%.

Essentially, the hypothetical value of $1,000 for XRP raises questions about the valuation of the broader market if XRP alone were to reach $50 trillion.

Furthermore, Financial Freedom’s commentary highlighted the failures of previous price forecasts for XRP. He noted that influencers and analysts have made bold projections for XRP over the past six years that have not materialized.

“Six years of XRP price guessing, and not one so-called expert, analyst, YouTuber, or influencer was correct,” he remarked.

XRP Army Should Be Satisfied with $15 XRP

Moreover, the post further criticized the XRP community for missing several bull runs over the past few years, adding that despite the conclusion of the SEC lawsuit against Ripple, the expected price surge for XRP hasn’t materialized.

“If it was the lawsuit that held XRP back, now that it’s ended, wouldn’t the price explode to catch up since there is clarity?” Financial Freedom questioned.

As an XRP holder himself, Financial Freedom advocates for a more grounded outlook. He suggests that a $1 trillion market cap by 2030 is more realistic, equating to approximately $15 per XRP.

“You should be happy with 30x in 5 years. That’s a nice return,” he noted.

Clarification Concerning Uphold’s $1,000 XRP Statements

While Financial Freedom has challenged the $1,000 XRP price prediction attributed to the Uphold exchange, it is worth noting that the exchange itself has not explicitly forecasted that XRP would reach $1,000.

In fact, Uphold has made no price forecast for XRP. Its statements merely concerned how investors might react in such a hypothetical scenario.

Shiba Inu Lead Reacts as Kraken Adds SHIB as Futures Collateral Asset 

0

Prominent crypto exchange Kraken has added Shiba Inu (SHIB) as a collateral asset for futures trading. 

Kraken announced the development yesterday, as community members expect the move to expand the utility of the second-biggest memecoin by market cap. According to the exchange, Kraken Pro users can use Shiba Inu to gain exposure to over 200 perpetual futures contracts. 

To utilize SHIB as a collateral asset on Kraken, users must move their funds to futures wallets directly from their spot wallets. 

Shiba Inu Lead Reacts 

As expected, the development triggered enthusiasm among SHIB enthusiasts, including Shiba Inu’s lead developer Shytoshi Kusama. 

Reacting to the announcement, the Shiba Inu ecosystem lead posted a smiling face with a halo overhead emoji. 

Kusama’s reaction suggests that he considers the news to be a favorable development with the potential to impact Shiba Inu’s performance in the long term positively. Notably, the move could drive SHIB’s visibility and demand. 

The news coincides with a slight uptick in Shiba Inu’s price, which has risen 1.37% in the past day. Conversely, the memecoin has plunged 2.3% on the weekly charts. At press time, Shiba Inu trades at $0.00001407, with a 24-hour trading volume of $195.95 million. 

Kraken Adds PEPE and WIF as Collateral Assets

In addition to Shiba Inu, Kraken added two other popular memecoins, Pepe (PEPE) and dogwifhat (WIF), as collateral assets for futures trading. Like SHIB, Kraken users can also gain exposure to over 200 perpetual contracts using PEPE and WIF. 

The move comes days before the listing of WIF and PEPE on Kraken’s Canadian arm, scheduled for September 5. 

Meanwhile, Kraken has continued to expand its support for Shiba Inu since it officially listed the token in November 2021. 

Part of Kraken’s support includes reducing SHIB’s trading fees, introducing futures trading, and adding new SHIB margin pairs. Last week, Kraken added the SHIB/EUR margin trading pair, offering up to 3X leverage position for the pair. 

Solana Validators’ Revenue Sees Major Shift as DeFi Activity Soars in 2024

0

In 2024, validators on Solana have experienced a notable shift in revenue distribution, due to the rise in decentralized finance (DeFi) activities.

Data shared by Tom Wan from a Dune Analytics dashboard highlights the changes in revenue sources for Solana validators.

Revenue Breakdown Over Time

In January 2024, Solana validators saw a revenue structure dominated by issuance, which constituted 95% of their income. In contrast, Minor Extractable Value (MEV) and fees accounted for only 1.9% and 3.1%, respectively. 

However, by July 29, the landscape changed drastically. Issuance had reduced to 78.2%, while MEV revenue surged to 15.3%, and fees increased to 6.5%. Notably, according to Wan, these shifts were due to the rise in decentralized finance activities.

Correlation with Major Cryptos

Meanwhile, further data analysis reveals interesting trends in the correlation between Solana (SOL) and two major cryptocurrencies, Bitcoin (BTC) and Ethereum (ETH).

The 30-day rolling correlation of returns shows significant volatility in the relationship between SOL and BTC, with notable dips into negative correlation around April 2021 and late 2023 to early 2024. 

Screenshot 2024 08 30T091904669

SOL|BTC|ETH Correlation

This suggests that Solana’s price movements do not consistently align with Bitcoin, reflecting the market’s fluctuating sentiment.

Meanwhile, the correlation between SOL and ETH has been more stable, indicating that Solana’s price often mirrors Ethereum’s, despite occasional independent movements in 2023 and 2024.

Investment Performance Comparison

Also, an investment simulator comparison from April 2023 to July 2024 shows Solana has notably outperformed other major cryptocurrencies. Solana’s returns peaked at over 1,500% in early 2024, outpacing Bitcoin and Ethereum, which both saw more moderate growth, peaking around 200%.

Screenshot 2024 08 30T095813615
Return Comparison | Dune

Despite some volatility, Solana maintained its lead, with BNB and ADA showing more restrained returns around 100%. 

However, amid Solana’s positive feat, renowned TradingView analyst Alan Santana has issued a cautionary forecast, predicting a steeper decline for Solana to $55.

Santana warns that the lack of significant support at this level could exacerbate the downturn, drawing parallels with Ethereum’s recent performance.

Dormant Floki Whale Awakens, Sparks 17% Drop: $0.00010 Support in Jeopardy

With the meme coins under pressure, FLOKI crashes with a long-dormant address waking up to sell. Will the FLOKI drop below $0.00010?

With a 12.59% drop last night, the Floki price continues the bearish trend with a 5.77% intraday drop. The sudden drop in the meme coin accounts for a 17% drop in the past 24 hours. Will the increased supply and the volatile meme coin segment result in a prolonged crash in Floki?

With Intense Supply, Floki Reverts From $0.00015

With two consecutive bearish candles, Floki’s underlying sentiment has completely shifted. In the daily chart, the Floki price action reveals a double-bottom reversal from the $0.00010 psychological mark after a massive 10-day falling streak of 40% in early August. 

FLOKI Price Chart
FLOKI Price Chart

Further, the double-bottom reversal successfully reclaims the $0.00015 psychological mark. However, the recent crash quickly resulted in a new negative cycle approaching the psychological mark again, approaching the bottom psychological support level. 

The MACD indicator shows the average lines ready for a bearish crossover as the supply pressure increases. Meanwhile, the daily RSI line also reveals a massive downtick crossing under the 14-day SMA and the halfway line. 

Dormant Floki Whale Wakes Up

As a long-dormant Floki whale wallet linked to the official project team wakes up after 2.5 years, the bearish actions result in a crash in FLOKI. Depositing 15.22 billion FLOKI tokens worth $2.27 million at the time to Binance led to a massive supply inflow. 

With bulls failing to absorb the sudden supply, the deposit times with a massive dip in the FLOKI price. The wallet held the FLOKI tokens from the original release by the Floki deployer in early 2022. Back then, the Floki price was $0.0000307, reflecting massive gains for the holder. 

Will Floki Survive The Crash?

With a new negative cycle between $0.00010 and $0.00015, the meme coin can expect the consolidation range to prolong for a few days amid the broader market volatility. 

A bearish breakdown of the $0.00010 psychological mark could result in a bearish continuation to the next support levels at $0.000078 and $0.000055. Conversely, a bullish cycle from the $0.00010 will have to surpass the $0.00015 to test the following resistance levels at $0.00020 and $0.00024.

Court Dismisses Dogecoin Manipulation Lawsuit Against Elon Musk and Tesla

0

Judge Hellerstein dismisses the Dogecoin manipulation lawsuit against Elon Musk and Tesla two years after it was filed, citing a lack of evidence.

An accusation against Tesla chief Elon Musk and his electric motor company would not proceed to trial after a court threw out the case late Thursday. Judge Alvin Hellerstein of the United States District Court for the Southern District of New York ruled that the evidence provided that Musk manipulated Dogecoin was inadmissible.

According to the judge, the case lacked evidence to continue as the plaintiff’s claims were not synchronous with the evidence provided. He then dismissed the lawsuit on those legal grounds.

Recall that a group of investors sued Musk and Tesla two years back for allegedly manipulating Dogecoin for personal gain, claiming he hurt holders of the memecoin. In the June 2022 lawsuit, the plaintiffs demanded a staggering $258 billion compensation for damages and losses.

Evidence is Inadmissible

In his ruling two years later, Judge Hellerstein stated that the evidence brought forward was a clear misinterpretation of Musk’s tweets about DOGE.

The investors claimed that Musk promoted Dogecoin through his tweets, making comments about how the memecoin was the future of cryptocurrency, how he was the CEO of Dogecoin, and how he would literally fly the token through SpaceX to the moon.

However, Judge Hellerstein noted that Musk’s tweets were his fantasies and aspirations, which were subject to falsification and misinterpretation. The judge also stated that they were Musk’s opinion, and that no rational investor should see them as financial advice.

The court also dismissed Musk’s “pump and dump” allegations. Judge Hellerstein noted that market manipulation, according to the law, involves inside trading, and the accusations didn’t provide evidence of such activity. The plaintiff accused Musk of pumping Dogecoin by over 36,000% in two years and allowing it to crash.

DOGE barely moved after the court threw out the lawsuit, as it continued to consolidate amidst a broader market downtrend. At the time of writing, Dogecoin was trading at $0.1001, down over 1% in the past 24 hours. The memecoin remained 8th in the cryptocurrency ranking with a market cap of $14.5 billion.