Home Blog Page 1277

Top Analyst Says XRP to Hit $50 as There is Nothing You Can Do About it

0

Analyst Amonyx has reiterated his prediction that XRP will reach the lofty price of $50 this season, emphasizing that this projection is inevitable, regardless of what the skeptics think.

In a recent post on X, Amonyx expressed this bold sentiment, emphasizing his belief that a “God” candle could propel XRP to unprecedented highs.

XRP Path to Above $50

In his analysis, Amonyx outlined XRP’s path to $50. He first noted that the asset would quickly rally to above $10 at lightning speed. He believes this initial surge will set the stage for a more explosive run to above $50.

“There is nothing you can do about it,” Amonyx declared. This latest forecast updates an earlier one in which he predicted that XRP could surge by over 11,700% to $57 within an eight-week window.

He shared a weekly chart suggesting that massive green candles could appear for XRP, compensating for the prolonged period of painful consolidation. Notably, XRP has been in a downtrend for nearly seven years, during which it has dropped over 85% from its all-time high.

Projections of a God candle reversing XRP’s losses are not new, and such analyses often suggest unprecedented price points beyond $10.

Market Participants Disagree

However, many market participants have grown increasingly skeptical about this prediction, as it has been made numerous times without coming to fruition.

Reacting to Amonyx’s latest call for an aggressive XRP, X user Cuzzin Henry humorously remarked that the triangle had been stretched more than Pinocchio’s nose. Likewise, commenter Rodney Cowden noted that simply drawing a speculative line on a chart won’t make the market move as one might hope.

Another commenter remarked that in 50 years, even if Bitcoin is no longer in use and the world has moved on to something else, XRP could still be in the same stagnant state as it is now.

Market reacting with skepticim
Market reacting with skepticism.

Other prominent market critics like Michael XBT have repeatedly countered Amonyx’s predictions. While Michael agrees that XRP could see a sharp rally if it breaks out of the seven-year pennant, he believes the returns will be significantly lower than in 2017. 

Predicting a target of just $2, he advised those expecting a 100X pump to prepare for disappointment, warning that they could end up being the “exit liquidity” for others.
Top Analyst Revises Solana Crash Target, Now Predicts 62% Drop to $55

0

Renowned TradingView analyst Alan Santana has revised his forecast for Solana (SOL), now predicting a steeper decline to $55.

This updated target suggests a more pronounced downturn than initially anticipated. Meanwhile, Santana pointed out that the $55 level still lacks significant support, which could exacerbate the downward momentum.

He also draws a comparison to Ethereum’s recent performance, cautioning that Solana, as a smaller and less established asset, may be more susceptible to a severe crash. He emphasizes the potential evaporation of crypto wealth, warning traders to stay vigilant.

$58.82 Support Level Aligns with Santana’s Target

Santana’s analysis highlights key Fibonacci retracement levels, with the 0.382 level at $137.03 being particularly significant as the price hovers nearby. He also points out the 0.5 retracement level at $114.18 and the 0.618 level at $91.34, which could offer temporary support.

However, the 0.786 retracement level at $58.82 suggests a more substantial support zone, aligning closely with Santana’s revised target. Additionally, a descending trendline reinforces the bearish sentiment, as SOL consistently fails to break above it. A rounding top pattern further signals a potential bearish reversal.

Screenshot 2024 08 29T133923989
SOL/USDT 3-day chart / Alan Santana

Speculative Timeline for Solana’s Decline

Santana speculates that if Solana’s downward movement begins around August 29, it could continue for three weeks, reaching a final low by September 19. While he acknowledges the difficulty in predicting exact movements, he suggests a possible bounce followed by a lower low, signaling the end of the bearish wave. 

Although this timeline is speculative, Santana emphasizes Solana’s ongoing downward trajectory, mirroring the trends of other major cryptocurrencies like Bitcoin, Ethereum, and XRP, which are also experiencing declines. He hints that smaller and medium-sized projects, which have already seen significant drops, might recover more quickly.

Solana’s Potential Parallels with Ethereum

Santana’s bearish perspective aligns closely with other market watchers who have projected a significant downturn for Solana, though he is more bearish than others. While some have suggested a drop to $85, Santana is looking at a potential low of $33.

In another analysis, market pundit Benjamin Cowen highlighted Solana’s likelihood to follow a pattern similar to Ethereum’s trading pair with Bitcoin. Cowen compares ETH/BTC and SOL/BTC, noting that both have experienced significant drops from their peaks.

Cowen points out that ETH/BTC’s recovery included a robust rebound of over 500%, followed by consolidation and another correction. He observes that SOL/BTC has shown similar patterns, with a 90% drop followed by a notable rebound. Cowen indicates that Solana’s next phase might involve consolidation, mirroring Ethereum’s past movements.

At press time, Solana trades at $145% after losing 1% of its value over the past day. A drop to $55 would mark a staggering 62% drop.

Bitcoin Recovers Despite U.S. ETFs 1782 BTC Sales

0

The US Bitcoin spot ETFs saw a net outflow of $105 million on Wednesday, their second consecutive outflow day.

The largest crypto asset, Bitcoin, recovered from a Wednesday scare despite the US Bitcoin spot exchange-traded funds (ETFs) selling 1,782 BTC ($105 million). Bitcoin dropped below $58,000 yesterday but bounced 2.8% to trade at $59,659.

On Wednesday, the US ETFs saw their second successive outflow after an eight-day inflow streak. Investors pulled out $105 million from the funds as Bitcoin’s struggle to hold above $60,000 continued.

Ark Invest Lead Outflow

Ark Invest’s 21 Shares have led outflows from the US ETFs for the second consecutive day. ARKB sold 1,003 BTC ($59.27 million) on Wednesday after selling 1,717 BTC ($102 million) on Tuesday. The issuer now has a cumulative net inflow of $2.37 billion and a net asset of $2.69 billion.

Fidelity’s FBTC and VanEck’s HODL had a similar outflow, selling 176 BTC ($10.37 million) and 171 BTC ($10.07 million), respectively. Both funds had zero flow on August 27, signaling a cautious play among investors.

The two Grayscale funds (GBTC and BTC) sold a combined 284 BTC ($16.75 million) yesterday. GBTC saw a net outflow of $7.98 million, while BTC sold assets worth $8.77 million.

Notably, this was the Grayscale Mini Trust’s first outflow since it started trading on July 31. The fund, which had the lowest annual management fee, has seen a cumulative inflow of $348 million since its market debut

Bitwise’s BITB sold 147 BTC ($8.73 million) on Wednesday, while BlackRock recorded zero flows. August 28 was the second consecutive day that BlackRock, the leading asset manager by net asset, recorded zero flows.

Bitcoin ETF
Bitcoin ETF Flow Chart

Despite the outflow, US ETFs remain among the best-performing funds in the global market. After just eight months of trading, the Bitcoin products have seen a cumulative inflow of $17.85 billion and an asset under management (AUM) of $54.32 billion.

Cardano Poised for 2,200% Surge as Analysts Weigh in on Bullish Prospects

0

Cardano (ADA) has been struggling to recover from its recent seven-day losses, leaving the crypto community divided on its future trajectory. 

While some analysts forecast significant gains, others remain skeptical, pointing to ongoing bearish trends.

One analyst on TradingView, Alan Santana, has shared a detailed chart outlining Cardano’s journey through different market phases. According to Santana, Cardano has experienced a prolonged bear market, highlighted by a descending channel indicating consistent price declines. This downward trend reflects a market dominated by bearish sentiment, leading to lower highs and lower lows.

Cardano ADA
Cardano ADA

Following this phase, Santana’s chart shows a period of consolidation, where the price stabilized within a tight range. This consolidation phase is seen as a critical juncture, potentially setting the stage for a breakout. The chart then identifies an initial bullish breakout, which Santana refers to as an “appetizer.” 

This breakout suggests a shift in sentiment, hinting at the possibility of a more significant upward movement. However, Santana notes that the market is currently undergoing a minor correction, which is viewed as a temporary pause before a projected major bull market. His analysis points to a potential price surge of over 2,200%, with intermediate targets marking possible resistance levels.

The chart suggests that Cardano could potentially increase by $1.0002, reflecting a 284.58% rise from the current level, and by $1.6709, representing a 475.39% increase. These figures represent immediate targets, indicating the potential gains the cryptocurrency might achieve as it progresses toward a new all-time high by 2025.

Bullish Sentiment is Shared 

In contrast, Aryan, a well-known analyst famous for identifying potential high-return investments, suggests that Cardano could achieve substantial gains if Bitcoin reaches $500,000. 

Aryan’s analysis indicates that ADA could reach a staggering $75, representing a 19,405% increase from its current value. This projection highlights Aryan’s belief that Cardano could significantly outperform Bitcoin in this scenario, despite Bitcoin requiring a much smaller percentage gain to hit its target.

Skepticism Surrounding ADA’s Future

Despite these optimistic forecasts, some analysts remain unconvinced about Cardano’s prospects. Joshua Jake, a prominent community figure, recently reignited debates by labeling both XRP and Cardano as “dead” assets. 

Jake has consistently criticized these tokens, advising investors to diversify their portfolios. His stance is supported by Raoul Pal, CEO of Real Vision, who urges investors to focus on assets with stronger momentum. Pal argues that clinging to underperforming tokens like ADA could lead to missed opportunities in the broader market.

Wealth Advisor Identifies Only Issue Regarding Judge Torres XRP Ruling

0

Famous wealth advisor Mickle says Judge Torres’ decision concerning the secondary market trading of XRP does not establish a binding precedent for other courts to follow. 

Mickle made the assertion while reacting to a comment from famous crypto YouTuber Wendy O, who acknowledged the importance of XRP’s non-security status in the secondary market. According to Wendy O, this classification is important to the broader crypto and NFT (non-fungible token) industry. 

The comment suggests that the classification could impact how other digital assets could be treated. 

The Issue 

Reacting to the development, Mickle said the only problem with the “ruling” is that it came from a district court. According to him, any ruling issued in a district court cannot set a binding precedent. 

He suggested that if the SEC appeals the ruling and loses the case against Ripple in the Second Circuit Court of Appeals, it will automatically become binding on other courts. 

The expert added that this potential outcome could deter the SEC from appealing the Ripple case, as it could impact the regulator’s future cases against other crypto-related entities. 

SEC Cannot Appeal Secondary Market Sales of XRP  

Mickle’s speculation on the matter triggered reactions from XRP proponents, including top lawyer Bill Morgan. In a tweet yesterday, the top lawyer emphasized that Judge Torres did not issue a decision regarding the secondary market sales of XRP; hence, the SEC cannot appeal the ruling. 

He asserted that the judge only addressed programmatic sales of XRP conducted on digital exchanges by the issuer, Ripple. This indicates that the SEC cannot appeal the overall secondary market sales of XRP since the judge did not issue any decision on the matter. 

It bears mentioning that the SEC case revolves around Ripple’s sales of XRP. As a result, the judge limited her decision to the facts of this fact. The judge declared that Ripple’s programmatic sales and other distributions of XRP were not securities transactions. However, she held that Ripple violated the law through its past institutional sales of XRP. 

Court Cites Ripple Decision 

Although the verdict was issued by a New York District Judge, other district courts have cited the ruling as precedent. 

As reported earlier, Judge Amy Jackson, the ruling judge in the SEC v. Binance lawsuit, leveraged Judge Torres’ programmatic sales decision to discard the regulator’s claim about secondary market sales of BNB. 

Peter Brandt: Ethereum Short-Selling Opportunity Remains Valid Until $2,830 Breakout

0

Veteran trader Peter Brandt identifies $2,830 as a critical level for Ethereum (ETH), stating that the short-side trade is invalid if ETH moves above this threshold.

Despite the dovish sentiment expressed by Federal Reserve Chair Jerome Powell, the price of Ethereum (ETH) remains under pressure, with several analysts predicting further declines in September. 

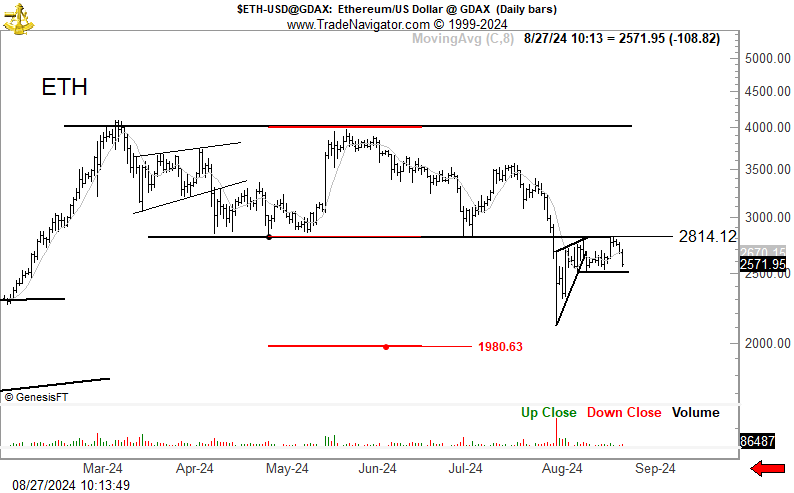
According to a recent analysis by prominent market analyst Peter Brandt, Ethereum is facing significant resistance at the $2,814 level. This level has been tested multiple times, and the current price action shows ETH hovering just below this critical threshold.

Brandt views ETH as a well-defined short-selling opportunity, suggesting that a break above $2,830 would invalidate this trade. Conversely, if selling pressure persists, Ethereum may experience a further decline towards the $1,980 support level.

Ethereum chart analysis by Peter Brandi

In response to a user’s inquiry about the bearish outlook for Ethereum, Brandt attributed it to a straightforward imbalance in market sentiment: sellers are currently more motivated to sell than buyers are to buy.

On-Chain Data Confirms Selling Pressure

Supporting Brandt’s bearish outlook, IntoTheBlock’s netflow metrics for large ETH holders reveal sustained selling pressure on Ethereum. The negative netflow trend over the past few months indicates that large holders have been consistently offloading more ETH than they’ve been accumulating, reinforcing the notion of persistent selling activity.

Over the past 30 days, netflow decreased by 76.53%, further confirming that sellers have been more persistent in offloading their assets.


Screenshot 2024 08 29T112107875
ETH Netflows / IntoTheBlock

Furthermore, several prominent Ethereum whales have been offloading their holdings on centralized exchanges, particularly on Binance. Two significant transactions stand out: the Ethereum Foundation’s sale of 35,400 ETH, valued at approximately $95 million, and Jump Trading’s disposal of 88,900 ETH, worth around $276 million.

These substantial sales, coupled with other large transactions, have likely contributed to the recent downward pressure on ETH’s price.

Traders Remain Cautious 

In a separate analysis, Michaël van de Poppe, founder of MN Consultancy, suggested that ETH could see a recovery if it breaks through the $2,550 level, potentially reaching $3,000. Yet, he advised traders to remain cautious and seek confirmation of any breakout before committing to new positions.

At press time, Ethereum has seen a 2.8% uptick in the last 24 hours, trading at $2,551.

Shiba Inu Eyes $0.000015 With Short-Term Triangle Breakout 

Amid a bearish patch for meme coins and altcoins, Shiba Inu prepares for a price jump against the broader market sentiment.

With a breakout run in the shorter timeframes, the meme coin prepares for a bullish domino effect. Will the minor push in recovery result in a price jump to levels above $0.000015 for Shiba Inu?

Recovery Run Begins For Shiba Inu

Shiba Inu shows early signs of a recovery run, with a 2.09% intraday growth. Currently, the meme coin is trading at $0.00001415, and a bullish candle is in the making. 

The bullish candle after a Doji candle formed yesterday with a 0.73% growth follows the 5.82% crash on Tuesday. With this bullish recovery, a Morning Star pattern is forming over the daily chart. The meme coin has increased by 2.48% in the last 24 hours. 

Shiba Inu Price Chart

The bullish recovery comes as a potential bull cycle within a larger falling wedge pattern in the daily chart. However, in the 4-hour chart, the bullish recovery in Shiba Inu comes after taking support at the 23.60% Fibonacci level, based at $0.00001331. 

With a streak of four bullish candles, the meme coin has increased by 5.52% over the last 12 hours. This marks a bullish reversal in action, ready to challenge the 38.20% Fibonacci level at $0.00001457.

Triangle Breakout Run in 1-Hour Chart

A closer analysis revealed that the 1-hour time frame reveals a bullish breakout of a long-coming resistance trendline and a triangle pattern. The bullish reversal forms a support trend line as well, and the breakout rally continues to gain momentum. 

Shiba Inu Price Chart

The RSI line in the 4-hour and 1-hour price charts confirms a bullish trend surpassing the halfway line. Further, the uptrend begins with a successful bullish divergence. 

As the recovery run gains momentum, the upside resistances based on the Fibonacci level, apart from the 38.20% level, are at 50% and 61.8%, corresponding to the price thresholds of $0.00001560 and $0.00001662, respectively.

On the downside, the support levels are present at the 23.60% level, in brackets $0.00001331 and $0.00001127.

Persistent Bearish Pressure Puts Polygon (MATIC) at 19% Downside Risk: Details

Will the streak of bearish candles continue as the downside risk in Polygon (MATIC) rises to 19%?

Amid the broader market crash, Polygon failed to uphold the recent 44% price jump registered over the past week. As the Polygon price records a 22% fall in four days, the bearish trend continues to gain momentum. 

Will Polygon survive the bearish trend for a bounce back?

Retest Phase for Polygon

Currently, the Polygon trades at $0.4325 with an intraday drop of 3%, forming the fifth consecutive bearish candle. In the daily chart, the bull run last week led to a breakout of the 50-day long-coming falling channel pattern. 

Polygon Price Chart
Polygon Price Chart

However, the bull run failed to surpass $0.60, resulting in a quick decline to the broken resistance trend line. As a retest, the high momentum teases a bearish continuation. 

The daily RSI line shows a quick decline from the overbought zone to crashing under the 50% halfway line. The MACD indicator shows a quick reversal in the MACD and signal lines, leading to a bearish crossover. Hence, with a quick shift in the underlying sentiments, the Polygon price warns of a bearish continuation.

Signs of Recovery in Polygon Network

Amid the correction phase of MATIC, Santiment highlights the Polygon network’s declining trend since the broader market pullback starting in March. However, signs of recovery are emerging with increased dominant coin movement and a spike in active addresses on the Polygon network.

Notably, active addresses reached their second-highest level in 2024, with 3,369 MATIC addresses, and there was significant movement involving 69 billion MATIC tokens.

Where is Polygon Headed?

Based on Fibonacci levels within the falling channel pattern, the bearish trend in Polygon’s price has failed to reach the 38.20% Fibonacci level near $0.60 and has broken below the 23.60% level at $0.50.

The next support levels for the altcoin are at $0.40, with a baseline at $0.38 and a further downside risk to $0.3649, representing a 19% decline. In the event of a post-retest reversal and broader market recovery, the next resistance levels are at the 23.60% Fibonacci level at $0.50 and the 38.20% level at $0.60.

Here Are Reasons Of Bitcoin Immense Selling Pressure

0

Despite multiple selling pressures, Bitcoin has stayed profitable this year, with an almost 30% increment year-to-date.

Bitcoin has had an eventful year filled with ups and downs. Yet, an investor who bought the asset at the start of the year would have almost a 30% return on investment.

Bitcoin dipped in August for several reasons, and selling pressure from large Bitcoin holders was a major factor. Sales from the German and United States governments, Mt. Gox’s distribution to creditors, and the Japanese Yen carry trade have all contributed significantly to Bitcoin’s poor performance.

Resilient Bitcoin

The German government started dumping Bitcoin seized from Movie2K, an online film piracy platform. According to reports, Germany’s Federal Crime Police Office (KBA) seized 50,000 BTC from the scam project.

In June, the on-chain wallet tied to the German government started selling bitcoins, dumping them incessantly in the open market. Within a few weeks, they sold all 5,000 BTC, causing a scare in the crypto market and affecting Bitcoin’s price.

While the German government was selling, its US counterpart joined the spree and began selling its Bitcoin stash. An earlier report showed that the country’s on-chain wallet sent 10,000 BTC ($593 million) to Coinbase Prime for sales after sending 3,940 BTC ($240 million) to the same exchange in late June.

To add to the FUD, Mt. Gox started reimbursing Bitcoin worth $9 billion to its creditors. The defunct exchange has distributed over $7 billion worth of Bitcoin to users affected by its closure and currently holds 44,899 BTC ($2.68 billion).

Other macroeconomics, like the Japanese Yen carry trade backfire, also affected risk assets like Bitcoin, causing further sell-offs. Notably, Bitcoin has withstood all this selling pressure, correcting just 18.5% from its all-time high and 16% from its price in early June.

What Next for Bitcoin

With improved macroeconomics, Bitcoin is tipped to rally soon. The Federal Reserve System (Fed) chair, Jerome Powell, recently said that the time has come to cut rates. If the federal agency slashes the interest rate in September, risk assets like Bitcoin could rally significantly.

Also, the fourth quarter of the year has been one of Bitcoin’s most performing periods. Bitcoin has historically rallied towards the end of the year, with the asset growing 3.91%, 28.52%, 8.81%, and 12.18% in September, October, November, and December 2023.

Bitcoin Chart
Bitcoin’s Performance Chart

Uphold’s XRP to $1,000 Prediction Gains Momentum Again

0

Some XRP proponents have recently brought back into discussion statements from the well-known American exchange Uphold regarding the possibility of XRP reaching $1,000.

In a post on X, an XRP community member revisited past commentaries where Uphold had sparked conversations about XRP’s future. Between 2020 and 2021, Uphold repeatedly asked XRP enthusiasts what their first action or reaction would be if XRP were to reach a price of $1,000.

“What’s the first thing you’d do if XRP reached $1,000?” Uphold would ask in some instances. This inquiry often garnered reactions from XRP enthusiasts, with some humorously commenting that they would retire, travel, and buy holiday homes around the world.

Commenter Brilliant Stefan joked that if XRP reaches $1,000, he would keep only a tiny fraction of the gains for himself, donating 95% of his 5% share to charity and using the remaining amount to buy a pack of cigarettes and a Pepsi.

Uphold XRP $1000 comments

What XRP At $1,000 Means

For context, XRP is trading at around $0.575 today. If it were to attain $1,000, this would represent a return on investment of 173,813%. In this hypothetical scenario, even a $100 investment in XRP today would be worth $173,813.

Given the magnitude of this potential return, members of the XRP Army continue to revisit these past inquiries from Uphold.

However, some have gone so far as to misattribute a prediction to Uphold, claiming the exchange has forecasted that XRP would reach $1,000, which is not the case. For instance, in the latest reemergence, pseudonymous X user “Ripple Effect” stated, “XRP will hit $1,000, Uphold told you.” 

However, in each instance where Uphold mentioned $1,000 in relation to XRP, the exchange simply posed a question. Nevertheless, ambitious community members repeatedly took it as a forecast for XRP.

This sentiment first gained traction after Ripple and Uphold announced a partnership in Q4 2023, where the exchange was set to serve as one of Ripple’s partners for U.K. and U.S. financial institutions for XRP-based money transfers.

Based on this, the XRP Army found reasons to believe that Uphold’s repeated inquiries about XRP reaching $1,000 contained hidden messages.

Uphold Does Not Make Crypto Forecasts

However, Uphold has recently publicly stated that it does not make projections for cryptocurrencies. The clarification came after an incorrect $10,000 XRP prediction was attributed to the exchange.