Home Blog Page 1288

Massive Acquisition: Largest Dogwifhat Holder Buys 21.9M More WIF

0

In the past 24 hours, dogwifhat (WIF) has experienced sideways trading, yet whales continue to accumulate the asset. 

The largest WIF holder, who has amassed over $68 million in profit, has been actively increasing their holdings. Notably, this whale deposited 21.9 million WIF, valued at $35.48 million, into Kamino over the past three days. 

This move was followed by the borrowing of 3.24 million USDC. The whale then used 2.7 million USDC to buy an additional 1.8 million WIF.

Transactions and Long-Term Accumulation

This whale’s activity stretches back months and involves strategic buying and accumulation at various stages. For instance, between December 13 and 15, 2023, the whale acquired 19.86 million WIF at just $0.0114, amounting to a $226,000 investment.

Further, in another transaction, the whale registered the domain “binance-insider.sol” and executed a large purchase of 17.23 million WIF by spending 86,738 SOL, valued at $8.92 million.

The whale’s current holdings now stand at 27.2 million WIF, valued at $44.36 million.

During this press, the price of dogwifhat (WIF) was at $1.60, with a 24-hour trading volume of $372,788,609. The token has seen a minor decline of 2.29% in the past 24 hours but retains a 9.78% increase over the past week. 

Open Interest and Futures Markets Remain Steady

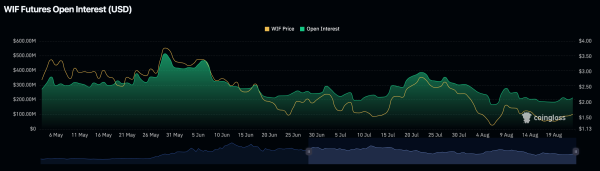
WIF investors remain engaged in derivatives markets, particularly futures. Notably, open interest in WIF futures has oscillated between $200 million and $400 million, despite price fluctuations.
Screenshot 14
WIF Open Interest | CoinGlass

In July, open interest saw a resurgence as the price rose from $1.50 to $2.50. This continued interest suggests investors maintain confidence in the token’s potential, despite some short-term volatility.

Additionally, in May, as reported by The Crypto Basic, investors in Dogwifhat derivatives markets were still increasingly directing capital into WIF futures contracts, expressing optimism that Solana’s popular memecoin will soon resume its upward trend.

Binance Coin Targets $710 Amid Strong Recovery Week

Binance Coin surges 25% in seven days, challenging key resistance with the potential to reach $710 and beyond. 

With the crypto market sustaining above the $2 trillion valuation, Bitcoin baffles investors near $60K. As the firstborn crypto fluctuates above $60K, Binance Coin shows a breakout rally ready to surpass $600. Should you consider buying the BNB token before the bull resumes? 

Weekly Gains Continue for Binance Coin

The BNB coin price has increased by 43.60% over the past three weeks due to a bullish recovery. Further, the recovery forms a morning star pattern in the weekly chart and is continued by a bullish engulfing candle. 

Binance Coin Price Chart

This week, the BNB price has increased by 8.81%. In the broader picture, the weekly chart reveals a double bottom formation with a long tail near the 50% Fibonacci level at $434.2.

As the bullish resurgence propels the BNB coin price higher, the chances of the $662 breakout or the 100% Fibonacci level increase. Supporting the bullish trend, the positive alignment of the crucial weekly exponential moving averages in (20,50,100,200) and a positive crossover in VI lines tease a potential crossover.

Closer Look Over the Double Bottom

In the daily chart, the BNB coin price showcases a double bottom pattern with a slight modification. Based on the Fibonacci level, the neckline of the double bottom pattern is near the 50% line, which is $587. 

Binance Coin Price Chart

The Binance Coin price is currently trading at $578 with an intraday pullback of $0.81. Further, the bullish recovery from the $464 support level is challenging the overhead neckline with a 25% jump in the last 17 days. 

The general market sentiment expects a favorable breakout as the bullish momentum rises. However, a potential retest of the 50% Fibonacci level is possible before asserting dominance over the $600 psychological mark. 

Will Binance Coin Price Hit $700?

The daily RSI line is close to approaching the overbought zone, but a minor dip reveals a gradual surge in bullish momentum to avoid any significant crash. Furthermore, the VI line sustains a positive alignment with the ADX line and is ready to bounce back. 

Hence, the momentum indicator supports the bullish trend in motion. 

Based on the Fibonacci levels, the upside target for the Binance Coin price is $710, $777, and $863, which are the 100%, 1.272, and 1.618 Fibonacci levels, respectively.

TONCOIN Price Prediction: TON Struggles to Break $8 Amidst Weak Network Activity

Toncoin price saw a modest recovery on August 23, climbing 3.5% to trade above $6.60. This gain follows a rough start to the week, where the cryptocurrency experienced a 9.5% drop. However, diminishing Toncoin network activity suggests that this recovery may be short-lived, with the potential for further declines.

Toncoin Buyers Show Signs of Fatigue

As the cryptocurrency market recovered from the August 5 crash, Toncoin, along with Litecoin and XRP, quickly became top gainers. While XRP’s rally was fueled by a favorable court ruling in the Ripple vs. SEC case, Toncoin price benefited from Russia’s new law legalizing crypto mining on August 8, which also provided a boost to other Proof-of-Work (PoW) coins like Litecoin and Bitcoin.

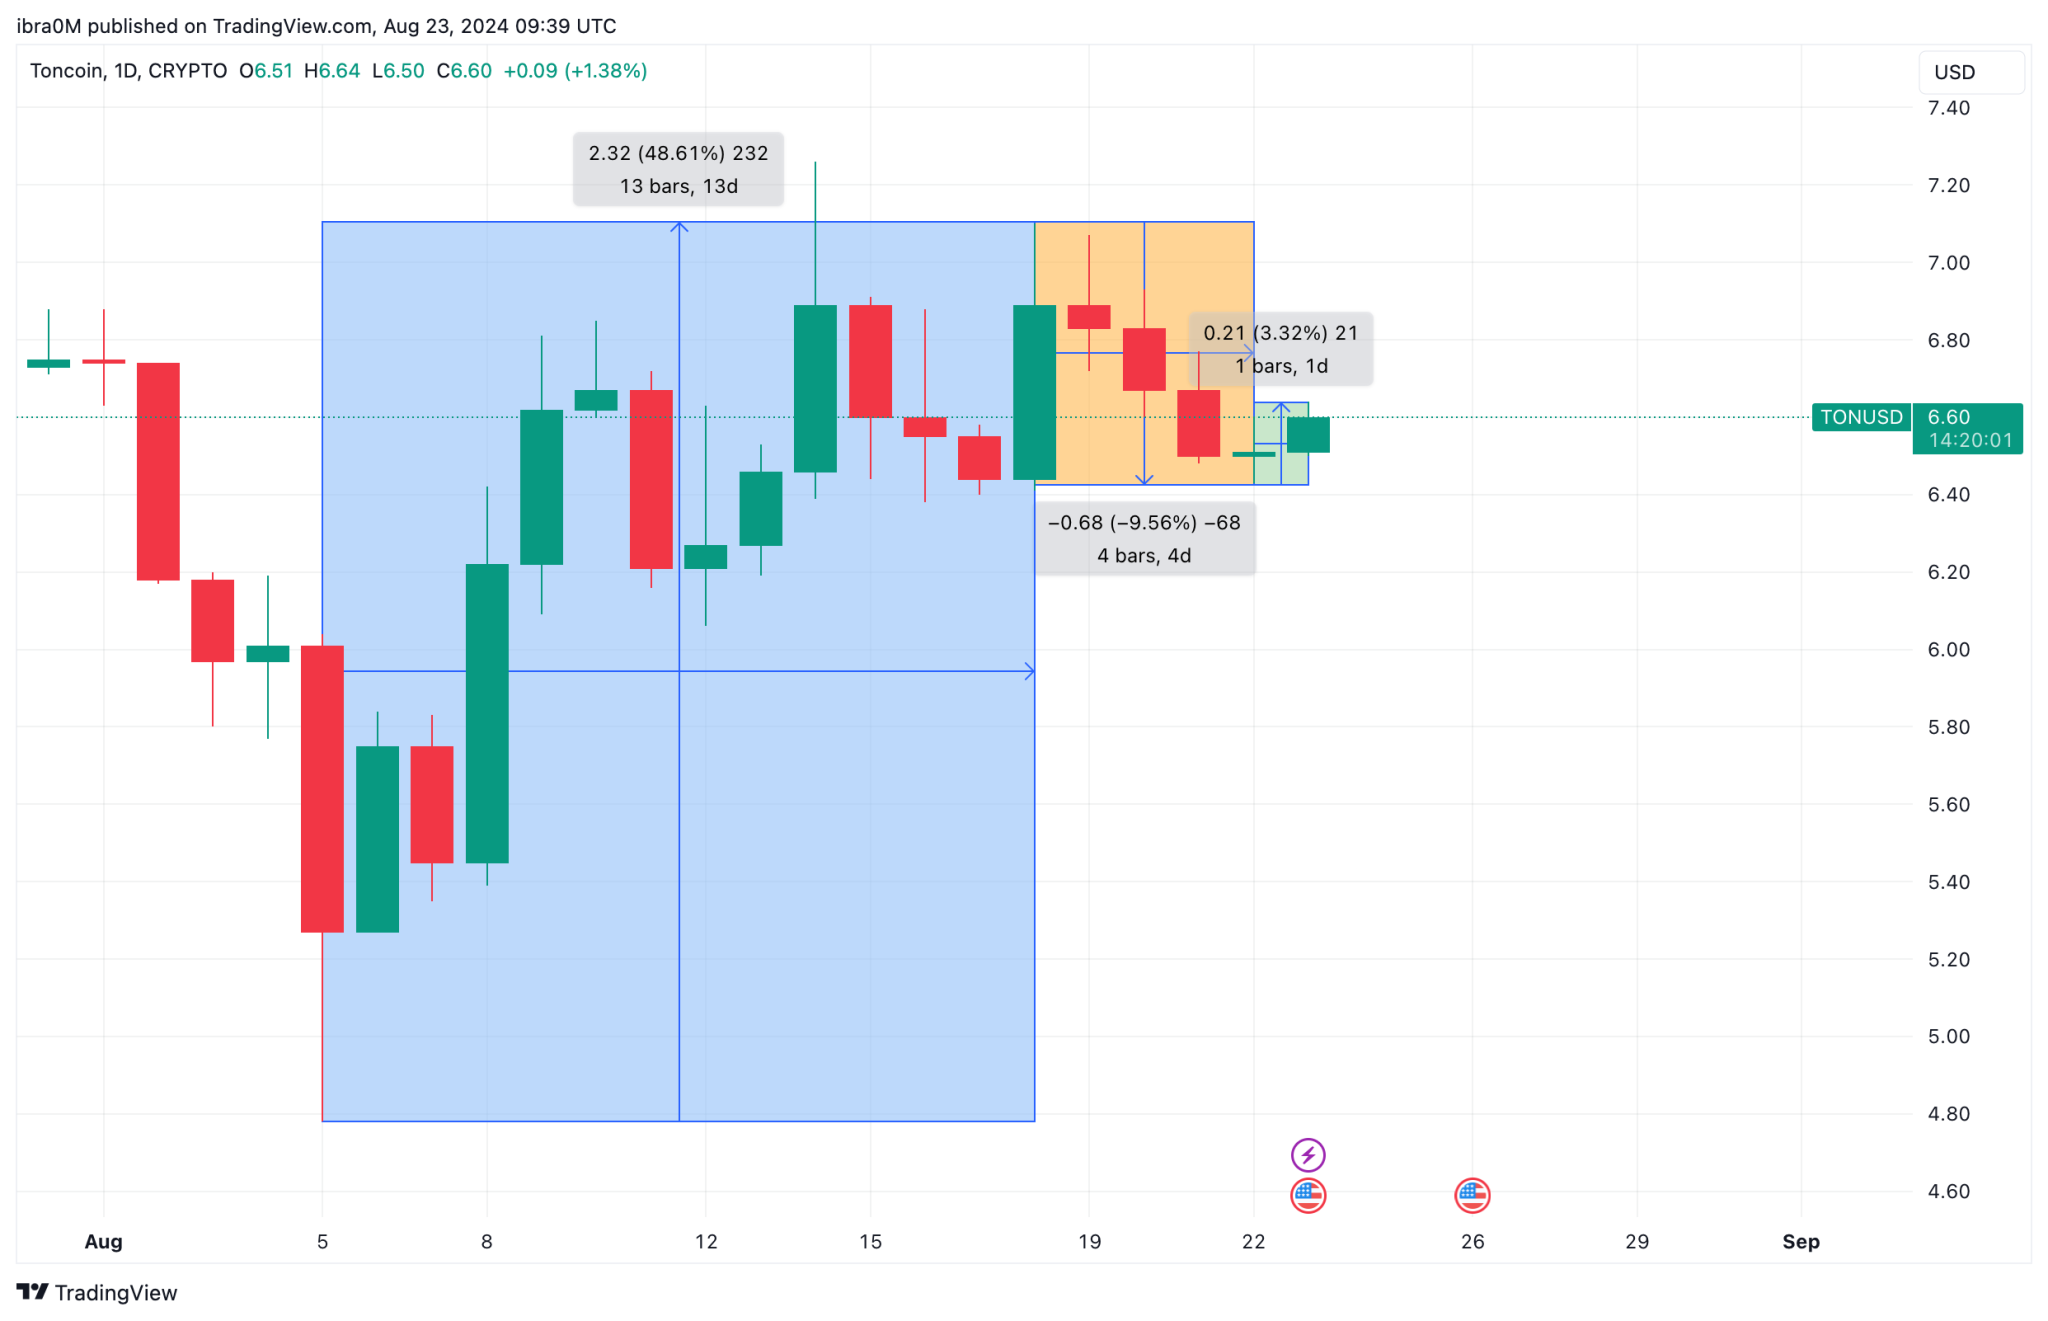
Toncoin Price Action | TONUSD | TradingView

Given Toncoin’s strong ties to the Russian market, the cryptocurrency outperformed both Bitcoin and Litecoin. After a volatile start to the month, Toncoin price dipped to a three-month low of $4.78 on August 5. However, a sharp 48% recovery pushed it back to $7.10 by August 19. As of August 23, Toncoin’s price is holding at $6.60, reflecting a 3.5% increase over the past 24 hours. Despite this short-term gain, the market appears to be entering a consolidation phase.

The recent consolidation suggests that many short-term traders, who bought Toncoin during the early August dip, are now cashing in on their profits. Toncoin price slipped below $6.50 on August 22, following four consecutive days of losses, marking a 9.5% retracement since August 18.

The inability to break past the $7.50 resistance level has dampened bullish momentum. Without fresh bullish drivers, Toncoin prices could face additional downward pressure in the coming days.

Toncoin Network Activity Plummets 40%

The recent Toncoin price surge was largely driven by speculative traders capitalizing on bullish news from Russia’s crypto mining legalization. However, on-chain data reveals a significant drop in Toncoin network activity, which could limit further price gains.

The Network Fees metric provides critical insights into investor behavior in response to market conditions. Although bulls led the Toncoin price to a 48% rebound from August 5 lows, the focus has shifted towards speculative trading, reducing fundamental network engagement.

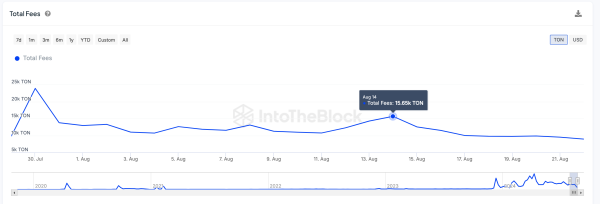
Toncoin Network Activity | IntoTheBlock

Between August 14 and August 21, Toncoin network fees decreased sharply from 15,650 TON to 9,500 TON, a 40% drop. This decline in network fees, which reflects economic activity on the Toncoin network, raises two primary concerns.

First, it indicates reduced transaction volumes, which may signal declining interest among investors. Historically, such declines in network activity have often preceded major price corrections, as reduced network engagement typically correlates with lower demand for the asset. Second, the decline could suggest that speculative traders are exiting their positions, potentially leading to increased selling pressure.

TON Price Prediction: Further Downside Possible

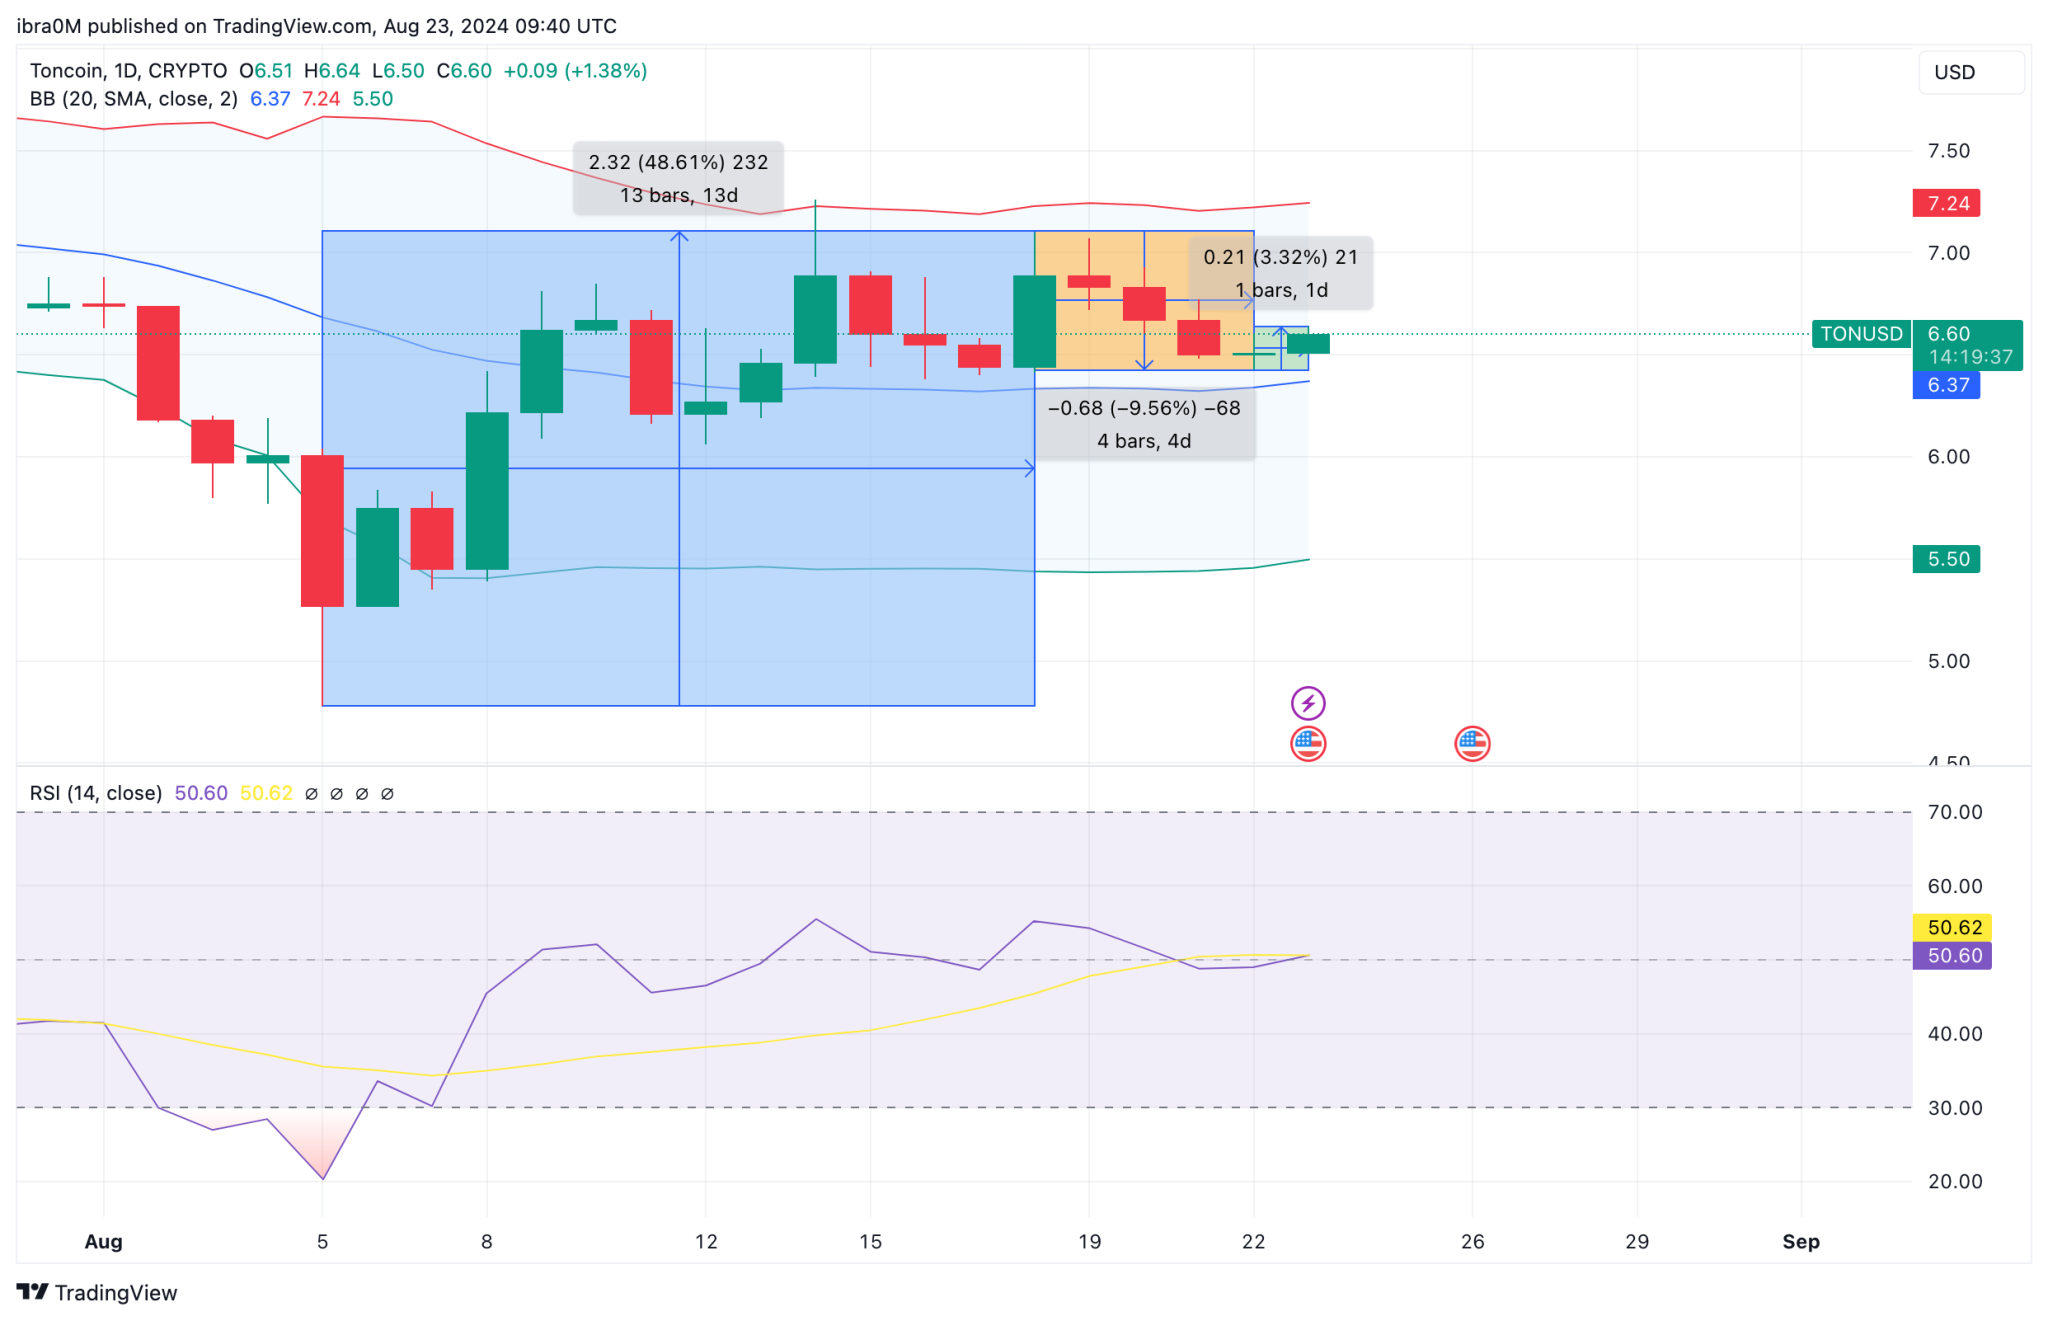
The technical outlook for Toncoin price suggests potential further declines, with the possibility of retesting the $6 support level. Technical indicators point to a bearish trend, with the Relative Strength Index (RSI) at a neutral 50.60, showing a lack of strong momentum in either direction.

Toncoin Price Prediction | TONUSD

Toncoin price faces significant resistance at the $7.50 level. Failure to breach this resistance could trigger more selling, pushing the price toward the $6.37 support. A break below this level could see Toncoin price falling further, with $6.00 serving as a critical support zone.

In conclusion, the Toncoin price may struggle to maintain its recent gains amid declining network activity and a lack of new bullish catalysts. Without renewed buying interest, a retest of the $6 support level seems likely in the short term.

Shiba Inu Silent Accumulation Phase Eyes 330% Surge

0

Shiba Inu (SHIB) has been experiencing a sideways trading pattern in recent weeks, signaling a potential accumulation phase that analysts believe could end with a 330% surge.

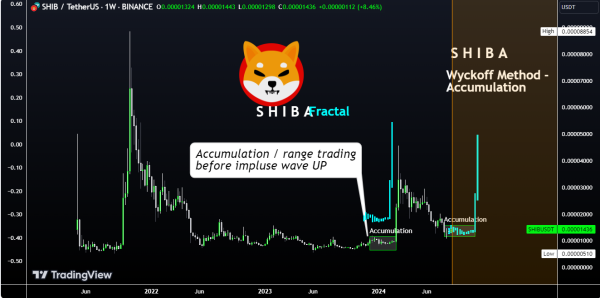
This ongoing phase is characterized by low volatility and reduced trading volume as larger investors accumulate positions without significantly moving the price. According to analysts, the current trend could indicate an imminent spike similar to the one observed in February.

Supporting this theory, TradingView analyst CryptoCheck recently applied the Wyckoff Method’s Accumulation Phase to SHIB’s price chart. Notably, this seeks to highlight that large investors are intentionally suppressing SHIB’s price, keeping it within a narrow trading range to allow themselves time to accumulate positions.

The analysis identified two distinct accumulation periods. The first occurred between late 2023 and early 2024, which was followed by a massive Shiba Inu breakout in late February to early March. In particular, the silent accumulation resulted in an over 330% surge in SHIB’s price in less than two weeks.

Shiba Inu Could See Similar 330% Soon

Currently, a similar consolidation phase is underway, with large investors quietly accumulating SHIB. According to the analysis, Shiba Inu may be poised for another significant price increase, potentially mirroring the 330% gain seen in February.

Given that CryptoCheck believes a Shiba Inu breakout is imminent, he has set his target at the $0.00005 range. This would represent a substantial increase from Shiba Inu’s current price of $0.0000143.

Screenshot 2024 08 23T123328567

Profit-Taking Targets for Shiba Inu Longs

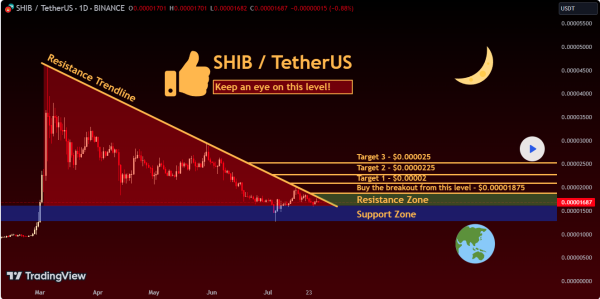
Meanwhile, another analyst, MBM Crypto, identified key resistance and support zones for Shiba Inu. He noted that a descending trendline has suppressed Shiba Inu’s price since April 2024.

This trendline has consistently acted as a ceiling for price movements, pushing the price lower each time it approached. However, he also pointed out that breaking above this trendline could shift market sentiment from bearish to bullish.

Screenshot 2024 08 23T125825162

Analyst Discuss Potential Breakout Targets

MBM Crypto further shared a potential breakout strategy for SHIB traders. He suggested entering long positions once Shiba Inu’s price breaks above the resistance zone of $0.00001875.

His analysis sets three price targets for taking profits after the breakout: $0.00002, $0.0000225, and $0.000025. These levels correspond to key resistance points where traders may face selling pressure. 

Donald Trump Promotes New Family Crypto Business, “The DeFiant Ones”

0

Donald Trump promotes his sons’ endeavor to disrupt the traditional financial system with their new DeFi project.

Former US President Donald Trump has taken to social media to promote “The DeFiant Ones,” a new decentralized finance (DeFi) project tied to his sons. The Republican candidate made his first-ever social media crypto promotion on a Thursday post on his Truth Social handle.

Trump called out the big banks and leading financial systems in the post, stating the new family business would help take a stand against their inappropriate operations. Alongside the Truth Social update was a #BeDeFiant hashtag and a link to the project’s official Telegram channel.

His sons, Eric Trump and Donald Trump Jr., have long teased the new crypto project, making bold statements on how it would affect elite banks. However, the duo has not disclosed what the project fully entails.

Digital Real Estate

In an exclusive interview with the New York Post, Eric gave a sketchy overview of the family’s new adventure, likening it to digital real estate. He described the project as “equitable” and said it would be accessible to every user, irrespective of location.

Eric shared a similar stand with his father’s Thursday post, stating it would disrupt the traditional financial system. He said that the project would allow Americans access to loans in no time, and the criteria for this would be based on pure math and not policies. According to him, the banking sector will not be ready for what their new project will bring with it.

Notably, Eric’s mention of digital real estate could mean real-world asset (RWA) tokenization, a sector gaining community traction. The RWA sector has grown significantly recently, following the involvement of leading asset manager BlackRock. RWAs have a total locked value of $6.435 billion.

At the time of writing, the DeFiant Ones’ official channel had 39,738 members. Notably, the group was launched on August 7, and Trump’s sons posted an X link to it eight days later.

Trump’s involvement in cryptocurrencies has heightened following his recent ploy to become America’s next president. He spoke at the Bitcoin Conference in Nashville, where he announced his plans to adopt Bitcoin as a strategic reserve for the United States.

Analyst Says XRP to $100 as XRP Needs Only 4% Rise to Break 2,424-Day Resisting Trend

0

XRP price action has entered a critical phase as it continues to move sideways. 

Analysts, including Javon Marks, suggest the potential for a significant breakout, with XRP sitting at a key technical juncture.

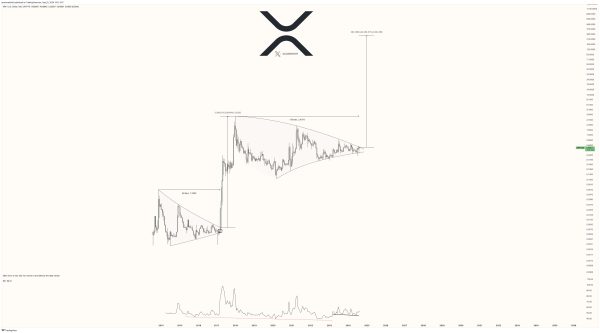
Marks highlights a possible 3-4% upside that could break XRP out of a 2,424-day resisting trend, signaling a bullish wave not seen since 2016-2017. This long-term symmetrical triangle formation has been ongoing since XRP’s bull run in 2017.

Breakout Potential Amid Market Consolidation

Marks’ chart indicates that XRP’s price is nearing the apex of this symmetrical triangle. According to him, a measured move target based on the height of the consolidation could push XRP prices by over 42,000%, potentially adding $262 to its current price.

Although this scenario would represent an extraordinary surge, it is important to note that such a rally was previously observed in 2017 after an extended period of consolidation.

GVl4k9BXsAAVrpK
XRP Price Chart

In another post, Marks noted that the most recent price activity has shown that XRP temporarily broke out, although it proved to be a false breakout. Nevertheless, Marks continues to observe bull divergences in both Price Action and the RSI, which suggests a more convincing bullish move could be on the horizon. 

According to his analysis, a conservative target of $15-$18 is achievable with a successful breakout, potentially leading to a 2,100% gain for XRP. Furthermore, Marks emphasizes that a full logarithmic scale follow-through could elevate XRP prices to more than $100, an increase of over 20 times.

Historical Comparison and Future Projections

Meanwhile, in a separate analysis, pseudonymous analyst Mack Attack also drew comparisons to XRP’s performance during the 2017 bull run. In that cycle, XRP experienced a remarkable surge from $0.005 to a peak of $3.84, an increase of over 76,000%.

Mack Attack projects that a similar performance in the 2024/2025 bull run could push XRP to $456. However, this remains speculative as the market conditions are vastly different now.

Despite this, the analyst highlights the ongoing sentiment on social media platforms such as X, where many believe XRP could lead another bull run. 

Further Bold Predictions

Ultimately, another notable projection comes from analyst Aryan, who has listed XRP among his top picks for substantial gains in this cycle. Aryan estimates XRP could surge by 3,233% to reach $20, although it currently trades 84% below its all-time high. Aryan’s bullish forecast is based on XRP riding the wave of Bitcoin’s potential rise to $500K.

Is It Shiba Inu? Former Goldman Sachs Predicts Dogecoin Will Be Flipped

0

Murad Mahmudov identifies the biggest trick ever played on investors, asserting that Dogecoin will be flipped by a memecoin in this market cycle.  

Former Goldman Sachs analyst Murad Mahmudov says the biggest trick ever played on unwary crypto investors is the deception that Dogecoin cannot be surpassed or outperformed. 

“The biggest trick they played on you is to convince you that DOGE cannot be flipped,” Murad remarked. 

Murad’s commentary suggests that convincing people that Dogecoin cannot be outperformed is a clever manipulation to help DOGE maintain its dominance and discourage competition from rival projects. 

New Memecoin to Flip Dogecoin 

In a follow-up tweet, Murad indicated that his statement is focused on Dogecoin’s dominance in the memecoin market. Interestingly, the analyst speculated that another memecoin will flip Dogecoin in the 2024/2025 market cycle. 

For context, proponents of the Elon Musk-backed memecoin championed this deceptive belief that Dogecoin could never be flipped. However, Shiba Inu (SHIB) silenced them in October 2021, becoming the first memecoin to overtake DOGE. 

On October 27, 2021, Shiba Inu staged a 45% daily growth, which took its market cap to $32.7 billion. This rally saw Shiba Inu dethrone Dogecoin, which boasted a valuation of $32.1 billion at the time. The next few days saw both Shiba Inu and Dogecoin struggle to be the premier memecoin on the market. 

As many Shiba Inu investors took profit, SHIB’s price plunged heavily, thus helping Dogecoin cement its place as the most valuable memecoin. 

Can Shiba Inu Replicate Its 2021 Feat? 

At the time of writing, Dogecoin is ranked as the biggest memecoin, with a market cap of $15.67 billion. Conversely, Shiba Inu, which boasts a valuation of $8.48 billion, ranks as the second-biggest memecoin. Pepe (PEPE) is the third-biggest memecoin, with a market cap of $3.43 billion. 

Despite the massive gap between Dogecoin and other top memecoins, Murad believes DOGE can be flipped in this cycle. However, he did not specify which asset might achieve this feat. 

For Shiba Inu to flip Dogecoin, its market cap of $8.48 billion must surge by at least 84.77%, potentially rising above $15.67 billion. A similar surge in Shiba Inu’s current price of $0.00001438 will see SHIB trade at $0.00002657 per token.  

Meanwhile, whether Shiba Inu might be the memecoin to flip DOGE in the 2024/2025 market cycle remains to be seen. 

Cardano Set for Breakout: Here’s The Target Price

0

While Cardano (ADA) has not been a particularly favorable asset to hold in recent days, analyst Dan Gambardello has identified a potential short-term breakout for ADA.

In his latest market update, Gambardello highlighted several key indicators and upcoming developments that could drive ADA’s price higher in the coming days.

Price Target for Possible Cardano Breakout

Notably, this month, Cardano revisited a ten-month low of $0.2799, which represented over 60% loss for investors who bought ADA in March. 

However, the asset has notably rebounded from this bottom, trading at $0.381 at press time. Yet, ADA is 9% below the value it traded four weeks ago. 

While pessimism toward ADA has heightened based on this recent price action, bullish analysts like Gambardello continue to emphasize that the asset’s trajectories are consistent with historical trends.

In his latest analysis for holders, Gambardello noted that Cardano is showing signs of bullish momentum on its technical charts. 

He noted a bullish divergence on the weekly chart, where the relative strength index (RSI) is forming a higher low while ADA’s price is making lower lows. This divergence often indicates that the downward trend is losing strength, and a reversal could be imminent. Notably, ADA has increased by 5% in the last 24 hours.

Furthermore, the analyst also pointed out that ADA is currently testing the 50-day moving average, a key resistance level. If Cardano breaks above this level, it could trigger a rally toward the $0.43 range, the analyst noted. 

Gambardello emphasized the significance of ADA attaining this threshold, suggesting it could mark a significant breakout from the symmetrical triangle pattern, potentially opening the door to higher levels.

Upcoming Chang Hard Fork Could Fuel Momentum

Furthermore, Gambardello highlighted that the upcoming Chang hard fork, scheduled for August 27, could serve as a catalyst for ADA’s breakout. The upgrade introduces a new governance system, giving the Cardano community a greater role in decision-making and management of the network’s treasury.

The analyst believes this shift towards greater decentralization could enhance market sentiment around Cardano, as it positions itself as one of the most decentralized blockchains in the crypto arena.

With the combination of bullish technical indicators and the upcoming network upgrade, Gambardello is optimistic about ADA’s short-term prospects. His target of $0.43 suggests a potential uptrend that drives ADA higher by approximately 13%. Meanwhile, he stressed that the short-term outlook is uncertain.

Wedge Breakout Fuels Polygon 30% Rally in 7 days, Eyes $0.80

With a breakout rally in the daily chart, Polygon shows a massive surge and an impressive streak of bullish candles. Will this rally hit $0.80 this month?

As the bullish influence grows over the crypto market, altcoins are heating up for a bull run. For Polygon, the recovery rally aligns with the migration from MATIC token to POL token. With a major network update, investors are expecting massive upside potential in Polygon. Will this update fuel the bull run to new peaks?

Polygon Breakout Run Exceeds $0.50

In the daily chart, Polygon reveals a falling wedge pattern, which has a bearish influence on the price trend. The downfall in the bearish pattern accounts for a 70% decline since March 2024.

However, the underlying bullish sentiments resulted in a sideways shift near the $0.38 support level. With the bullish resurgence, a double-bottom reversal propels the price for a breakout rally. Further, the bullish reversal accounts for a series of eight consecutive bullish candles and a price jump of 38.36%.

Polygon Price Chart
Polygon Price Chart

The Polygon token currently trades at $0.5424 with an intraday gain of 1.94%. Further, the falling wedge breakout rally shows a massive trending reversal and is ready to challenge the previous peak formation at $0.57. 

Polygon Price Chart
Polygon Price Chart

Regarding the technical indicators, the bullish trend momentum is rising as the VI lines give a positive crossover. Furthermore, the series of consecutive bullish candles exceeds the 20-50-day EMA and challenges the 100-day EMA. 

The Shift from MATIC to POL

The ongoing bull run comes with a highly anticipated migration from MATIC to the POL token in the Polygon network on Sept. 4. In the first phase, POL tokens will replace the MATIC tokens as the native gas and staking tokens for the Proof-of-Stake Polygon network. 

As the scheduled date inches closer, the bull run picks up pace in the MATIC prices. Furthermore, Coinbase’s support for moving MATIC to POL boosts the market sentiment around Polygon. Coinbase will begin the Polygon migration by changing the ticker from MATIC to POL starting Aug. 26. 

Will Polygon Reach $0.80?

Based on the Fibonacci retestment over the correction phase, the bullish trend, reclaiming the $0.50 psychological mark, exceeds the 23.60% level. Currently, Polygon is heading towards the $0.60 or the 38.20% level.

If the bullish momentum sustains, then the 50% and 61.80% levels at $0.69 and $0.80 are potential upside targets. Hence, the upside potential for the Polygon token is up almost 50%.

XRP Price Fluctuations are Irrelevant as Google’s Early Volatility, Crypto Executive Says

0

Former Bitfury CEO Brian Brooks believes the price fluctuations of crypto assets like XRP are as insignificant as the early volatility of Google’s stocks.

Brooks shared this perspective in a discussion at The Aspen Institute, clarifying the core purpose of cryptocurrencies. According to him, the focus on short-term price movements detracts from the broader mission of cryptocurrencies. 

XRP Price Is As Irrelevant as Google’s Early Volatility

Brooks stressed that the real value of crypto like XRP lies in its potential to replace centralized financial systems with decentralized networks that prioritize user control over bank CEO control.

During the discussion, he highlighted that most people misunderstand cryptocurrencies, believing their success hinges on their ability to replace fiat currencies like the U.S. dollar. However, he argued that this is a narrow perspective. 

“The biggest misunderstanding of this whole discussion is the belief that if crypto is not doing a great job of replacing the US dollar, then it’s failing in its mission,” Brooks stated. 

Instead, he drew a compelling analogy between the early volatility of Google stocks and the price movements of digital assets like XRP.

Brooks pointed out that cryptocurrencies are more akin to internet stocks—investments in the future of digital and decentralized networks. 

Just as one would invest in Google based on the anticipation of increased internet traffic, investing in cryptocurrencies reflects a bet on the growing adoption of decentralized financial systems.

“So, for me, prices are not that relevant—no more than Google’s volatility was. In the early days of Google, that was super volatile,” Brooks remarked.

Essentially, the industry pundit believes the price fluctuations in crypto markets are secondary to their fundamental purpose and that the volatility of cryptocurrencies like XRP has little bearing on their overall significance.

Bearish Market is Good Time for Business, Ripple Exec

It is worth noting that Brian Brooks’ comments on the irrelevance of crypto volatility were made during the depths of the previous bear market.

At the time, assets like Bitcoin, Ethereum, and XRP had suffered significant losses from their earlier highs. Although the market has since shifted to a bullish trend, volatility remains a concern, particularly on the downside.

Market analyst Collin Brown recently revisited Brooks’ sentiment, cautioning investors to look beyond XRP’s current price action. 

This advice comes as XRP is currently trading at $0.6, a staggering 84% decline from its all-time high of $3.84. This drop has understandably hurt earlier investors.

Meanwhile, Brooks Entwistle, a senior vice president at Ripple, who was also present at the conversation with Brian Brooks, expressed that periods of volatility are not only normal but also beneficial for the industry in the long run. 

“Winter time is a fabulous time to build businesses and to really define use cases for digital assets,” he said.