Home Blog Page 1290

XRP to $20 if Bitcoin Reaches $500K, ETH $20K, and SOL $2K: Analyst

0

A widely followed analyst in the crypto community has suggested that XRP could reach $20 by the end of this ongoing bull market, particularly when Bitcoin attains $500K.

XRP advanced significantly this week and continued to hold steady above the $0.60 mark it recently reclaimed. At press time, XRP hovers around $0.6015 with a flat gain over the last 24 hours, though it boasts a 7% weekly gain.

Though the performance of XRP since the bull market of this year has not been very encouraging, analysts continue to predict lofty highs for the digital asset. 

XRP to $20 if Bitcoin Reaches $500K

In a list shared on X, Aryan, an analyst known for sharing crypto 100X gems, highlighted his thoughts that XRP could be worth $20 this cycle. The list included his projections for other top crypto assets like Bitcoin (BTC), Ethereum (ETH), and Solana (SOL).

Notably, XRP must surge by 3,233% to attain the $20 price point that Aryan has proposed. However, since this ongoing bull cycle began, XRP has not posted even 100% growth, making the projection a formidable feat for XRP. 

Moreover, while some analysts suggest the bull cycle is over, and the bear cycle is already underway, XRP is still trading at 84% below its previous all-time high (ATH). However, Aryan expects a turnaround for XRP.

Although he provided no specific grounds for believing XRP could attain an all-time high of $20, his analysis suggests he expects the projection to occur riding on the Bitcoin wave.

Specifically, he proposed a $500K target for Bitcoin. At its current price point of $61,000, Bitcoin needs to rally by 719% to reach this level. Notably, this is not an isolated forecast. A few other market watchers have argued the possibility of $500K for BTC this season. 

The market frenzy expected from this activity level is anticipated to spill over to top altcoins like XRP, potentially positioning them to outperform Bitcoin, as witnessed in the 2017/2018 cycle when XRP last set an ATH.

ETH to $20K and SOL to $2K

As for Bitcoin’s closest rival, Ethereum, Aryan proposed a peak in the $20K region, which demands a near 10X growth from ETH’s current price.

Meanwhile, the analyst has set his sights on the $2,000 price for Solana. This price threshold demands that Solana expand by 1,300% from its current value of around $140. 

This required percentage is not formidable for Solana, considering it has grown by over 600% since last year. Save for the recent downturn, its percentage growth neared 1,000% in Q1.
IOHK Announces Major Cardano Wallet Update as Chang Nears

0

As the Chang hard fork approaches, Input Output Hong Kong (IOHK), the development arm behind Cardano, has rolled out a crucial wallet update to Daedalus. 

IOHK recently announced the release of Daedalus 6.0.0, an important update to its desktop wallet. Daedalus 6.0.0 is a mandatory update for all users, as it is essential for crossing into the new Conway era, which will be ushered in by the upcoming Chang hard fork. 

Details of the Daedalus Update

This update is a pivotal upgrade that enhances several key components and addresses important issues that had been plaguing the wallet in the past.

The update upgrades Daedalus to node version 9.1.0 and Cardano wallet version 2024-07-27. It also brings updates to the dependent Ledger and Trezor hardware wallet libraries, ensuring that users with these devices can continue to manage their Cardano assets seamlessly.

One of the most notable fixes in this update addresses the auto-update feature in Daedalus. Users on Linux who had previously reported issues due to AppArmor compatibility can now expect a smoother experience. The auto-update feature has been refined.

However, IOHK has also cautioned users about potential delays in synchronization times. Since this update requires the ledger state to be replayed from the beginning, users might notice longer synchronization times than usual. 

For existing Daedalus users, they will receive a prompt to upgrade. However, IOHK has emphasized that new users should only download Daedalus from the official website to avoid falling victim to scams. The team issued a stern warning that any “mobile Daedalus” app is fraudulent, as Daedalus is strictly a desktop-only wallet.

Final Preparations Underway for Cardano Chang Hard Fork

Meanwhile, the team overseeing the Chang hard fork upgrade also provided an update on the readiness for the Chang hard fork. 

On Aug. 21, the working group reviewed the progress and set the proposed date for the mainnet hard fork for Aug. 27. This decision comes after careful consideration of various readiness metrics, including SPO readiness, exchange liquidity, and updates from leading DApps within the Cardano ecosystem.

The working group has scheduled a final go/no-go decision for August 23, 2024. This decision will be based on the continued momentum in achieving the desired thresholds and the status of downstream components and tooling. If everything remains on track, the Chang hard fork will proceed as planned on August 27, 2024.

Fundstrat’s Tom Lee Backs $280,000 Bitcoin Price Forecast Despite Volatility Concerns

0

Financial contributors such as Thomas “Tom” Lee, Head of Research at Fundstrat Global Advisors, have recently taken to social media platforms to share optimistic projections.

Tom Lee’s latest prediction indicates a potential Bitcoin surge to levels over $200,000, referencing insights from market observer Micro2Macro. At the same time, some analysts offer a contrasting viewpoint, suggesting Bitcoin’s growth cycles may be experiencing a period of decline.

Analysts Suggest Growth Potential

Tom Lee, known for his bullish outlook on Bitcoin, continues to express confidence in the cryptocurrency’s future, highlighting a projected Bitcoin high of $280,000. 

According to Micro2Macro’s analysis, Bitcoin’s price could reach this level based on historical chart trends, specifically related to Fibonacci extensions. Additionally, Micro2Macro suggested that a range of $148,000 to $178,000 could serve as a conservative target. 

Micro2Macro anticipates Bitcoin outperformance in the current cycle, driven by expected rate cuts and increased cyclical global liquidity, as outlined by Michael Howell of CrossBorder Capital and supported by others, including Fundstrat. 

He notes that a strong resistance level near the 0.768 Fibonacci extension could still be overshot, with potential for significant gains if Bitcoin reaches a 10x increase. However, he cautions that holding out for further doubling might lead to missed opportunities, advising that other ways to hedge are always available.

Market Cycles Bring Varied Perspectives

While some analysts express optimism, others remain cautious. Peter Brandt, a seasoned trader, warns of a different scenario, where Bitcoin might be approaching a period of slower growth. He notes that past Bitcoin cycles have demonstrated a decline in growth momentum over time. 

Citing historical patterns, Brandt emphasizes that each subsequent cycle has lost roughly 80% of the force of the previous one. This declining momentum raises concerns about Bitcoin’s ability to reach lofty all-time highs in the current cycle.

Bitcoin’s Volatility Raises Questions

Further complicating the outlook, recent market data shows Bitcoin’s price volatility has led to significant fluctuations in open interest. According to data from CoinGlass, about 2,000 BTC in open interest was wiped out during a recent sudden drop, highlighting the vulnerability of over-leveraged positions. 

This drop exposed the fragility of the market, with the rebound lacking momentum and trading volumes remaining muted. Consequently, traders are left to question whether Bitcoin can regain control or if further instability lies ahead.

Litecoin Price Prediction: Here’s Why LTC Price Failed to Reach $70 in August

Litecoin price fell below $63 on August 22, 2024, down 8% amid four consecutive losing days. On-chain data highlights profit-taking among short-term traders as the main bearish catalyst behind the ongoing LTC correction phase.

Litecoin Surrenders 8% Gains After Russia Rally

As the crypto markets recovered from the August 5 crash, Litecoin and XRP rapidly climbed the top gainers’ charts. XRP benefited from the favorable ruling in the Ripple vs. SEC case, while LTC, one of the top five largest Proof-of-Work (PoW) projects, was buoyed by Russia’s new law, which legalized crypto mining around August 8.

After a shaky start to the month, which saw Litecoin price dive to a three-month low of $50 on August 5, a remarkable 37% recovery drove it to $68 by August 18.

Litecoin Price Analysis (LTCUSD) | TradingView

However, recent trends suggest that markets have slipped into a consolidation phase over the past week as strategic short-term traders who bought LTC during the market crash in early August have begun to book profits. As of August 22, Litecoin is trading around $63, having retraced 8% over four consecutive losing days since August 18.

The failure to advance above the $70 resistance has likely triggered a profit-taking frenzy among traders. This adds to the bearish sentiment as it suggests that the market is wary of pushing LTC higher without a strong catalyst.

Litecoin Facing Sell-Pressure as Order Book Data Reflects Bearish Outlook

A close examination of Litecoin’s exchange market depth data reveals a significant bearish outlook. Two primary factors contribute to this: the substantial imbalance between sell and buy orders and the weakening demand for LTC.

First, the total sell orders outweigh the buy orders by a considerable margin, with an aggregate volume imbalance of approximately 63,000 LTC.

This is reflected in the average bid and ask prices, which are nearly identical at $63.30 and $63.33, respectively. This minimal difference highlights the lack of upward price momentum, as sellers dominate the market and suppress any bullish attempts.

Second, the weakening demand for Litecoin is evident from the dwindling buy orders, which have struggled to keep pace with the aggressive selling. The current market depth indicates that buyers are hesitant to enter the market at current levels, reflecting a broader lack of confidence in Litecoin’s short-term prospects. Without a significant increase in buying pressure, the market is likely to see further downside.

LTC Price Forecast: Bulls Battling to Hold $60 Support

With Litecoin trading around $63, the bulls are now fighting to hold the critical $60 support level. The two technical indicators on the chart—the Keltner Channel (KC) and the Parabolic SAR (Stop and Reverse)—are leaning bearish, signaling a potential continuation of the downward trend.

First, the Keltner Channel shows that Litecoin has failed to sustain its recent rally. The price has slipped below the middle line of the KC, indicating a shift in momentum toward the bears.

LTCUSD 2024 08 22 15 16 01
LTC/USD

The upper band of the KC, which previously acted as resistance near $70, remains untested as LTC struggles to maintain upward momentum. This suggests that the $70 resistance level could continue to be a strong barrier in the near term.

Second, the Parabolic SAR indicator has flipped above the current price level, confirming the bearish trend. Historically, this indicator has been reliable in identifying trend reversals, and its current position indicates that the bearish momentum is still intact. If Litecoin fails to hold the $60 support level, the next significant support is likely around $55, a level that aligns with the lower band of the KC.

In summary, the bearish setup highlighted by the market depth and the recent retracement suggests that Litecoin may struggle to regain the $70 level in the near term. The $60 level is critical, and a break below it could trigger a more extended downside move, potentially bringing LTC back to the $55-$50 range.

SunPump on Tron Sees 7,300+ Tokens Launched in 24 Hours, Generating $585,000

0

Meme coins on the Tron network are igniting excitement, injecting fresh energy amid the recent lackluster performance of Bitcoin and other major cryptocurrencies.

In a recent update, market analyst Zhusu revealed that SunPump, the pioneering meme coin platform on the Tron blockchain, has witnessed the launch of an astounding 7,351 tokens within the last 24 hours alone.

This massive launch has generated an estimated revenue of $585,000 for the platform. The analysis compares these figures with Pump.fun, a well-known platform for launching Solana meme coins.

It reveals that, in comparison, the Solana platform saw the creation of 6,701 tokens in the same timeframe, generating $366,000 in revenue.

Leading Meme Coins on Tron

Among the multitude of meme coins emerging from the Tron blockchain, only a few have achieved mainstream adoption. Market tracking platform CoinGecko currently provides data for only ten tokens, with Sundog leading the market.

Sundog, which is less than seven days old, currently boasts a market cap of $217.44 million. At its all-time high yesterday, the cap was approximately $250 million.

From its all-time low of $0.03989 last Friday, August 16, this Tron meme coin has delivered over 440% profits to early investors, with its current value at $0.217.

Interestingly, Sundog is nearly ten times larger than its closest competitor, FoFar, which has a market cap of $22 million.

Other notable meme coins on the Tron network with valuations in the millions include SUNCAT, SunWukong, BIAO, BLAKE, and SUNPEPE, all of which are also less than seven days old.

Meme Coin Impacts Tron’s Price and Network Performance

The surge in meme coin activity has had significant implications for the underlying Tron blockchain. Over the past week, Tron’s native token, TRX, has appreciated by over 20% and is currently trading above $0.155.

As of yesterday, TRX reached $0.1656, putting it just 8% away from breaking its 2021 peak of $0.18. During its recent surge, TRX flipped Cardano (ADA) to become the tenth-largest cryptocurrency by market cap.

Moreover, the increased activity on Tron due to meme coins has led to an all-time high in daily revenue for the network, exceeding $3.8 million. This figure is a staggering 7X higher than the daily revenue of $517,000 on Ethereum, the largest smart contract network.

Market Concerns on Tron Meme Coin Frenzy 

However, some market participants are apprehensive about the current meme coin frenzy on Tron. One observer pointed out that a significant number of the recently launched tokens are likely pump-and-dump schemes orchestrated by scammers. 

The commenter highlighted the irony of the situation, noting that while individuals running these schemes are condemned and labeled as scammers, the owners of the blockchain platforms that facilitate these activities are often praised. 

Meanwhile, these platform owners are profiting significantly, making hundreds of thousands of dollars each day from their customers who are being scammed.

Here’s Why the $66K to $64K Bitcoin Range is Important for the Next Big Move

0

Bitcoin would need to break above a crucial resistance level for short-term holders to take profit and bring in new funds to the market.

Bitcoin has struggled to break above the $66,000 to $64,000 resistance in a while. The asset last traded above this region in early June.

Notably, the region presents more than just a resistance level for Bitcoin, as data from CryptoQuant recently disclosed that it represents a break-even point for short-term holders. Notably, these short-term holders are investors who have held Bitcoin for 155 days or less.

The data shows that those who have held Bitcoin for one to three months bought at an average cost basis of $64,206, while investors who have held the asset between three and six months have an average basis price of $65,898.

Break Above $66k Crucial

According to CryptoQuant, new investors may not enter the market because these short-term investors have not sold at a loss or closed their trade in profit. Hence, either of these needs to happen before new inflows are seen in the market.

The analytical firm noted that the success stories of these short-term Bitcoin holders could be all the market needs to see buying pressure and, consequently, higher prices. Bitcoin is currently trading at $60,880, 7.7% away from these key resistance regions.

Meanwhile, an earlier report from The Crypto Basic showed that Bitcoin might not reach that region this week as selling pressure has continued to keep the asset in check. According to the report, selling orders across exchanges outweighed buying orders by a staggering $50 million. 

Bitcoin Sees Fresh Funds from ETFs

While Bitcoin seeks to find its footing, inflows from US exchange-traded funds (ETFs) have continued. Data from Sosovalue shows the products saw a net inflow of $39.42 million on Wednesday, taking their cumulative net inflows to $17.56 billion.

The US Bitcoin ETFs are on a five-day net inflow streak, with the last single-day outflow coming on August 14. Since the funds’ previous outflow, they have raked in $236.58 million.

Although inflows into the funds have not reached the level seen in March, they have continued to bring substantial liquidity into Bitcoin and the crypto market. The products hold a net asset of $55.96 billion, accounting for 4.63% of Bitcoin’s market cap.

Top Exchange Expands Shiba Inu Support with This New Listing

0

Leading U.S.-based exchange Kraken expands its support for Shiba Inu by adding a new margin trading pair for the dog-themed token. 

According to a recent announcement, Kraken expanded its margin offering by pairing Shiba Inu against the euro under the pair name SHIB/EUR. 

The move will allow European users who mainly use the aforementioned currency to borrow funds to trade Shiba Inu with the potential of greater risks and returns. It bears mentioning that the SHIB/EUR margin trading is currently available on Kraken’s advanced trading platform, Kraken Pro. 

In a follow-up blog post, Kraken revealed that it offers up to 3X leverage for the SHIB/EUR margin pair. The exchange placed a ceiling of 2 billion SHIB on opening long and short positions for the SHIB/EUR pair. 

Furthermore, the post summarized Shiba Inu’s history, highlighting how it was created. Notably, Kraken stated that an anonymous developer, Ryoshi, created Shiba Inu in 2020 to give investors an asset entirely run by the community. 

Shiba Inu Margin Pair on Kraken 

At the moment, Kraken supports two Shiba Inu margin pairs: SHIB/USD and SHIB/EUR. As reported earlier, Kraken added support for the SHIB/USD pair in May 2024. At the time, Kraken set the trade position limit at 1.5 billion SHIB. 

However, at press time, the exchange had raised the SHIB/USD margin pair trading limit to 6 billion SHIB. 

Besides Shiba Inu, Kraken also paired Pepe, Sei, and Near Protocol against the euro on its margin trading platform. The tokens were listed under PEPE/EUR, SEI/EUR, and NEAR/EUR. Each offering has up to 3x leverage and different position limits. 

Kraken’s Growing Support for SHIB 

Meanwhile, Kraken has expanded Shiba Inu support since it first listed the token in November 2021. In May 2023, the exchange added a new perpetual futures trading pair for Shiba Inu (SHIB/USD), with up to 10x leverage. 

To celebrate the listing, Kraken announced a fee reduction for Shiba Inu futures trading, offering 0% maker fees and 0.1% taker fees for the first 100 days. 

In the meantime, Shiba Inu is changing hands at $0.00001416, marking a 3.90% increase over the past day. SHIB’s price has also soared 3.27% over the past week. 

SunPump Sparks 22% TRX Price Rise as Tron Tops Trending List

0

Tron (TRX) has rapidly emerged as the top trending asset in the crypto market, largely driven by the introduction of its memecoin deployer, SunPump. 

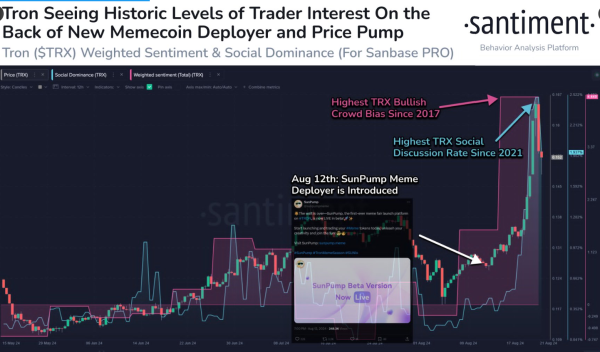
Launched earlier this month, SunPump has facilitated the creation of over 7,000 new coins on the Tron network, according to Santiment. This uptick in activity has coincides with a 22% increase in TRX’s market value, with the token peaking at just over $0.165 earlier today before the recent pullback to $0.1571.

These developments have brought Tron to the forefront of memecoin-related activity, attracting considerable attention from the crypto community.

Screenshot 2024 08 22T160847719

According the above Santiment chart, TRX has achieved the highest level of bullish sentiment among traders since 2017, suggesting widespread optimism. Social discussions around TRX have surged, reaching the highest levels since 2021.

Further data from Santiment indicates that SunPump’s success has fostered a long-term optimistic outlook for Tron. This optimism suggests potential mid-term bullish price momentum for TRX, despite expected short-term volatility.

Per Santiment, the increased network activity has been driven by a surge in memecoin launches, which have also led to a rise in TRON burns. These burns reflect a growing demand for TRX while reducing the token’s circulating supply.

Meme Coins Propel Tron’s Growth

Additionally, Tron’s role has expanded significantly following SunPump’s introduction. Tokens like SUNDOG have gained popularity, with the community actively engaging in meme coin trading. This resurgence in meme coin activity mirrors previous phases in the market, where widespread interest led to rapid price spikes. 

In addition to memecoin activity, Tron’s ecosystem is benefiting from partnerships with hedge funds and other projects, expected to drive further growth. The influence of Tron’s founder, Justin Sun, also remains a significant factor in the network’s continued growth.

$1.2 Million in Revenue Generated by SunPump

Recent data shows that SunPump has generated over $1.2 million in revenue about two weeks after its launch. On August 20, the platform achieved its highest daily revenue, surpassing $2.76 million in TRX. 

Tron’s dominance extends beyond memecoins, as it continues to lead the stablecoin market. For instance, Tether recently minted an additional 1 billion USDT on the Tron network, contributing to a significant liquidity influx. 

Over the past year, approximately $19 billion USDT has been minted on Tron, accounting for nearly 50% of Tether’s total supply. 

Tron now leads in weekly Tether transactions, handling over 77% of transfers across EVM chains. This increased activity has propelled Tron into the top ten ranking of crypto assets by market capitalization, surpassing Cardano with a valuation of around $14 billion.

Fantom Second Positive Week Teases Breakout Run To $0.70

The bullish uprising in Fantom, which marks a 55% surge in under 20 days, teases the end of the correction phase. Will this reversal rally reach $0.70? 

With a morning star reversal in the weekly chart, a bullish crossover in the 4-hour timeframe, and a boost in TVL, Fantom teases a bullish recovery. Further, the Bitcoin price is ready to skyrocket beyond $61K, heating up the altcoin market. 

Will this increased heat in the altcoin market result in a Fantom breakout run to $0.70? Let’s look at the FTM price analysis to find out more.

Recovery Run for Fantom Eyes Breakout Ahead

Under a bearish influence, Fantom price shows another bullish recovery for a breakout attempt. With a declining trend since March, the FTM token price dropped to the $0.32 support level from the $1.0681 peak. 

Fantom Price Chart
Fantom Price Chart

However, with the bullish reversal with a morning star pattern, Fantom has increased 72% in value from $0.26, the 52-week low, to $0.4528. The recovery run challenges the overhead trendline and the 23.60% Fibonacci level at $0.4998 for a breakout rally.

Further, the bullish recovery and declining bearish momentum result in the MACD and signal line coming together. This increases the chances of a bullish crossover, marking a potential trend reversal.

Fantom TVL Shoots up Overnight

In the last 24 hours, the total value locked over the Fantom DeFi has spiked to $166.29 million from $159.63 Million.

Fantom TVL
Fantom TVL

Among the Fantom Projects, BeethovenX, WigoSwap, and SpookySwap rank in the top three positions based on TVL. Surprisingly, the top positions in the Fantom DeFi are held by DEX projects.

Bulls Dominating The 4-hour Chart 

With a quick recovery in the smaller chart, Fantom price action shows a massive surge in trend momentum. Surpassing all the crucial EMAs (20, 50, 100, 200), Fantom is close to reaching the $0.50 psychological mark.

Fantom Price Chart
Fantom Price Chart

Based on the Fibonacci retracement levels, the FTM price pullback is ready to retest the 61.80% level breakout at $0.4445. Further, the bullish crossover in the 20 and 50 EMAs bolsters the uptrend chances.

Considering the uptrend gains momentum post-retest, the bull run in Fantom can reach the $0.5452 mark. Optimistically, the Fantom price can aim for the 1.618 Fibonacci level at $0.70, aligning with the 50% Fib level from the weekly timeframe.

Longest Bitcoin ATH Wait Post-Halving? Peter Brandt Warns of Red Flags

0

As Bitcoin (BTC) moves through its current bull market cycle, it is nearing an unusual milestone. 

According to veteran trader Peter Brandt, this cycle may soon mark the longest stretch in Bitcoin’s history without hitting a new all-time high (ATH) following a halving. While Bitcoin remains locked in a sideways trend, the market is left to wonder: Will it soar to new heights, or is a new ATH slipping further out of reach?

Cycles of Boom and Decline

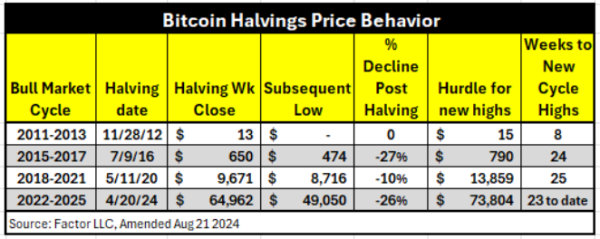
Per Brandt’s assessment, in the 2011-2013 cycle, Bitcoin barely stumbled after its first halving, quickly surging past the $15 hurdle in just eight weeks. This cycle was defined by rapid recovery and explosive growth.

But the terrain became rougher as time passed. In the 2015-2017 cycle, Bitcoin took a steep 27% plunge after halving, falling to $474 before slowly regaining momentum. It would be 24 weeks before Bitcoin broke through the $790 barrier and charted a new course to higher peaks.

Screenshot 2024 08 22T140716217

The 2018-2021 cycle brought its own twists. Though the 10% decline post-halving seemed mild, Bitcoin still took 25 weeks to reach a new high of $13,859. The journey through this cycle demonstrated that while Bitcoin had matured, its path to recovery was slower, though steady. 

Fast forward to the ongoing 2022-2025 cycle, and Bitcoin’s trajectory is even more uncertain. A 26% drop after the halving mirrors the 2015-2017 cycle, yet the market has stalled 23 weeks in, with no new ATH in sight. The $73,804 hurdle looms large, but will Bitcoin make the leap?

The Threat of Exponential Decay: $30K Drop Projected

As traders watch Bitcoin’s current cycle unfold, Brandt introduces a more unsettling concept: Exponential Decay, citing his April 26 blog. According to Brandt, each cycle since 2011 has lost roughly 80% of the force of the previous one. The 3,191X advance of the 2009-2011 cycle shrank dramatically in the following years. By 2018-2021, the advance had dwindled to just 22X. And now, Brandt projects the current cycle could rise by just 4.5X.

With Bitcoin’s high already touching $73,835 in March 2024, Brandt suggests there’s a 25% chance that the cycle has peaked. If that’s the case, the market could slide back into the mid-$30,000 range—a sobering possibility for those who have been holding out for a repeat of the explosive gains of earlier cycles.

The Waiting Game

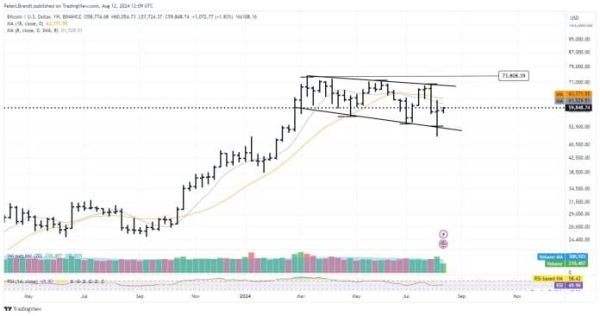
Despite these concerns, the future remains unclear. Per The Crypto Basic report this month, Brandt points to an expanding triangle pattern forming on Bitcoin’s charts. The pattern, however, is incomplete.

Without a breakout in either direction, the market remains in a holding pattern, leaving traders guessing whether the next major move will take Bitcoin higher or lower.

Bitcoin expading or inverted trignale Peter Brandt 696x366
Bitcoin inverted triangle / Peter Brandt

Brandt’s cautious approach, rooted in classical charting principles, contrasts with the optimism of some who believe Bitcoin is poised for a rally toward $70,000. He refrains from jumping into trades until a breakout confirms the trend.

For now, the market is left to wait, watching closely for signs of that decisive moment that will dictate Bitcoin’s next direction.