Home Blog Page 1296

Litecoin Price Prediction: LTC Hits $97M Roadblock After $65 Breakout

Litecoin price hit a 14-day peak of $68 on Aug 18, reflecting a 37% rebound since the monthly time frame lows recorded on Aug 5. On-chain data trends signal early profit-taking moves; how will LTC react in the week ahead?

Litecoin Breaches $65 Resistance.

Over the past two weeks, Litecoin has emerged as the stand-out performer among top-20 ranked crypto assets. The recent legalization of crypto mining in Russia appears to be one of the major catalysts behind the LTC rally.

Litecoin Price Analysis (LTCUSD) | TradingView

Since the announcement of Russia’s new legislation on crypto mining, investor sentiment around Proof-of-Work coins like LTC has improved significantly. The shaded area in the chart above shows how LTC prices have surged over the last 14 days, dating back to the major market crash on Aug 5. As of Aug 19, LTC is trading above the $65 mark, reflecting a 37.65% increase.

Notably, within that period, Litecoin has outperformed major Proof of Stake coins like Ethereum and Solana, confirming the outlook that improved international regulatory stance around crypto mining has increased market demand for PoW coins like Litecoin. However, having established a steady support base above the $65 area, Litecoin’s price now faces a major roadblock that could potentially prevent the rally from entering the next phase.

Short-term Traders Looking to Book Early Profits on $97M Worth of LTC

Following the breach of the $65 resistance, the number of sell orders has risen, hinting at a potential nullification of the bullish sentiment. This suggests that after weeks of outperforming the market, short-term traders who bought LTC during the market crash around Aug 5 are now looking to cash in on some of their profits.

The Exchange Market Depth metric aggregates Litecoin orders across various crypto exchanges, providing a comprehensive view of market demand and supply.

Litecoin Exchange Market Depth | IntoTheBlock

According to the Exchange Market Depth data, the total Litecoin buy orders amount to 1,394,380 LTC, while the total sell orders amount to 1,448,100 LTC. At the average bid price of $66.93, the value of buy orders is approximately $93.3 million. Conversely, the sell orders, valued at the average ask price of $66.96, amount to about $96.96 million. The difference between the total value of buy orders and sell orders is -$3.64 million, indicating that sell orders exceed buy orders in value.

This imbalance in market demand and supply dynamics points to a bearish outlook. The significant volume of sell orders, especially from bears who were in control just days ago, could obstruct Litecoin from advancing further. The shortfall in demand may lead to a price correction phase as the week unfolds.

LTC Price Forecast: Major Roadblock at $70

Looking ahead, Litecoin faces a critical resistance level at $70. The Ichimoku Cloud and the RSI Divergence Indicator suggest a bearish outlook in the short term. The Ichimoku Cloud, often used to identify trends and reversals, shows resistance around the $70 mark, coinciding with the upper boundary of the cloud. This suggests that Litecoin may struggle to break above this level in the near term.

Litecoin Price Prediction | LTCUSD

Furthermore, the RSI Divergence Indicator, which measures the strength of price movements, is currently at 53.06, indicating a potential slowdown in upward momentum. This bearish divergence reinforces the likelihood of a pullback, especially if the sell orders continue to outweigh buy orders.

If Litecoin fails to break above the $70 resistance, it could retrace to the $63.49 support level. A break below this level could see Litecoin retest the $60 support zone. Conversely, a successful breach of the $70 resistance could open the door for a rally toward the $75-$80 range. However, given the current market conditions and the imbalance in the order book, the odds are leaning toward a bearish correction.


Early BRETT Buyer Turns $178 to $1.71M Amid Binance and Upbit Listing

0

The trader bought BRETT months ago when the token traded at an incredibly low value and had some of his bags in profit bit by bit.

Another memecoin trader has made massive gains, this time on BRETT, a token on the Base chain. The early buyer saw over 960,000% returns on Tuesday after moving his remaining BRETT token to the crypto exchange Bybit.

The user was an early investor in BRETT, acquiring 96.946 million tokens on February 24. This wallet bought a huge chunk of the memecoin for just 0.067 ETH ($178) when it was trading at $0.00000184.

As BRETT recorded a price uptrend amid growing popularity, the user sold his acquisitions bit by bit, making massive gains in each sale. Before the Binance and Upbit listings, the wallet had sold 77.67 million BRETT (over 80% of his BRETT portfolio).

By 07:00 UTC today, the wallet moved 19.29 million BRETT to Bybit, cashing out $1.72 million. BRETT surged over 30% after Upbit and Binance announced they would list the token on their platforms.

The wallet’s outstanding gain came a few days after The Crypto Basic reported that a user made 100x gains on a memecoin based on the Tron network. There was also a case where an early PEPE buyer turned $83 into $79.4 million. 

Binance and Upbit Add Support for BRETT

Notably, South Korea’s largest exchange, Upbit, announced on Tuesday that it would add support for memecoins BRETT and PEPE by 07:00 UTC the same day.  Upbit stated it would allow the deposit of these tokens two hours after the time of the announcement.

Leading crypto exchange Binance also announced on Tuesday that it would list BRETT for futures trading. The platform listed the token for up to 50x leveraged trading by 07:35 UTC.

BRETT is now listed on over five major exchanges, including Bybit, Bitget, Kucoin, and Gate.io. At press time, the token was trading at $0.0879 with a market cap of $870 million.

Here’s What Happened On-Chain Before Bitcoin Pumped 6% to $61K Today, XRP 8% to $0.61

0

The crypto market is experiencing increased bullish sentiment after several days of subdued price action. 

Over the past week, Bitcoin hovered around $58K with little momentum to drive significant volatility. However, Bitcoin recently reached an intraday high of $61,400, marking a 6.1% increase from the day’s low of $57,864.

 At press time, the leading cryptocurrency continues to hold its ground above $60K. Meanwhile, the bullish sentiment extends beyond Bitcoin, with the altcoin market also experiencing significant gains. 

XRP, for instance, posted an 8% increase today, reclaiming the $0.61 level. BNB saw a similar percentage gain. In the meme coin sector, Solana’s meme token, Dogwifhat (WIF), delivered the best performance, recording over 12% growth.

Tether Latest $1B Liquidity Fuels Bull Sentiment

Notably, this thriving market follows the minting of a staggering $1 billion USDT stablecoin on the Tron network at the Tether Treasury earlier today. This influx of stablecoins, which are typically used to purchase other crypto assets, suggests a fresh injection of liquidity into the market.

The development has sparked considerable attention within the crypto community, with many humorously commenting that “the printer has come.” Arkham Intelligence expressed amazement at the large crypto funds minted with $0.00 fees. 

Analyst Ali Martinez likened Tether to a Federal Reserve of crypto, noting that each time more USDT is minted, the market responds with bullish price actions. Martinez humorously added that the USDT printers were “working overtime” during the recent Bitcoin correction.

Tether Minted $33B USDT in A Year

Notably, the last time the crypto market witnessed the minting of $1 billion USDT was on August 13, when Bitcoin similarly reclaimed the $61K level before losing it in the following days. Prior to that, Tether last minted $1 billion five weeks ago.

Prominent crypto surveillance firm Lookonchain highlighted that following the latest minting of $1 billion USDT, Tether has issued over $33 billion in stablecoins over the past year. 

Of this amount, Tron received the largest share, with $19 billion USDT minted on the network, solidifying its position as the leading stablecoin network. Ethereum saw $14 billion USDT minted on its network during the same period.

Notably, Tether’s closest rival, Circle, has also been minting USD stablecoins. Last Thursday, Circle minted $250 million in USDC, followed by another $100 million in two transactions the next day.

Bitcoin Consolidation Nears an End as Demand Increases: CryptoQuant Report

0

Bitcoin price appears to be on the verge of a significant breakout as recent on-chain data points to a surge in demand and token transfer volume. 

This trend suggests that the prolonged period of consolidation may be nearing its end, with potential bullish momentum building up. According to an analysis by CryptoQuant’s Alex Adler Jr., the increase in Bitcoin’s daily token transfer volume points to this shift.

For context, Bitcoin’s recent price movements show resilience, especially after the drop below $50,000 on Aug. 5. Despite the market’s volatility, Bitcoin has managed to recover some of its losses. 

An intraday spike of nearly 12% on August 8 brought the price closer to $60,000, although it faced significant selling pressure as it approached $62,000. This period of volatility has led to a phase of consolidation, during which the price hovered between $57,000 and $68,000.

Bitcoin Sees Spike in Daily Token Transfer Volume

As prices look to break out, Adler called attention to Bitcoin’s daily token transfer volume, which rose from 650,000 BTC to 765,000 BTC as Bitcoin reclaimed the $57,000 level. 

This increase in transfer volume is noteworthy as it coincides with the price stabilization within the $57,000 to $68,000 range. Such an uptick often signals heightened market activity, suggesting increased trading and movement of assets on the blockchain. 

In this context, the rising transfer volume points to a trend of panic selling from a cohort of addresses. However, it also indicates renewed interest from investors looking to capitalize on Bitcoin’s current price levels.

In the token transfer chart, the 30-day moving average has started to diverge from the 365-day moving average, suggesting a short-term increase in transfer volume. 

Bitcoin Daily Token Transfer Volume CryptoQuant
Bitcoin Daily Token Transfer Volume | CryptoQuant

Increased Demand

Adler believes this rise in transfer volume at the $57,000 mark indicates sustained demand for Bitcoin, particularly among investors who see current prices as a buying opportunity. Interestingly, The Crypto Basic recently confirmed that whales have procured nearly 95K BTC in six weeks.

The steady demand at this price level supports the notion that the market is absorbing selling pressure without significant price declines. Considering traditional market trends, such a pattern suggests a potential bullish reversal.

As Bitcoin continues to consolidate, the key levels to watch are $61,000 and $62,726. A break above these levels could trigger a new wave of buying, potentially pushing Bitcoin towards $70,000. Conversely, if Bitcoin faces another correction, it must hold above $55,436 to avoid further downside.

Top DEX Exposes Malicious Chrome Extension Targeting Solana Users

0

Leading Solana-based decentralized exchange aggregator Jupiter exposes malicious Chrome extension targeting Solana users. 

Dubbed Bull Checker, the malicious Chrome extension has been targeting several subreddits affiliated with Solana. 

Bull Checker Extension Details 

According to the announcement, Bull Checker, which appears to be a harmless and read-only extension, is designed to have extensive permission to modify website data. 

Jupiter researchers uncovered the malicious extension following reports that a few users of several Solana-based decentralized applications (dApps) were exploited in a major heist. 

After investigation, the researchers found that the Bull Checker extension interacted with dApps, like Jupiter and Raydium, modifying users’ transaction data to transfer funds to another wallet maliciously. 

The report provided evidence of how the extension maliciously modified transaction data and diverted funds to the scammers’ wallets after the user had signed the transaction normally. 

Notably, the modification usually happens when the transaction is being processed. Also, during simulation, the researchers did not find the Bull Checker extension as malicious. However, the extension becomes active during on-chain transactions to steal users’ funds. 

Further investigations reveal that an anonymous Reddit account, “Solana_OG,” shared the malicious extension in the comment section of different subreddits. This Reddit account targeted users seeking to purchase Solana-based memecoins. 

Safety Tips 

Meanwhile, the researchers warned that there could be other malicious extensions with similar features like Blue Checker that are yet to be uncovered. 

In the meantime, they warned against installing extensions with “read and change” permissions and urged users to uninstall them from their browsers. Solana users are advised to be cautious of extensions that require extensive permissions. 

“Stay safe out there, and don’t install extensions that can read/write data unless you are really sure!” the announcement read. 

Solana Popularity Soars Amid Memecoin Success 

The development comes months after Solana gained significant traction due to the success of selected memecoins launched on the network. 

Following the massive growth of dogwifhat (WIF), Bonk (BONK), Popcat (POPCAT), and Book of Meme (BOME), Solana eventually became the leading network for this cycle’s memecoins.  

As more memecoins made their way to Solana, scammers also seized the opportunity to exploit unsuspecting investors. Their tactics range from rug pulling unwary investors to launching malicious extensions to cart away users’ funds. 

In May, blockchain security firm SlowMist exposed a fraudulent Chrome extension Aggr that successfully stole millions of dollars worth of crypto despite boasting multiple positive reviews. 

Bitcoin Whales Add 94.7K BTC in Six Weeks as Price Struggles at $60K

0

Bitcoin whales accumulate more tokens at a discount as the price struggles to recover significantly after a sharp drop from its $68,000 peak. 

Data shows that, despite the prevalent volatility, whales holding between 100 and 1,000 BTC have accumulated an additional 94,700 coins over the past six weeks. As smaller traders exit the market due to uncertainty, larger holders are capitalizing on price dips.

According to Santiment, a market intelligence platform, this accumulation phase indicates strategic buying as the asset’s value hovers below $60,000. 

Notably, while retail investors face challenges, key stakeholders are increasing their positions, reflecting diverging market behaviors.

Bitcoin Whale Accumulation

This accumulation phase suggests that whales are likely preparing for a potential price surge. Their behavior contrasts sharply with smaller traders who are selling due to fear of further price declines.

Prior to this, wallets in the 100-1,000 BTC range had maintained a steady holding pattern, neither accumulating nor distributing coins. 

Highlighting Distribution Changes

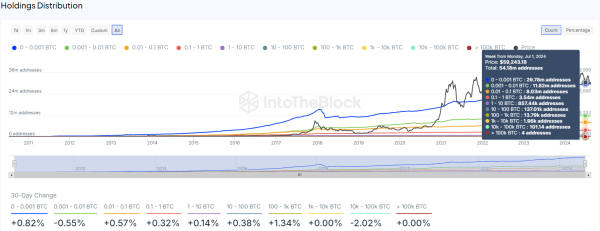
Further data from IntoTheBlock complements Santiment’s analysis by highlighting changes in Bitcoin’s distribution across various wallet sizes. As of early July 2024, there were 54.18 million Bitcoin addresses. The majority of these addresses held smaller amounts of Bitcoin, while larger wallets remained fewer but more concentrated. 

image 1
Bitcoin Holder Distribution | IntoTheBlock

Notably, the number of addresses holding 100-1,000 BTC increased by 1.34% during this accumulation phase. In contrast, mid-range wallets holding 10,000-100,000 BTC declined by 2.02%, suggesting potential rebalancing by larger holders, although the overall trend remains focused on accumulation.

Institutional Interest in Bitcoin Strengthens

The trend of accumulation by whales aligns with increasing inflows into Bitcoin-focused investment products. According to CoinShares, Bitcoin products led the market with $42 million in inflows, surpassing Ethereum-based products. 

Despite these trends, other assets like Solana saw significant outflows. Meanwhile, data from early August confirmed the continuation of whale activity, with over $1.6 billion worth of BTC purchased within a 48-hour period.

Algorand CTO Reacts as Doom on Hydra Processes More Transactions than Cardano in Just a Few Days

0

Doom on Hydra has processed more transactions after a few days of launch than the Cardano network has in its history.

The launch of the popular 1993 game Doom on Cardano’s layer 2 scaling solution Hydra has gained traction. Algorand’s chief technology officer, John Woods, was among those impressed by the game’s performance, as he commended the integration in a tweet on Sunday.

After much teasing, Doom played on Cardano’s isomorphic state channel, Hydra, for the first time on August 16. The adventurous game, which features a first-person shooter, debuted on Hydra at the Rare Evo event in Nevada. 

Every frame of the Doom game on Hydra was a transaction, operating at 35 frames per second. Input Output, Sundae Labs, and Adam Dean executed Doom’s integration on Hydra.

Doom on Hydra Gains Momentum

The Doom game immediately gained popularity among Cardano users after its launch on Saturday. After just two hours of launch, Doom crossed one million transactions.

Also, a few days after launch, Doom has processed more transactions than the Cardano network has in its history. As of Monday, Doom has seen over 6,642 players and processed 95.64 million transactions, more than the 95.2 million the Cardano network has ever processed.

US-based video game developer ID Software initially launched Doom in 1993. The 3D iconic game was seen as the first of its kind and quickly rose to fame upon launch.

With Doom now playing on Cardano’s Hydra, founder Charles Hoskinson might pursue the launch of another classic game that he considers his personal favorite. In 2020, Hoskinson noted he was looking to acquire the role-playing game Legend of Valour.

Here is Why Shiba Inu Eyes 490% Rally to $0.000081

0

Shiba Inu (SHIB) has been consolidating throughout August, and recent technical analysis indicates the cryptocurrency may be primed for a significant upward move. 

Market analyst Javon Marks has highlighted a key development involving a Falling Wedge pattern and a confirmed Bullish Divergence, which could signal the onset of a bullish breakout. Marks’ analysis projects that SHIB may be poised for a notable rally, targeting a price of 0.000081.

Shiba Inu Falling Wedge Pattern Signals Imminent Breakout

According to Marks’ chart, Shiba Inu is approaching the converging point of a Falling Wedge pattern. This pattern typically appears following prolonged downtrends and indicates a potential reversal to the upside.

Shiba Inu’s price has been forming lower highs and lower lows within this narrowing structure, suggesting that selling pressure is gradually fading. 

Screenshot 92
Shiba Inu Price Chart / Javon Marks

As the wedge tightens and approaches its converging point, a breakout becomes increasingly probable, signaling a possible bullish reversal. With the current price at $0.0000138, Shiba Inu needs to surge by over 490% to reach Marks’ target.

Additional Optimism

In addition to the Falling Wedge pattern, Marks points to a confirmed Regular Bullish Divergence between the price and momentum indicators, such as the Relative Strength Index (RSI). 

A bullish divergence occurs when the price forms lower lows while the indicator creates higher lows, signaling a weakening bearish momentum. This divergence adds further confidence to the potential for a price reversal, reinforcing the likelihood of a breakout from the wedge.

Key Support and Resistance Levels

An analysis from IntoTheBlock further supports Marks’ bullish outlook by assessing key support and resistance levels for SHIB holders. The In/Out of the Money Around Price (IOMAP) data shows that 60.10% of tracked addresses are currently in profit, while 38.72% are out of the money. 

Screenshot 91
SHIB IOMAP / IntoTheBlock

The largest clusters of profitable addresses are between $0.000012 and $0.000013, indicating strong support at these levels. Conversely, resistance may emerge between $0.000014 and $0.000016, where many holders are currently at a loss and may sell at break-even points.

As SHIB approaches these levels, market behavior will likely play a pivotal role in determining its next moves. If the price breaks past resistance, it could open the door to a more sustained rally, aligning with Marks’ projected target of 0.000081.

This analysis by Marks comes after CoinW, a famous crypto exchange, issued a massive target for Shiba Inu, projecting that the meme might skyrocket by over 7,627,665%.

Will AAVE Surpass $150 For a 33% Hike This Week?

Will AAVE surpass the 78.60% Fibonacci level neckline at $128 for a sprint to $200 this week?

Amidst the recovering market, traders are expecting a bullish week ahead. Among the high-performing altcoins, AAVE stands prominently, with a breakout rally gaining momentum.

With the support of improving on-chain data, the altcoin is ready for a moonshot. So, should you consider buying AAVE this week?

AAVE at 78.60% Fib Level Hits a Crossroads

In the daily chart, AAVE’s price action reveals a consolidation breakout, signaling the start of a new bullish cycle. Over the past ten days, AAVE has experienced a 43% surge, driven by a series of 8 bullish daily candles over the past 9 days, reflecting increasing demand. 

Notably, a morning star pattern formed at $110, with three consecutive bullish candles resulting in a 16.54% rise since the last bearish candle.

AAVE Price chart
AAVE Price chart

Currently, AAVE is challenging the 78.60% Fibonacci level at $128.89 and is trading at $129.22, with an intraday gain of 9.33%, hinting at a potential breakout. For the uptrend to continue strongly, buyers need to sustain the closing price above $128.

The rising demand is also reflected in technical indicators, with the MACD showing a surge in positive histograms and a potential golden crossover between the 50-day and 200-day SMAs. 

AAVE Expansion Fuels Upside Potential

The on-chain data for AAVE shows a significant uptick in network activity. In support of the high-momentum bull run, AAVE witnessed a 140.42% increase in transfer volume. Furthermore, a 58.04% rise in active addresses and a 29.52% growth in transactions are seen over the last 24 hours. 

AAVE on-chain data
AAVE on-chain data

The surge in the on-chain data bolsters the bullish trends in the AAVE price. Further, the conditions are favorable for uptrend continuation, increasing breakout run chances. 

Will AAVE Surpass $150?

A successful breakout above $128 would likely target the $142 level, which peaked in March 2024. Based on Fibonacci levels, the next bullish target could be $182, corresponding to the 1.618% Fibonacci level.

Conversely, a minor pullback to $120 or $110 remains possible.

Avalanche Support Holds Strong as Traders Eye Potential Breakout to $30

0

Avalanche (AVAX) has continued to display resilience, experiencing an impressive 5% surge over the past week. 

This upward trend follows a significant market downturn on August 5, which led to the liquidation of over $1 billion in leveraged positions. AVAX, now trading around $22, previously experienced resistance at this level but shows no nearby on-chain obstacles.

Current market conditions suggest AVAX’s future movement depends on broader sentiment, with optimism potentially driving the price towards $30.

Key Price Levels 

Notably, data from IntoTheBlock offers insights into AVAX holders’ positions. Address activity highlights the importance of specific price ranges. For instance, a cluster of addresses at the $14.53 to $18.40 range remains in profit, suggesting strong accumulation at these levels.

GVVvDSLWEAASQJ5
GlOM | IntoTheBlock

Another significant accumulation exists between $18.40 and $20.14, where many addresses are marginally in profit.

This suggests that this range may act as a support level in the event of a price decline. Interestingly, the next price range of $21.92 to $26.26 sees more addresses at a loss, indicating that it could serve as resistance as those holders may exit at breakeven.

Possible Targets

However, higher price levels, such as $26.26 to $34.57, reveal even more addresses at a loss, indicating substantial accumulation during that period. These levels could further resist upward movement, as holders look to minimize losses.

Nonetheless, prices above $34.57 see fewer addresses involved, indicating less trading activity at higher levels, which could lessen the resistance during a more extended rally.

The analyst’s assertion that AVAX could climb to $30 if market sentiment remains positive is plausible, given the chart shows significant resistance clusters between $26.26 and $34.57.

However, if sentiment worsens, the potential for a drop to $16 also seems likely based on the support levels visualized in the chart.

Open Interest Increases

Elsewhere, a rise in AVAX’s Open Interest suggests renewed confidence in the asset. Following the release of the U.S. Bureau of Labor Statistics’ inflation data on August 14, Open Interest in AVAX jumped from $182 million to $201.6 million by August 15. 

Screen Shot 2024 08 15 at 41325 PM 1920x539
Avalanche Price vs AVAX Open Interest | Coinglass

The 10.77% increase in Open Interestduring a period of price consolidation, suggests that a significant price move may be imminent.

Two key factors are driving this: growing trader confidence and the possibility of a short squeeze. If bears fail to push AVAX below critical support levels, bulls may regain control and drive prices higher.