Home Blog Page 1319

Bitcoin Spikes 6% Toward $60K as Russia Recognizes Crypto Mining as Legitimate Business

Russian President Vladimir Putin has endorsed into law the legalization of cryptocurrency mining in Russia, sparking dramatic gain for Bitcoin toward $60,000.

Russian news agency TASS captured this latest regulation in a fresh publication. The report highlighted that the new legislation introduces several crucial concepts, including virtual currency mining, mining pools, and mining infrastructure operators.

According to the report, Russia now recognizes mining activities as legitimate business activities rather than simply the issuance of digital currency.

Guidelines for Crypto Mining in Russia

The law also outlines specific guidelines for who can engage in cryptocurrency mining. Only Russian legal entities and individual entrepreneurs who are registered with the government can participate. However, individual miners are exempt from registration requirements if they keep their energy consumption within the limits set by the government.

Additionally, the report highlighted that foreign digital financial assets will be allowed to be traded on Russian crypto platforms. However, the Bank of Russia will have the authority to prohibit listing specific issues if it determines that they threaten Russia’s financial stability.

In a previous meeting with the government to discuss economic issues, Putin expressed his enthusiasm for virtual currencies’ potential. He stressed the significance of Russia taking swift action to establish a legal framework, develop infrastructure, and create an environment conducive to the circulation of crypto assets, recognizing it as a promising area for economic growth.

According to the report, the law will become effective ten days after its official publication date.

Bitcoin Reacts, Heads to $60K

Remarkably, the news of Russia permitting crypto mining has stirred the crypto market with dramatic gains. In particular, Bitcoin has surged toward the $60K region after rallying by 6% just a few hours ago. Other crypto assets have followed the trend. At press time, Bitcoin hovers around $59,600. 
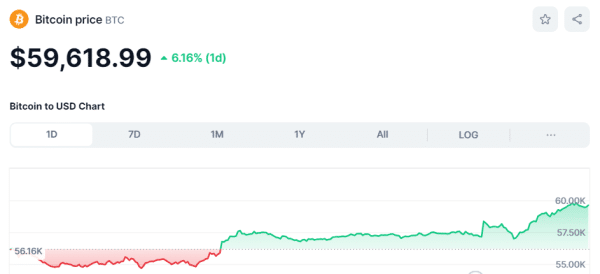
Bitcoin price chart
Bitcoin price chart | CoinMarketCap

Russia’s Bill to Trade Crypto

Notably, this latest development comes just two weeks after Russian lawmakers passed a bill permitting businesses to utilize cryptocurrencies in international trade. Observers see this as an effort to circumvent Western sanctions imposed on Russia following its invasion of Ukraine.

The law will take effect in September. According to Elvira Nabiullina, the Governor of the Russian Central Bank, the first cryptocurrency transactions are expected to occur before the end of the year.

Russia has been grappling with significant delays in international payments with major trading partners such as China and the United Arab Emirates. This is largely because, under pressure from Western regulators, banks in these countries have become increasingly cautious in their dealings with Russia.

Exchanges Record $1B in Daily Stablecoin Net Inflow, Largest Since April 2023

0

Crypto exchanges recently witnessed nearly $1 billion in stablecoin net inflow in just a day, marking the largest figure since April 2023.

This massive figure was recorded yesterday, according to on-chain data sourced by market intelligence resource IntoTheBlock. The accompanying chart shows an initial decline in stablecoin net inflows at the start of Q4 2023. Notably, in October 2023, net inflows persistently averaged below $300 million daily.

Stablecoin Netflows to Exchanges
Stablecoin Netflows to Exchanges | IntoTheBlock

This drop coincided with the beginning of the pre-bull run phase for the ongoing market cycle, as Bitcoin (BTC) engineered a recovery from the $27,000. Stablecoin inflows recovered shortly after, as the bull market took shape from Q4 2023 to Q1 2024. 

The metric remained fairly high until a drop in May before a rebound four months ago. However, the most significant spikes occurred in recent times. Crypto exchanges first witnessed a massive spike in stablecoin net inflows on Aug. 6, amounting to a peak of $978 million amid a hurdle to the latest market rebound.

Yesterday, another spike occurred, with stablecoin net inflows on exchanges hitting $957 million. These two spikes pushed the figure to the highest in sixteen months. However, the metric has collapsed dramatically at the reporting time, currently at $99 million. It remains to be seen if a recovery will come up in the following days.

Why This Matters

Notably, these spikes are seen as bullish signs as a massive increase in stablecoin net inflows into exchanges translates to a rise in investors’ purchasing power. Notably, market participants typically deposit more stablecoins into exchanges when preparing to enter the market. 

For instance, shortly after the spike in stablecoin net inflows last April, the crypto market witnessed an impressive rebound. Bitcoin first recovered to a peak above $31,000 before eventually correcting. Shortly after, it observed a second rebound, which persisted until the all-time high above $73K in March 2024. 

Now, with the latest spikes in stablecoin net inflows, investors could be preparing to enter the market again. The fact that this trend has picked up amid a market downtrend could suggest that market participants are preparing to take advantage of the recent dip.

As Bitcoin continues to hold above the $59,000, an influx of new capital could catalyze a recovery back above $60,000. CryptoQuant CEO Ki Young Ju recently asserted that Bitcoin’s potential to secure a new all-time high depends on its ability to retain the $45,000 support.

Bitcoin Price Analysis: BTC Scores 6% Gains Amid XRP Rally, Will BTC Reach $70k ?

Bitcoin price peaked at $58,800 on Aug 8, scoring 6% gains amid bullish tailwinds from news of Ripple securing a lenient fine in the long-running lawsuit with the US SEC. Technical indicators highlight key BTC price resistance and support levels to watch. 

BTC Scores 6% Gains Amid XRP Rally

On August 8, 2024, Bitcoin surged by 6%, fueled by a broader cryptocurrency market rally following Ripple’s settlement with the U.S. Securities and Exchange Commission (SEC).

Ripple Labs, led by CEO Brad Garlinghouse, agreed to pay a $125 million fine to resolve charges related to its programmed sale of XRP coins to its institutional clients.

As expected, the perceived lenient ruling has sparked optimism among investors. The settlement is seen as a significant victory for Ripple, removing a major legal overhang that had created uncertainty in the XRP/USD markets over the last 4 years.

Bitcoin Price Action (BTC/USD) vs. XRP | TradingView

XRP led the rally with double-digit percentage gains in excess of 20%, as investors interpreted the fine as a relatively mild penalty.

This positive sentiment spilled over into the broader crypto market, lifting Bitcoin (BTC) and other assets in the top 20 crypto rankings.

Looking at the BTC/USD charts, we see how Bitcoin price grazed the $59,214 mark during the afternoon GMT trading hours. The surge in market demand propelled BTC above the $59,000 mark for the first time since the Aug 5 crash.

This confirms the narrative that Ripple settlement may have boosted investors confidence at it further deepens the regulatory clarity around cryptocurrencies in general.

BTC Price Forecast: Technical Indicators Hint at $65k Leg-Up

Notably, the 6% rally on Wednesday means that Bitcoin price has now rebounded 20% from the weekly low of $49,111 recorded during the Aug 5 market crash.

With traders still cautiously optimistic, the Relative Strength Index (RSI) and Ichimoku cloud technical indicators on the BTC/USD daily price charts are hinting at another leg-up.

First, the Ichimoku Cloud, a comprehensive indicator combining several moving averages, helps traders assess momentum, trend direction, and potential support and resistance levels.

Bitcoin Price Forecast (BTC/USD) | TradingView

On the chart, Bitcoin is trading below the cloud, which generally indicates a bearish trend. However, today’s candle has made a significant upward movement, pushing Bitcoin towards the cloud’s lower boundary at $59,563.87.

This suggests that Bitcoin is attempting to break out of its recent downtrend, with the cloud’s lower boundary serving as the first major resistance level. A successful close above this level could signal a reversal towards the upper levels of the cloud, potentially targeting the next resistance around $60,000.

The RSI, which measures the speed and change of price movements, is currently at 43.08. This is below the neutral level of 50, indicating that Bitcoin has been in bearish territory. However, the RSI has shown a recent uptick from oversold levels, suggesting that the selling pressure might be waning.

This aligns with the Ichimoku Cloud analysis, where the price movement indicates a possible bullish reversal. If the RSI continues to rise, especially if it crosses above 50, it would further confirm a shift in momentum from bearish to bullish.

Bitcoin Demand Surges in US as Coinbase Premium Index Turns Positive

0

The recent price movements of Bitcoin have captured the attention of investors, with data suggesting a resurgence in demand within the United States market. 

As Bitcoin attempts to recover from its recent lows—currently trading at $58,357—indicators such as the Coinbase Premium Index point to increased demand, particularly in the U.S. market.

According to the analytic platform CryptoQuant, the Index has turned positive again, showing renewed buying pressure from U.S. investors. This trend correlates with a broader pattern of accumulation and market activity, proving the continued interest in Bitcoin despite its recent volatility.

Bitcoin chart of Coinbase Premium Index
Bitcoin chart of Coinbase Premium Index | CryptoQuant

How US Demand Drove Bitcoin to ATH

Notably, the Coinbase Premium Index measures the difference between Bitcoin prices on Coinbase and other exchanges and serves as a key indicator of U.S. market sentiment.

Positive premium values, indicated by green bars, suggest higher buying pressure on Coinbase, reflecting strong demand from U.S. investors, where the exchange has a larger user base. 

Conversely, negative premiums, represented by red bars, indicate selling pressure or reduced buying interest. For instance, from February to early March, the strong buying pressure from U.S. investors resulted in Bitcoin’s price surge to its all-time high of $73,737.

Accumulation Trends

In addition to the Coinbase Premium Index, the Accumulation/Distribution (Accum/Dist) line provides further insights into investor behavior. The line’s upward trend, with a current value of 5.35M, indicates ongoing accumulation despite fluctuations in Bitcoin’s price. 

Screenshot 4

This accumulation reflects a longer-term bullish sentiment as investors continue to buy regardless of the recent selling pressures. 

Long-Term Holder Activity 

Further evidence of market confidence is seen in the behavior of long-term holders. According to recent data, a significant amount of Bitcoin has moved to permanent holder addresses, indicating a strong accumulation phase.

Over just 30 days, approximately 404,448 BTC, worth over $23 billion, were added to long-term wallets. This substantial accumulation suggests that investors with a long-term outlook are confident in Bitcoin’s future performance despite recent price volatility.

Bearish Market Signal

It is worth noting that despite this ongoing accumulation, market indicators have begun suggesting that the crypto market is entering a bearish phase. Founder of CryptoQuant Ki Young Ju argued that Bitcoin’s continued uptrend will be confirmed if it maintains a price above $45K.

Bitcoin Path to New ATH Hinges on This Crucial Support: CryptoQuant Founder

The latest collapse in the price of Bitcoin has sparked significant indications that the bear market could already be at large, experts warn.

Bitcoin slumped to $49,000 on Monday from as high as $61,000, wiping out billions of dollars from leveraged traders. In reaction, Ethereum came close to losing the $2K threshold. Likewise, Solana (SOL) almost plunged back to below $100. 

Remarkably, by the next day, Bitcoin reclaimed $55K, helping Solana rally back to $150. While Bitcoin continues to defend recent gains, exhibiting signs of continuation toward $60K, the bearish fears have not yet disappeared.

Early Signs of Bear Market

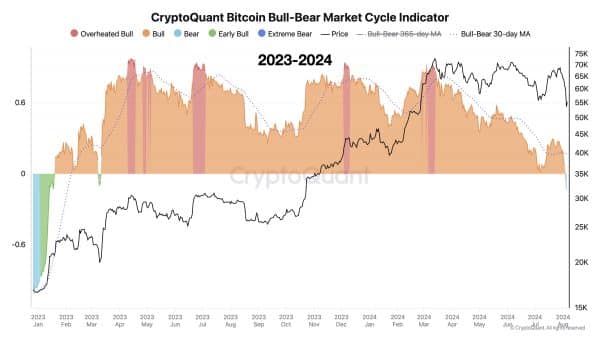
In a recent update, Julio Moreno, head of research at the analytics platform CryptoQuant, revealed that the Bull-Bear Market Cycle Indicator signaled a BEAR phase on Tuesday for the first time since January 2023.

Moreno highlighted that previous instances when the indicator briefly flagged a BEAR phase included the COVID-19 market crash in March 2020 and the Chinese mining ban in May 2021. It also accurately predicted the onset of the bear market in November 2021.

Bitcoin bull bear market indicator CryptoQuant
Bitcoin bull-bear market indicator | CryptoQuant

The observation has drawn considerable attention within the crypto community. Responding to the findings, Ki Young Ju, founder of CryptoQuant, stated that as long as Bitcoin’s price remains above $45K, it has the potential to reach a new all-time high within a year.

He acknowledged that some market indicators have flashed bearish signals since the recent steep drop. However, Young Ju suggested that these signals could reverse if a rebound occurs.

As a result, he suggested observing Bitcoin’s performance over the next week or two for further confirmation. Young Ju noted that if it remains stuck around its current threshold for an extended period—particularly longer than a month—it could signal a weakening market sentiment. 

Accordingly, the risk of entering a prolonged bear market increases, and recovery could become more challenging when bearish conditions persist beyond this period.

Indicators Flashing Bullish Signal

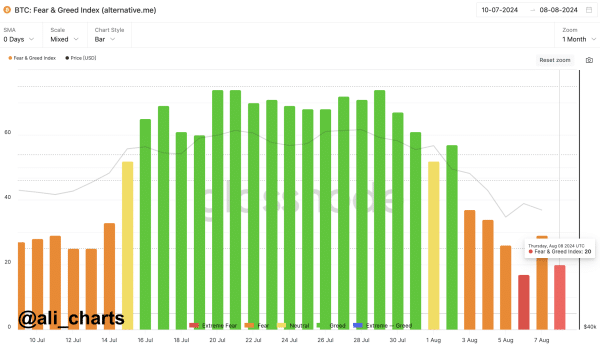
Interestingly, some other indicators are giving market participants reasons to remain bullish. In a separate update, on-chain analyst Ali Martinez pointed out that the crypto market has returned to a state of extreme fear, which he believes presents a prime buying opportunity for Bitcoin.

Bitcoin greed fear index
Bitcoin fear and greed index

In an earlier post, Martinez noted that while short-term holders were liquidated during the recent dip to $49,000, long-term holders were actively accumulating. He highlighted that these long-term holders added over 184,500 BTC to their portfolios, worth approximately $10 billion.

Supporting this trend, recent data shows that more than 404,000 BTC, valued at over $23 billion, have been locked in long-term holders’ wallets.

.

XRP Price Predictions: Ripple $125M Fine Sends XRP into 30% Rally, Will it Reach $0.70?

XRP price has surged by more than 30% in the last 24 hours as markets reacted to a favorable ending to Ripple’s long-running lawsuit against the US SEC. Is it a precursor for a $0.70 breakout? 

Ripple vs. SEC Case Ending Triggers 30% XRP Price Rally.

On August 7, a New York District Court ordered RippleLabs to pay a fine of $125M following a ruling the company engaged in over 1,200 violations of securities laws.

This final ruling is considerably lower than the US authorities $1.9 billion penalties package initial demand. Despite efforts by the SEC to challenge the decision, their attempt to appeal proved unsuccessful.

Although she did not explicitly state that Ripple had committed any infractions beyond those identified in the SEC’s lawsuit, she expressed concern over the company’s aggressive tactics, particularly regarding its payment services.

In reaction to this news XRP price recorded a major breakout, outperforming all mega cap assets in the top 20 crypto market rankings.

XRP Price Analysis 
XRP Price Analysis

Looking at the chart above, XRP price rebounded 48.63% as it rose as high as $0.64 on Aug 7 before consolidating above the $0.61 level at the time of writing on Aug 8.

While the global crypto market has made healthy recovery from the historic lows recorded on Aug 5, XRP has now broken out ahead of rival assets, due to bullish tailwinds from the Ripple judgement. Technical indicators suggest that XRP is now poised to make its way towards the $0.70 during the next bullish market phase.

XRP Price Forecast: $0.70 Rally Ahead?

XRP has demonstrated a significant bullish momentum over the past three days, surging 48.63% from a low of $0.5789 to the current price of $0.6188 as of August 8, 2024. This sharp rise comes after a period of consolidation and a subsequent dip, indicating a potential reversal in market sentiment. The recent price action suggests that XRP might be poised for further gains in the coming days.

XRP Price Forecast | (XRP/USD)

Key technical indicators support this bullish outlook. The Parabolic SAR (Stop and Reverse) dots, currently positioned below the price, suggest an ongoing upward trend. The Moving Average Ribbon, comprised of various SMAs (20, 50, 100, 200), shows that XRP has recently moved above the short-term 20 SMA at $0.5858, indicating strengthening bullish momentum.

The next significant resistance level to watch is $0.70, a psychological and historical resistance point that, if breached, could propel XRP to new highs.

On the downside, the 20 SMA at $0.5858 now acts as a crucial support level. Should the price retrace, additional support is found at $0.5438, where the 50 SMA is located. A break below these levels could signal a shift back to bearish sentiment, but as long as XRP remains above these supports, the bullish trend is likely to continue.

Expert Urges Elon Musk to Add XRP Into X Payments After SEC’s Partial Defeat to Ripple 

0

Popular legal expert Fred Rispoli conveys an important message to American billionaire Elon Musk regarding the final decision in the SEC v. Ripple lawsuit. 

According to an X post today, Attorney Rispoli suggested that Musk has a golden opportunity to legally express his defiance of the SEC following its partial defeat against Ripple.

As reported earlier, Judge Analisa Torres reduced the SEC’s excessive demand of nearly $2 billion to $125 million, ordering Ripple to pay the penalty within 30 days after her entry of final judgment. 

Integrate XRP to X Payments 

Reacting, Attorney Rispoli recommended that Musk integrates XRP into the payment network of his social media platform, X. According to him, this way, Attorney Rispoli believes the American entrepreneur can legally say “eff you” to the SEC. 

Nonetheless, he advised Musk to seek the opinion of Adam Mehes, X’s in-house litigation leader, regarding this move. Interestingly, Attorney Rispoli speculated that Mehes would likely support integrating XRP into X Payments at this time. 

No Plans to Officially Support Crypto on X Payments 

Musk has been pushing to transform X (formerly Twitter) into an app equipped with relevant services. Part of this vision includes allowing users to manage their finances via a dedicated payment platform named X Payments. 

Following Musk’s takeover as X owner, the company has made vital progress toward launching the payment system, including securing money transmitter licenses across 30 states in the U.S. 

X Payments is expected to debut this year, initially supporting only fiat currencies. However, given the American businessman’s enthusiasm for top assets like Dogecoin (DOGE) and Bitcoin (BTC), there are speculations that he might consider integrating cryptos into X Payments in the future.  

Nonetheless, there is no official confirmation or timeline regarding when this move will happen. 

Ripple CEO Highlights Significance of SEC Decision 

Meanwhile, the recently issued final judgment in the SEC v. Ripple case has been the major topic of discussion within the broader crypto community. Top crypto stakeholders have weighed in on the debate, highlighting how the verdict could impact the industry. 

According to Ripple CEO Brad Garlinghouse, the final verdict marks the end of the SEC’s headwinds against the XRP community. 

Prominent Speakers to Join ‘Crypto for Harris’ Town Hall to Boost Harris Campaign

0

A newly formed advocacy group, “Crypto for Harris,” is gearing up to host a virtual town hall next week, aimed at supporting Kamala Harris’ presidential campaign. 

The report, which came first on FOX Business, states that the group, comprising around 50 members, is made up of industry participants and policy experts who are pushing for crypto-friendly policies. The event will feature prominent speakers like SkyBridge Capital founder Anthony Scaramucci, billionaire entrepreneur Mark Cuban, and several Democratic House Representatives.

Virtual Town Hall to Bolster Harris Campaign

Additionally, the upcoming town hall meeting, open to the public, is set to discuss strategies for bolstering Harris’s campaign and promoting fundraising efforts. Top Democratic Senate leaders have been invited to speak, highlighting the event’s importance. 

According to Jonathan Padilla, CEO of Web3 Marketing firm Snickerdoodle, the advocacy group is dedicated to ensuring the US maintains its leadership in blockchain and cryptocurrency.

With the presidential race narrowing between Trump and Harris, the latter faces a challenging regulatory environment perceived as crypto-unfriendly. Despite this, Democratic lawmakers and crypto advocates remain committed to engaging the 40 million American crypto owners, arguing that innovation and consumer protection must go hand in hand. 

Campaigns Vie for Crypto Support

Meanwhile, Trump has actively courted the crypto community, participating in major events like the Bitcoin Conference in Nashville and promising to ease regulatory constraints. His campaign has successfully garnered substantial support from industry leaders. 

Harris’s campaign has recently added former crypto advisers Gene Sperling and David Plouffe, signaling a serious commitment to crypto policy. According to Fox Business, Moe Vela, a senior adviser to Unicoin, noted that integrating these experts into the campaign demonstrates a more profound engagement with the industry than merely participating in events.

Notably, following the announcement of an upcoming interview between Elon Musk and Trump, Shiba Inu lead developer Shytoshi Kusama expressed excitement over the bipartisan support for crypto. Kusama’s reaction underscores a broader sentiment within the crypto community that the increased political attention signals a promising future for the industry.

Will the Chainlink Crack Below $10 Push Prices To $7?

Following the recent crash under $10, the slow recovery from Chainlink as the market rebounds warns of significant downside risk. Will the bearish trend in LINK extend below $7?

Trading at a discount of 54%, Chainlink’s pullback run coinciding with the market crash results in a fatal drop under $10. The downfall drops the market cap to $6 billion and slides its crypto market position down to sixteenth in the top 100 list of coins. 

With a sideways trend near the psychological mark of $10, the altcoin hints at an extended recovery. So, let’s check the Chainlink price analysis to evaluate the chances of a bullish recovery. 

Has The Correction Bottomed Out?

Retracing from the $21 peak, Chainlink fails to find any concrete support as the pullback phase intensifies. With a lower low formation, the $LINK price breaks under crucial levels and the dynamic support levels.

Chainlink Price Chart

As per the Fibonacci retracement over the bullish recovery in Q2, Chainlink took multiple supports at the 61.80% level at $12.689. However, the recent market crash drops the prices under $10 and the 78.60% Fib level. 

The downfall results in multiple bearish crossovers and a death cross in the crucial daily EMAs (20, 50, 100, and 200). Furthermore, the bearish run causes the daily RSI line to fall to the oversold boundary. 

Currently, Chainlink trades at $10.030 with an intraday move of 5.70%, forming a bullish candle. This prolongs the sideways trend in $LINK below the 78.60% Fibonacci level. 

Chainlink’s Crossroad At $10: Will Bulls Prevail?

Post-bearish move, Chainlink suffers a massive loss in market value and struggles to surface above the $10 psychological mark. Despite the multiple integrations of Chainlink’s CCIP with top names Mentis, Astar Network, and Affine, $LINK failed to uphold any levels. 

As per the Fibonacci levels, a bullish break of the 78.60% Fib level will be a strong buy signal. The next target levels for the recovery rally are the 38.20% and 50% Fibonacci levels at $12.689 and $14.412, respectively.

XRP Hammer Formation Targets Meteoric Surge Reminiscent of 110,233% Rally in 2017

0

XRP recently formed a hammer pattern on the weekly chart, with analyst Dark Defender citing historical data of previous formation that led to a 110K% surge.

The market analyst disclosed this in one of his recent analyses of XRP’s price movements. Notably, XRP had faced intense bearish pressure following its impressive price run toward the end of July. After spiking to a high of $0.6580 on July 31, August brought bearish pressure.

The bearish pressure was mostly due to selloffs across the broader crypto market amid geopolitical risks. XRP collapsed as the first full week of August progressed, leading to the formation of a hammer candlestick pattern. Dark Defender was the first to identify this hammer formation, emphasizing its importance in the grand scheme of things.

XRP Weekly Hammer Candlestick 

For the uninitiated, a hammer candlestick is a bullish reversal pattern that forms after a downtrend. It has a small body and a long lower shadow, with little or no upper shadow. This pattern indicates that despite selling pressure, buyers are stepping in, which could signal a potential price reversal.

Dark Defender cited historical data to support this thesis. He called attention to a previous hammer candlestick formation on the weekly chart from 2017. According to him, this hammer pattern formed in March 2017, merely three weeks before XRP experienced its meteoric run.

However, The Crypto Basic could not confirm this formation on the XRP/USD weekly chart from Bitstamp. Instead, we found that this pattern actually formed in January 2017. Notably, during this time, XRP opened at $0.00674, crashed to a low of $0.00300, then recovered to close the week at $0.00640, forming the hammer.

XRP 2017 Weekly Hammer Candlestick

This hammer occurred amid a downtrend for XRP during the pre-bull run phase of the 2017 cycle. At the time, Bitcoin (BTC) and other assets recorded upsurges, while XRP underperformed. This is similar to the ongoing trend in this cycle. 

XRP Targets Meteoric Surge

In 2017, following the hammer formation, XRP continued to drop for four more weeks before embarking in a recovery. However, this recovery push was monumental, with XRP soaring to the $3.31 all-time high in January 2018. This marked a massive 110,233% increase from the January 2017 low of $0.003 within a year.

Though not explicitly stated, Dark Defender’s analysis suggests a repetition of a similar uptrend. However, the extent of this uptrend remains speculative. In an analysis last month, the market watcher set a $5 price target for XRP amid a daily bull flag formation. However, in March, he suggested he is looking out for a $333 XRP price.

Meanwhile, recent data from XRP’s weekly chart indicates that the latest explosive surge has erased the hammer candle formation. XRP surged by more than 30% within 24 hours following the resolution of the SEC case, now up 15% this week. Currently trading for $0.6046, the asset has recovered the 13% loss of the previous week, with a recent RSI spike.

XRP 1W Chart
XRP 1W Chart