Home Blog Page 1322

Hundreds of Plus Token Ponzi Addresses Move 789K Ethereum After 3 Years Dormancy 

0

Lookonchain reports the movement of large amounts of Ethereum (ETH) by hundreds of wallets linked to exit scam Plus Token that have been dormant for more than three years. 

According to the blockchain analytics platform, these wallets have moved up to 789,533 ETH, valued at around $2 billion. Notably, these funds emanated from one of the wallets linked to the famous Asian exit scam, the Plus Token ponzi. 

Chinese Authorities Seize and Distribute Plus Token Funds  

Recall that in November 2020, Chinese authorities seized multiple crypto assets following a massive crackdown on the perpetrators of the Plus Token ponzi. 

The seized crypto assets included 194,775 BTC, 833,083 ETH, 79,581 BCH, 27.6 million EOS, 487 million XRP, 1.4 million LTC, 213,724 USDT, 74,167 DASH, and 6 billion DOGE. 

Notably, the tokens, which were worth $4.2 billion at the time, are now valued at nearly $15 billion. Following the crackdown, the Chinese authorities moved 789,533 ETH to an unlabeled blockchain address and later distributed the funds to hundreds of unknown addresses.  

According to Lookonchain report, these wallets have been dormant since April 2021, approximately 3.3 years ago. However, the on-chain tracking platform revealed that the previously dormant wallets came out of hibernation earlier today to move the ETH. 

Details of the Transactions

Notably, The Crypto Basic confirmed some of these movements. In particular, one of the addresses that received about 736 ETH from the seized funds came out of a 3.3-year hibernation to move all 736 ETH to another wallet today at 10:17 AM (UTC). 

This recipient wallet received an additional 2,143 ETH from four other addresses affiliated with the Plus Token Ponzi funds within the same timeframe, bringing its total holdings to 2,879 ETH ($7,032). At press time, the funds are still in the wallet. 

The reactivation of hundreds of dormant addresses and the movement of $2 billion worth of ETH by the Chinese government could cause panic among investors, leading to a decline in the asset’s price. 

However, ETH has not shown signs of a correction in the hours leading up to press time. The second-biggest cryptocurrency was trading at $2,441 per token, up 0.79% in the daily charts. 

ETHUSDT 2024 08 07 14 53 52
Ethereum 1D Chart

Solana Rebounds Strongly, Gaining 15% Against Bitcoin in Sentiment Surge

0

Solana (SOL) has seen a notable surge in the past 24 hours, climbing +7.5% amid increased sentiment, according to market intelligence resource Santiment. 

Ranked as the fifth largest asset by market cap, SOL’s price performance is particularly influenced by crowd sentiment.

The recent positive sentiment could propel further gains if market optimism persists. The Santiment chart offers a comparative analysis of SOL’s price against Bitcoin (BTC) and highlights sentiment-driven price action.

Screenshot 29

Positive vs. Negative Sentiment Ratio

The sentiment ratio is visualized by the blue shaded area on the Santiment chart. Significant spikes in sentiment correlate with SOL’s price movements, particularly within the identified Crowd Greed and Crowd Fear zones. 

The red-marked Crowd Greed Zone, where SOL usually drops after high sentiment spikes, was observed around July 28, and Solana price plummeted after. The green-marked Crowd Fear Zone, where SOL generally rises after entering, was noted on July 21 and August 4. 

For instance, entering the fear zone around July 21 corresponded with a subsequent price rise, reflecting the impact of sentiment on SOL’s performance. The rebound from July-like fear levels confirms strong support for Solana and indicates potential for continued bullish momentum.

The SOL/BTC price ratio showcases SOL’s performance against BTC, highlighting key events where sentiment influenced price action. SOL has gained +15% against BTC since the markets bottomed two days prior, indicating a strong recovery. 

The Technical End

Technical analysis supports this narrative, with the price of SOL recently bouncing back towards the middle Bollinger band, reflecting increased buying pressure. 

Screenshot 27

The RSI at 46.43 indicates recovery from oversold conditions, further supporting the bullish sentiment. Notably, the MACD and signal lines show signs of a potential bullish crossover, suggesting continued price increases.

According to previous analysis by The Crypto Basic, Solana recently showed bullish dominance at the support trendline despite the market crash, rebounding from $110 to reclaim the $150 level. This marked a 40% recovery.

Currently trading at $153, Solana forms a second bullish candle in a V-shaped recovery, aiming to rechallenge the overhead broken trendline.

Cardano Price Predictions: ADA Could Hit $0.40 as Bull Traders Swoop In

Cardano price has reached $0.34 today, marking a 21% rebound from the historic lows recorded on Monday, with two key indicators suggesting ADA could be on track for a $0.40 retest in August. 

Cardano Scores 21% Rebound as Bull Traders Swoop In

During the crypto market crash, and frenetic liquidations that gripped the crypto markets on Monday, Cardano was one of the worst-hit mega cap altcoins.

Notably, layer-1 Proof of Stake (PoS) coins have recorded reduced demand since the Ethereum ETF’s approval. The prolonged decline in buying interest had weakened ADA’s key support levels, leading to rapid downswings during the market crash.

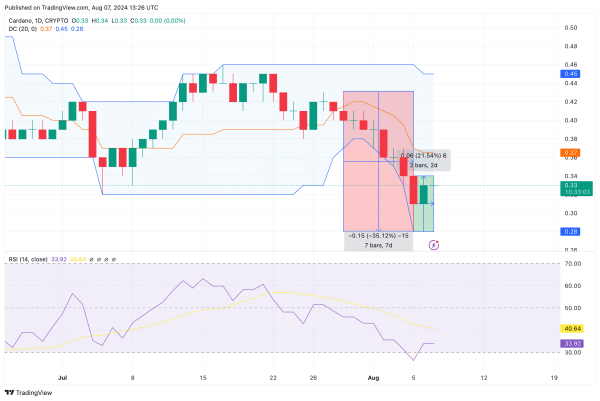
Cardano Price Action (ADA/USD) | TradingView

Looking at the chart above we see how ADA price had declined 35.12% between July 29 and August 5. Meanwhile the global altcoin market (TOTAL3) only dropped by, 28.66% during that frenetic 7-day sell-off.

This shows that Cardano’s losses during the crash had exceeded in market average my more than 6%. When a mega cap asset like ADA underperforms the market, it is often interepret as a signal that the asset is now undervalued due to increased volume of leverage trade liquidations.

This often encourages strategic traders to buy-in such undervalued assets, in a bid to capitalize on its rebound potential. The ADA/USD chart above has shown early signal of this phenomenon.

Since the Aug 5 crash, Cardano’s price has now rebounded 21.54% as it reached the $0.34 area at the time of writing on Aug 7. But collectively, the altcoin market has only recorded a 19.3% rebound.

This shows that investors look to ape in on ADA after it fell to a new 2024 low on Aug 5, causing it to outpace the market average as the rebound phase begins.

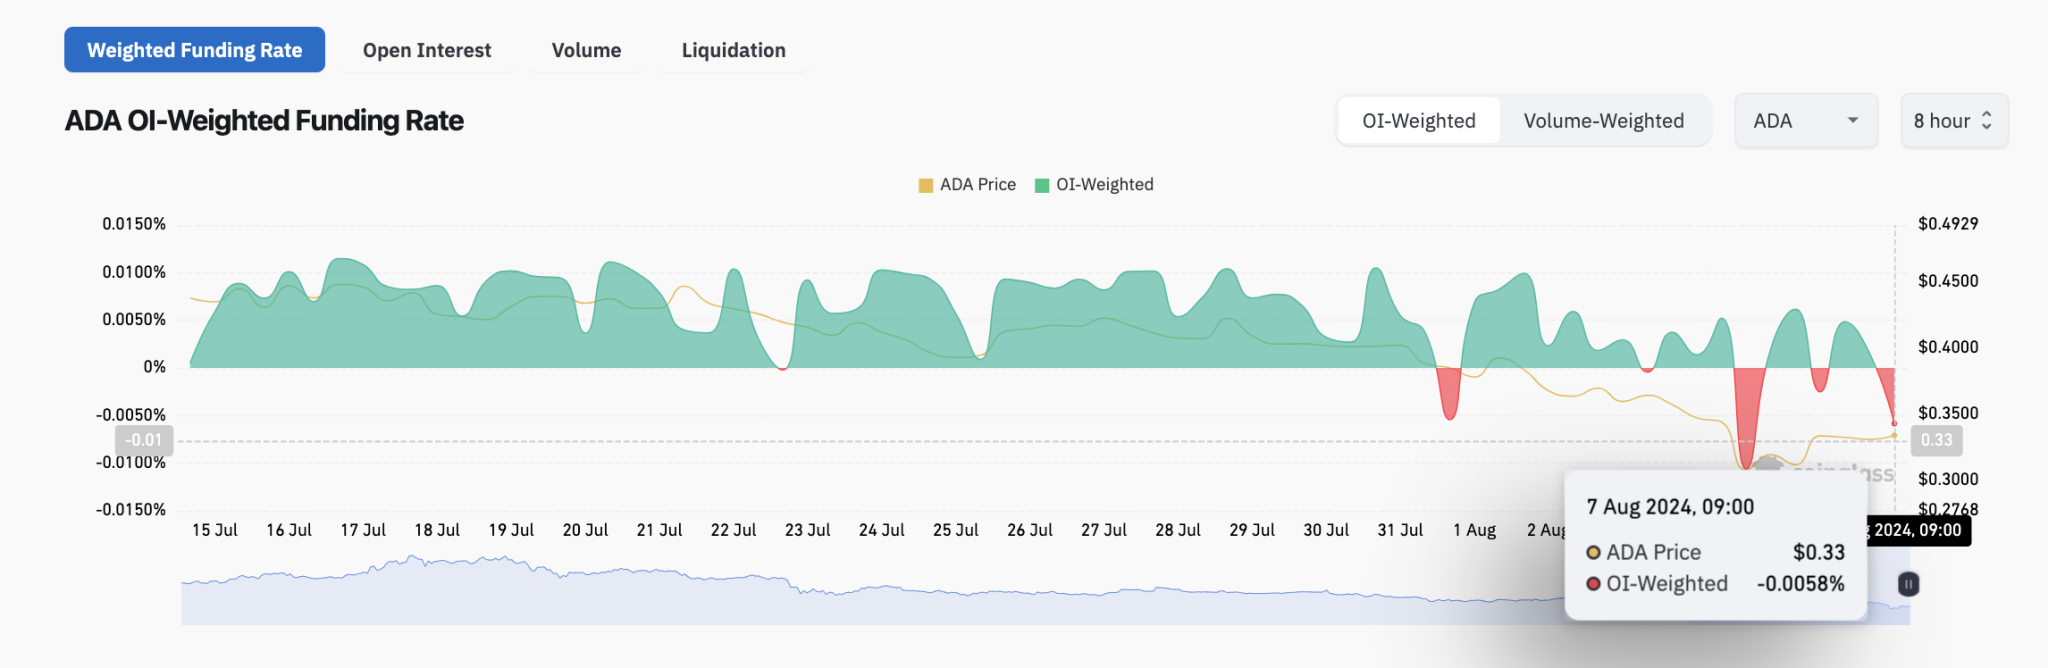
More so, another critical data trend in the ADA/USD derivatives markets also flashes a prolonged bullish rebound signal. The Coinglass Funding rate chart below tracks fees paid between SHORT and LONG position holders to keep leveraged contracts open.

Negative funding rate values signal dominant bearish trades and vice versa.

Cardano Price vs ADA/USD Funding Rate

Looking at the chart above, we see that ADA Funding rate is trending in negative values of -0.006%. This suggests that after the large liquidations on Monday, there’s still significant fear in the market, and ADA is yet to attract a steady flow of new leverage Long positions.

More importantly, ADA’s funding rate trending negative after a 21.54% rebound in the last 48 hours signals more room for additional gains as bull traders gradually return to the derivatives markets in the coming days.

This current market dynamic suggests ADA price could advance further towards the $0.40 area.

ADA Price Forecast: Bulls Eyeing $0.40 Retest

Cardano (ADA) has shown signs of a potential bullish reversal after a steep decline from $0.42 to $0.28 over the past seven days. The daily chart reveals that ADA experienced a 35.12% drop, followed by a minor recovery.

Currently, the price is consolidating around the $0.33 mark, indicating that the bears are losing momentum. The RSI indicator, although still in bearish territory at 33.92, has started to curve upwards, suggesting a potential increase in buying pressure.

The Donchian Channels are reflecting a range between $0.28 and $0.45. The lower boundary at $0.28 has proven to be a strong support level, as ADA rebounded off this point. This support is crucial for the bulls to defend in order to maintain the upward trajectory.

Cardano Price Forecast (ADA/USD) | TradingView

On the upside, the immediate resistance is at $0.37, coinciding with the middle line of the Donchian Channel. A successful break above this level could see ADA retesting the $0.40 psychological barrier.

Moreover, the recent bullish candlesticks formed over the last two days indicate that buyers are stepping in. If the price can close above the $0.37 resistance, it will signal a bullish continuation pattern. Traders should watch for volume confirmation to support this upward move, as a surge in daily market volume alongside a price break can further validate the bullish trend.

A sustained break above $0.37 could propel ADA toward the $0.40 mark, providing an optimistic outlook for the bulls. However, if the $0.28 support fails to hold, ADA may revisit lower levels, potentially testing $0.25.

Polygon Double Bottom Targets $1 Amid 63% Rise in Txns

Polygon (MATIC) hints at a double bottom reversal from crucial support following an intense correction wave. Is the underlying demand sufficient for the next distribution wave to hit $1?

With the altcoin bull market returning gradually, Polygon is preparing to overcome the bearish influence to restart the bull run. Despite a prevailing downfall for months, the altcoin at crucial support finds a trend reversal opportunity.

So, let’s take a look over the Polygon price analysis to find out if this is a worthy buy-the-dip opportunity. 

Polygon Bullish Route from Channel’s Crossroad

Polygon attempts to come back after receiving a massive supply inflow since March 2024. The bulls anticipate a double-bottom reversal for a fresh recovery after hitting the $0.38 support.

Polygon Price Chart
Polygon Price Chart

However, the intense 68% collapse from its 52-week high of $1.29 reveals a massive bearish influence. Furthermore, the intense correction leads to a solid resistance trendline, maintaining a constant supply inflow.

As per the weekly RSI line, the two dips over the 1-week log price chart reveal a bullish divergence at play. This increases the chances of a bullish comeback in Polygon. 

Currently, the MATIC price trades at $0.412, and with a 21% comeback, the weekly candle forms a long tail. Thus, with the growing demand at lower levels, Polygon signals a potential trend reversal. 

Polygon Signals Bullish Momentum with Surging Network Activity 

According to CryptoQuant, recent on-chain indicators in Polygon reveal a bullish trend with a surge in network activity over the past week.

Polygon Network
Polygon Network Growth | CryptoQuant

Transfer volume has increased by 8.15% to hit 72 million MATIC. The number of active addresses has also jumped by 24.04% to 2,696, signaling increased user engagement. Additionally, transactions skyrocketed by 63.21% to 3,401. Essentially, the on-chain data reflects a massive uptick in Polygon network activity. 

A Bullish Drive Chances for Polygon 

Bulls are on overdrive with the growing underlying demand as market and network metrics see an uptick. Hence, the overhead trendline breakout will indicate a buying opportunity’s price action.

As per the Fibonacci levels, the uptrend in MATIC could reach the 23.60% Fibonacci level at $0.616. Optimistically, a broader market push could pump the altcoin to the $1 mark. 

3 Bitcoin (BTC) Price Indicators to Watch after 30% Crash

Bitcoin price fell as low as $49,111 on Monday Aug, 5, three technical price indicators suggest BTC is now headed for an imminent bullish reversal as the month unfolds. 

BTC Rebounds 16% after Monday Bloodbath

The global crypto markets suffered extreme turmoil on Monday Aug 5, with Bitcoin price experiencing its worst 7-day timeframe since in 2-years. Despite bullish catalyst from the US Fed hinting at rate cut in September, several bearish catalysts unfolded within a short-term window.

Bitcoin Price action (BTC/USD) | TradingView
Bitcoin Price Action (BTC/USD) | TradingView

Looking at the chart above, we see how Bitcoin price declined 29.77% between July 29 and Aug 5. Notably, the last time Bitcoin experienced this level of negative price action was during the FTX crash in 2022.

Evidently the BTC price crash was largely exacerbated by the $700 million liquidations in the derivatives market which saw highly leveraged traders book historic losses. However,  Bitcoin price has now made a rapid 16.68% recovery from the dramatic plunge recorded on Monday, to reclaim the $57,550 mark at the time of writing on Aug 7.

This suggest that strategic traders are capitalized on the market dip to bolster their BTC holdings at a discount. 3 technical market indicators suggest that this buying spree could propel Bitcoin price towards the $70,000 mark.

1. Balance of Power suggests Buyers in Control

The Balance of Power (BOP) indicator is a technical analysis tool used to measure the strength of buying and selling pressure in the market. It calculates the difference between the high and low prices for each period and oscillates around a zero line. When the BOP indicator has a positive value, it suggests that there is buying pressure, and when it has a negative value, it indicates selling pressure. This information can be valuable for traders and investors to gauge market sentiment and potential price movements.

BTCUSD 2024 08 07 11 16 48
BTC/USD Price Analysis: Balance of Power | TradingView

On the BTC/USD daily chart, the BOP is currently trending at 0.68, which is relatively high. This suggests that buyers are currently in control, which can be interpreted as a bullish signal for Bitcoin.

A high BOP value, especially after a period of declining prices, could be a prime indicator of fatigue among sellers as buyers step in, potentially leading to a prolonged upward Bitcoin price momentum in August 2024.

2. ADL Flashes Bullish Advance Signals

The Advance Decline Line (ADL) is another key indicator flashing bullish signals for Bitcoin price action. This indicator tracks the cumulative difference between advancing and declining assets. Typically, a rising ADL suggests that asset price is advancing more intensely than it is declining, indicating overall market strength.

BTC/USD Price Analysis: Advance Decline Line (ADL) | TradingView

As seen in the chart above, the ADL is currently around 1,515.54, which is on an upward trajectory. This positive movement in the ADL indicates that there are more advancing issues than declining ones in the market, suggesting broad-based buying interest.

For Bitcoin, this broad market strength can be a bullish signal as it reflects positive investor sentiment and a potential for further price increases as more assets participate in the uptrend.

3. BTC Price Forecast: Bollinger Bands Show Key Resistance at $59,500

Bitcoin (BTC) has experienced a notable rebound over the past two days, climbing 16.68% from a low of $55,598.19 to the current level of $57,586.78 as of August 7, 2024. This recovery follows a sharp decline, where BTC lost nearly 30% in the preceding week. Technical indicators now suggest a potential shift in market sentiment.

The Bollinger Bands, a volatility indicator, reveal key resistance at $59,500. This resistance level coincides with the upper band, which BTC needs to break through to confirm a bullish continuation.

Bitcoin Price Forecast (BTC/USD)

The middle band, around $64,070.70, serves as a secondary resistance, aligning with the 20-day simple moving average (SMA). A successful break above these levels could propel BTC towards the $72,746.77 mark, the upper extreme of the Bollinger Bands.

On the support side, the lower Bollinger Band at $55,394.64 acts as a critical level to watch. If BTC fails to sustain its current rally, a drop below this support could signal a return to bearish sentiment, with potential downside targets around $50,000.

However, the recent price action suggests bullish momentum is building, provided BTC can maintain support above the $55,394 lower band.

Nasdaq, and BlackRock Seek Approval for Options on Ethereum ETF Amid Strong Performance

0

Nasdaq and BlackRock have filed with the Securities and Exchange Commission (SEC) to list and trade options for BlackRock’s spot Ethereum exchange-traded fund (ETF). 

Notably, a final decision from the SEC is anticipated by early April 2025. This news notably comes on the heels of an impressive performance by BlackRock’s spot Ethereum ETF, which was approved in May and began trading in July.

Now, the crypto ETF manager is seeking a rule change to allow the listing and trading of options contracts for the iShares Ethereum Trust. For context, Options grant the holder the right to purchase or sell an asset, like a stock or an exchange-traded product, at a specific price before a designated expiration date.

Details of the ETF and Trading Proposal

According to the filing, the ETF aims to track Ethereum’s performance before expenses and liabilities, offering investors an alternative to direct Ethereum investment via public securities markets.

Managed by BlackRock Fund Advisors, the ETF’s assets include Ethereum, which is held by Coinbase Custody Trust Company, and cash, which The Bank of New York Mellon manages. The ETF simplifies Ethereum investment by bypassing the complexities of direct acquisition and trading.

The proposal also suggests expanding the list of ETFs eligible for options trading to include BlackRock’s ETF. It highlights the Trust’s structure, emphasizing the secure custody of Ethereum assets and the administrative roles involved. Additionally, the ETF operates under a trust agreement with Wilmington Trust, which serves as the Delaware Trustee.

Expert Specifies Dates

Adding to the anticipation, Bloomberg analyst James Seyffart noted the SEC’s decision is expected around April 9, 2025. The approval process involves multiple regulatory bodies, ensuring comprehensive oversight.

For instance, the SEC’s decision will consider input from the Options Clearing Corporation (OCC) and the Commodity Futures Trading Commission (CFTC).

This filing coincides with BlackRock’s spot Ethereum ETF seeing $109.9 million in inflows on August 6, bringing total inflows to $869.8 million since its launch on July 23.

According to Farside Investors, this marks the ETF’s third biggest inflow day as investors sought to capitalize on Ethereum’s 18% price drop on August 5. The ETF ranks among the top six best-performing ETFs launched in 2024, with four of the others being spot Bitcoin ETFs.

Expert Pinpoints 7 Factors to Drive XRP Price to Double-digits

Jay Grissom, a full-stack developer with over two decades of experience in trading, has identified seven factors that could be crucial in driving the value of XRP to the double-digit region.

First, Grissom cited the significance of XRP’s regulatory clarity. He noted that when Ethereum obtained similar “clarity,” its value skyrocketed from $7 to $1,500 in less than a year. However, it is important to clarify that Ethereum took several years to rise from $7 in 2016 to $1,500 in 2021.

Furthermore, Grissom highlighted the significance of the upcoming Ripple stablecoin, RLUSD, on the XRP Ledger. He pointed out that when a network launches a stablecoin, it often leads to substantial gains for the network’s native asset. This is because traders can easily move in and out of assets on the network.

Grissom cited the example of the BNB Chain ecosystem. He noted that BNB surged by 3,100% after the now-defunct BUSD stablecoin launched in September 2019. 

Notably, at that time, BNB averaged around $20. Indeed, it experienced a 31X increase over the years, reaching a peak value of over $650 in 2021.

XRP ETP, CME Announcement, and Clarity for Ripple

Additionally, the seasoned trader mentioned the recent introduction of an XRP-based Exchange Traded Product (ETP). While he remains uncertain about the exact impact this ETP might have on XRP’s value, he is optimistic about its potential benefits.

Notably, an XRP ETP launched in July on Nasdaq Stockholm, the leading stock exchange in the Nordic region. This product provides investors with an opportunity to gain exposure to XRP’s performance. Earlier in February, European asset manager Valour also introduced an XRP ETP on the Nordic Growth Market.

Furthermore, Grissom cited the significance of the CME’s announcement of an official price index for XRP. Accordingly, he expressed optimism that once the SEC lawsuit is resolved, XRP will be traded as a commodity, similar to oil, rather than as a security. 

It is important to note that the court has already ruled that XRP is not a security. The remaining litigation pertains to Ripple’s sales to institutional investors.

Grissom believes that the final resolution of the Ripple lawsuit will have substantial bullish implications for XRP, providing clarity for Ripple.

Altcoin Season, Robinhood Acquisition

He also mentioned that the post-Bitcoin halving altcoin rally typically leads to inflated price action over the subsequent 6 to 18 months. XRP could be one of the beneficiaries of this trend.

Lastly, Grissom is also optimistic about XRP due to Bitstamp, a Ripple partner that offers international FX trading over the XRP Ledger, being acquired by Robinhood, a popular retail trading platform. 

He expects that this acquisition will lead to increased support for XRP, making it available as a trading pair with various national currencies on Robinhood.

Notably, XRP currently trades at $0.518. It demands a momentum that sparks a 1,830% price increase to enter the double-digit range.

Donald Trump’s Son Teases Big Crypto News as Election Nears

0

As the U.S. elections draw near, political figures, including GOP presidential candidate Donald Trump, are increasingly engaging with the crypto industry.

Eric Trump, son of former President Donald Trump, has hinted at a significant upcoming announcement related to cryptocurrency and decentralized finance (DeFi). He mentioned his newfound interest in the sector, generating considerable discussions despite the lack of specifics.

Screenshot 26

Recall, previously, Eric Trump made headlines for distancing himself from “Trumpcoin,” a memecoin allegedly created by him and made to associate with the Donald Trump media. His recent comments however indicate a notable shift towards embracing the crypto sector.

Community Reactions and Bitcoin Campaigns

The crypto community, known for its vibrant discussions, quickly responded to Eric Trump’s teaser. Some users questioned his experience in DeFi, while others speculated about potential regulatory changes. 

One commenter advised caution against launching new crypto initiatives until the SEC’s position is clearer. Another suggested leveraging influence to address specific SEC cases and promote Bitcoin during Donald Trump’s upcoming interview with Elon Musk.

It is notable that former President Donald Trump has made Bitcoin a central theme of his 2024 campaign. His involvement in the Bitcoin Conference 2024 and selection of a pro-Bitcoin running mate, J.D. Vance, highlights his dedication to the crypto industry. 

Notably, there are reports that Trump plans to discuss Bitcoin in an interview with Elon Musk, generating significant interest among crypto enthusiasts.

Peter Schiff’s Previous Critique

Amid these crypto moves, Bitcoin critic Peter Schiff has previously ignited debates by claiming that Trump’s Bitcoin support is a strategic move to garner votes.

Following the Bitcoin Conference, where Trump was a prominent speaker, Schiff argued that Trump’s promises to establish Bitcoin as a reserve asset were politically driven and unlikely to be realized. 

Despite Schiff’s criticisms, the concept of Bitcoin becoming a U.S. reserve asset has gained traction. Pro-Bitcoin Senator Cynthia Lummis has already introduced a bill to this effect. Schiff’s words ignited conversations among the crypto community, some linking his criticism of Bitcoin to his preference for gold.

Recovering Ethereum ETFs Tease ETH Bull Run To $3,000

The bullish recovery in Ethereum is slower than anticipated as it crosses $2,500. However, the rising Ethereum ETF inflows teases an uptrend in the biggest altcoin reach. Will $ETH hit the $3,000 mark this month?

As the crypto market cap, including Bitcoin, jumps back to $1.978 Trillion, a 16% surge in 52 hours. With Bitcoin hitting the $57 mark today, Ethereum remains undershadowed with minimal recovery over the same time span.

Standing above the $2,500 pivot, Ethereum makes a second consecutive bullish candle. Will the recovery rally overcome the bearish influence of last Monday’s 10% bloodbath?

Ethereum Bullish Route from Channel’s Crossroad

Following a 28% freefall in 7 days, Ethereum hits a long-coming support trendline in the 1D chart. The downfall triggered a low of $2,116, but the underlying demand managed to pump up the closing price to $2,420.

Ethereum Price Chart

The residual bullish reversal and the improving global market sentiments result in a new bull cycle in Ethereum. With a morning star pattern, $ETH is trading at $2,518 amid an intraday gain of 2.24%.

As per the Pivot Points standard (monthly), the lower price rejection occurs at the third support level, S3, at $2,086. Currently, the recovery rally is reclaiming the S2 level, at $2,447. 

Furthermore, the oversold daily RSI line at 26 suggests 74% bearish dominant moves over the last 14 days. Hence, with the recent uptick, the chances of a bullish recovery are rising for Ethereum. 

Rising Ethereum ETF Inflows Brings Relief 

Overcoming days of massive outflows the Ethereum spot ETF made a significant comeback on Aug. 6. The products recorded a net inflow of $98.3006 million, showcasing a renewal in investors’ interest. 

US ETH Spot ETF
US Ethereum Spot ETFs

Amid the net inflow, Grayscale failed to turn positive and marked an outflow of $39.7293 million, indicating minor withdrawals. BlackRock and Fidelity respectively witnessed inflows of $110 million and $22.4894 million, pushing the net flow into the positive zone.

With a bullish day, the total net asset value has reached an impressive $7.06 billion.  

Will Ethereum Sustain above $2,500?

As the broader market recovers, Ethereum’s uptrend struggles to gain momentum. The morning star pattern, coupled with the lower price rejection, teases a new bull cycle. 

As per the pivot points, the overhead targets for the second-biggest crypto are at first support level, S1 at $2,839, and the pivot level at $3,201. On the downside, a break under the support trendline could find support at the psychological mark of $2,000.

Here are Returns on $1,000 Cardano Investment If ADA Hits $100, $300, or $500

0

An investment of $1,000 in Cardano at the current price of $0.3347 could be worth a fortune if ADA surges to ambitious targets of $100, $300, or $500. 

Like most major crypto assets, Cardano (ADA) observed its fair share of the recent market bloodbath, with its price plummeting to a yearly bottom of $0.2799 on August 5. However, the token witnessed a quick recovery that saw it climb above the $0.3 mark. 

Despite the recovery, ADA is still below its yearly high of $0.807, registered on March 6, 2024. At the current price of $0.3347, Cardano is down 58.52% from this level.

Consequently, 76% of all ADA holders are currently at a loss at the current price, while 19% are in profit, according to data from IntoTheBlock. The remaining investors are at breakeven, suggesting they neither hold ADA at a loss nor profit. 

Timeline for ADA Potential Surge to $100, $300, and $500 

Although Cardano’s current performance is below expectations, market watchers remain confident in the project. They believe the 10th-biggest cryptocurrency by market cap would rally to unprecedented levels, such as $100, $300, and $500. 

To hit the $100, $300, and $500 targets, Cardano must respectively surge 29,777%, 89,532%, and 149,287% from the current price of $0.3347. 

Data from Changelly suggests that Cardano might hit the $100 target by March 2040. In addition, Changelly analysts see Cardano hitting the $300 and $500 targets by September 2040 and September 2050, respectively. 

Consequently, we analyzed how much a $1,000 investment in ADA today would be worth if Cardano hits these ambitious targets. 

Returns on $1,000 Cardano Investment If ADA Hits $100, $300, or $500 

With Cardano priced at $0.3347, an investment of $1,000 would fetch you 2,987.75 ADA tokens. Interestingly, these 2,987.75 ADA would be valued at $298,775 if Cardano’s price surges to $100. 

At $300 per ADA, the tokens’ value will surge to $896,325. Lastly, an investment of $1,000 could skyrocket to $1,493,875 ($1.49 million) should ADA’s price increase to $500. 

While the potential return on investment (ROI) looks enticing, it is important to note that there is no guarantee that Cardano will reach these ambitious targets in its lifetime. Cardano’s peak price, attained on Sept. 2, 2021, remains at $3.1, reflecting an 89.2% dip from the current price. 

Nonetheless, Cardano could reach these targets through increased institutional adoption and the launch of new products, among others.