Home Blog Page 1333

Here is Price of Shiba Inu if SHIB Matches Solana Market Cap

The SHIB price could soar by over 700% if Shiba Inu attains a market cap similar to the over $85 billion valuation Solana (SOL) currently enjoys.

Shiba Inu has been struggling recently amid consecutive days of price depreciation. Presently, Shiba Inu hovers at around $0.00001600, with a market cap of $9.9 billion.

On the other hand, Solana has demonstrated a more impressive performance, recently surpassing BNB to become the closest altcoin contender to Ethereum. This emerged as the price of SOL re-entered the $180 range, boasting a market cap of over $85.14 billion.

Notably, there is a staggering difference of over $75 billion between the market capitalizations of Shiba Inu and Solana. Based on this context, The Crypto Basic examines the fascinating prospect of Shiba Inu’s potential market value if it attains the same market cap as Solana.

Shiba Inu Price with Solana $85B Market Cap

Notably, Shiba Inu battles with an excessive token supply of over 589 trillion. If the community orchestrates no substantial token burns and the supply remains static, a market cap of $85 billion would correspond to a price of approximately $0.00014415 per SHIB token.

Shiba Inu ChatGPT estimations

This projected price represents a substantial 762% surge from Shiba Inu’s current market value of $0.00001675. Furthermore, it far surpasses the coin’s 2021 all-time high of $0.00008845.

In essence, reaching an $85 billion market cap would be a historic milestone for the popular meme coin, marking a new record in its trajectory. This raises the question of when or if Shiba Inu can achieve this outlook.

When Can SHIB Hit $0.000144?

According to researchers at the Changelly crypto exchange, Shiba Inu will break the $0.0001 barrier by 2027 and continue to rise to $0.000144 by 2028. Similarly, analysts at Telegaon, a prediction outlet, share an optimistic view. Specifically, they forecast an average value of $0.000153 for Shiba Inu by 2027.

While the predicted timelines may seem distant, Shiba Inu enthusiasts are more optimistic. They believe that the $85 billion market capitalization and $0.000144 price milestones are achievable as early as 2024 or, at the latest, 2025.

For example, influential pundit Jake Gagain has reiterated his bold prediction that Shiba Inu will reach a $100 billion market cap in this bull cycle. Notably, this valuation would put SHIB at a historic price of $0.00016. 

Meanwhile, other analysts are drawing parallels with past trends to suggest a bullish price target of $0.0002 for SHIB this season.
Tether Reveals $5.33B Excess Reserves and 80K BTC Holdings in Q2 2024 Report

0

Paolo Ardoino, CEO of Tether, recently took to X to announce the release of Tether’s Q2 2024 attestation. 

According to Ardoino, the report proves Tether’s robust financial position and commitment to stability and transparency in the stablecoin market. Tether’s Q2 2024 attestation reveals a net operating profit of $1.3 billion for the quarter, leading to a record $5.2 billion profit for the entire H1 2024.

The company also observed a $520 million increase in its equity in Q2 2024, now totaling $11.9 billion. Tether’s excess reserves stood at $5.33 billion, an effort at ensuring stability.

Tether’s Bitcoin Holdings Reach 80,000

Additionally, Tether’s holdings include approximately 80,000 Bitcoin and over $97.5 billion in U.S. Treasuries. This represents a $7 billion increase from the previous quarter, marking a new all-time high and positioning Tether 18th in global rankings of U.S. debt holders, surpassing nations like Germany and Australia.

According to the report, Tether’s primary goal is to maintain a solid, stable, and resilient stablecoin. The company’s decision to keep $5.33 billion in excess reserves, beyond the 100% backing of all issued tokens, aims to protect its global user base, especially in emerging markets with high inflation rates.

Many users rely on USDT as a trusted digital dollar to safeguard their savings against rapidly devaluing local currencies.

Strategic Investments and Corporate Mission

Elsewhere, Tether’s strategic investments reflect its commitment to innovation and resilience. The company’s investment portfolio, valued at approximately $6.56 billion, focuses on areas aligned with its core mission, including AI, biotech, and infrastructure. 

Notably, Tether has invested in Northern Data Group to enhance access to AI infrastructure and Blackrock Neurotech to develop brain-computer interface technology. These investments aim to support advancements that can significantly impact human evolution and accessibility.

Stablecoin Issuance: A Continuing Trend?

The Q2 2024 report also comes on the heels of Tether Treasury minting 1 billion USDT on the Tron Network, continuing its trend of large-scale stablecoin issuance.

Historical data suggests a correlation between USDT minting and Bitcoin price movements, with significant minting events often preceding bullish trends in Bitcoin’s market performance. 

A report by CryptoQuant noted that the circulating supply of USDT has increased by 30 billion since late 2022, traditionally boosting market liquidity and investor confidence.

Market Veteran Brandt Identifies Bitcoin Lower Lows Amid Economic Tensions: Where to Next?

0

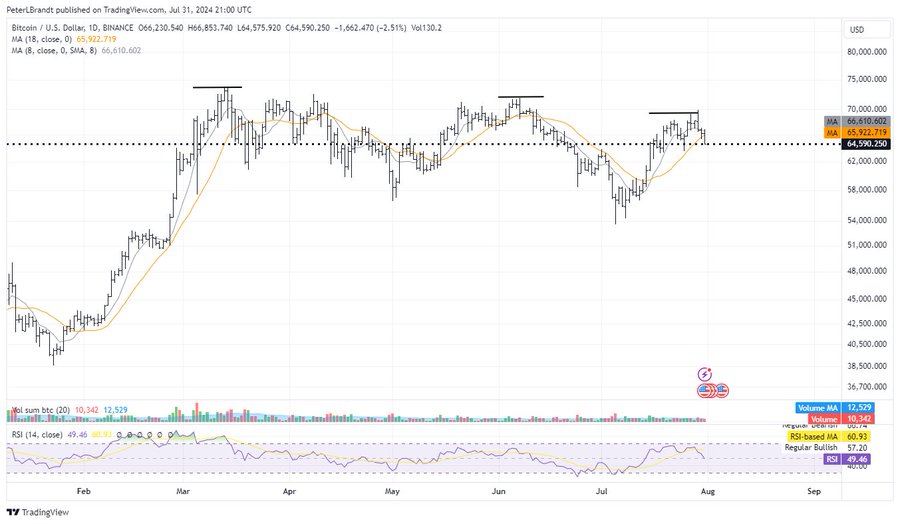
Veteran trader Peter Brandt identifies a series of lower highs and lower lows that has plagued Bitcoin amid geopolitical and economic tensions.

Bitcoin (BTC) has been facing a downward trend since July 29 after it hit a high of $70,016. This downtrend has triggered three consecutive days of declines for the premier cryptocurrency, with the bears threatening to engineer another intraday loss today.

Bitcoin Records Lower Highs and Lower Lows

Amid the recent collapse, Brandt recently identified a broader trend of lower lows and lower highs that Bitcoin has been subjected to in recent times. His recent analysis highlights the bearish signals in the cryptocurrency market.

Brandt’s chart illustrates Bitcoin’s struggle to maintain higher levels, with a clear pattern of declining peaks and troughs. In addition, the 8-day MA recently crossed below the 18-day MA. This crossover is often interpreted as a bearish signal, suggesting continued downward pressure on Bitcoin’s price.

Bitcoin Daily Chart Peter Brandt
Bitcoin Daily Chart | Peter Brandt

Meanwhile, volume analysis also supports the bearish outlook. Recent trading volumes have been lower than the 20-day moving average, indicating waning interest and potentially weaker support for higher prices. The Relative Strength Index (RSI) stands at 49.46, which is close to the neutral zone but leaning slightly towards bearish territory.

Notably, the pattern of lower highs and lower lows indicates that sellers are dominating the market. If Bitcoin fails to hold the support level around $62,446, it could see further declines. Conversely, a break above recent resistance levels could signal a potential rebound, but the overall trend remains bearish for now.

Factors Behind the Latest Market Crash

Recent market downturns are attributable to geopolitical tensions. There have been reports indicating that Iranian authorities are considering a retaliatory strike against Israel in response to the assassination of a Hamas leader in Tehran.

This development has raised the threat of a wider conflict in the region, causing increased market volatility and prompting investors to seek safer assets.

Moreover, the Federal Reserve’s choice to keep benchmark interest rates unchanged has contributed to market anxiety. Fed Chair Jerome Powell indicated that no decisions have been made regarding a rate cut in September, leaving investors uncertain about the future course of monetary policy.

Brandt Maintains Bullishness on Bitcoin

Despite the current bearish trend, Brandt had previously expressed a bullish long-term outlook for Bitcoin. In his analysis from July 19, he highlighted a positive development in the Bitcoin/Gold (BTC/GLD) ratio.

Brandt pointed out that the ratio is on the verge of forming a channel that could become the right shoulder of an inverse head and shoulders pattern. This pattern, if it materializes, could project a BTC/GLD ratio of 150, suggesting Bitcoin could potentially outperform gold by a factor of five.

The chart from July 19 shows Bitcoin’s significant rise against gold over the past decade. Despite periods of consolidation and correction, the overall trend has been upward. The current consolidation phase might be a precursor to a major breakout. 

Currently, Bitcoin changes hands at $64,363, having dropped 0.91% this morning. The cryptocurrency has collapsed below the 20-day SMA ($65,531), confirming the bearish trend. Regardless, Brandt maintains his optimistic view on Bitcoin’s trajectory.

Expert Highlights 37 Altcoins to Turn $10,000 into $1 Million

Altcoin Moe, a full-time crypto trader since 2014, shares a list of the top 24 altcoins that has the potential to spike 10x to 100x during the bull season.

As Bitcoin undergoes a quick correction phase from the $70,000 peak, the broader market sentiments are declining. Further, the underwhelming performance of Ethereum ETF is increasing the selling pressure in the altcoin segment.

Altcoin Moe Brings A Bag of High Potential Tokens Before Bull Run

In a growingly bearish crypto market, the seasoned crypto trader Altcoin Moe shares a list of high-performing altcoins. These hand-picked altcoins offer a chance to turn $10,000 to enter the $1 million club in the bull run. Furthermore, these altcoins are segmented on the basis of risk to reward from different segments.

For those on the lookout for safe picks with potential returns of 3x to 10x, Moe highlights top names such as Bitcoin (BTC) and Ethereum (ETH), with Uniswap (UNI), XRP, Cronos (CRO), Arbitrum (ARB), and Mantle (MNT). Furthermore, Brett (BRETT), a newly launched meme coin on the Base blockchain, makes the list. However, the top names are likely to perform less due to their larger market capitalizations. 

The Riskier Choices for Higher Returns

Moving to the moderate risk category, Moe picks up coins for 20x to 30x returns in the next bull run. It includes Injective (INJ), Kaspa (KAS), WOO (WOO), Dogwifhat(WIF), and Bittensor (TAO).

This group also features Fetch.ai (FET) and Render Token (RNDR), known for their unique technological innovations. Manta Network (MANTA), Pepe (PEPE), and ZetaChain (ZETA) are the more unexpected picks in this segment. These highlight Moe’s willingness to bet on niche projects with unique market propositions.

For traders willing to take intermediate risk for 40x to 60x potential returns, the next list includes Router Protocol (ROUTE), Propchain (PROPC), and Mantra DAO (OM). Further, Verasity (VRA), MetisDAO (METIS), and Trias (TRIAS) take the limelight with their unique use cases and growing community support.

MASQ Network (MASQ) and Nakamoto Games (NAKA) offer fascinating picks in the privacy and gaming sectors, respectively. Further, Myria (MYRIA) adds an interesting Layer-2 focus.

For the even higher risk takers, Moe outlines crypto with the 75x to 100x potential returns. This list includes some new names like Dione (DIONE), Popcat (POPCAT), and Rio (RIO), which are still finding their footing in the market.

AI Power Grid (AIPG) and Paal AI (PAAL) reflect Moe’s interest in emerging AI projects. Neiro on SOL (NEIRO), Billy (BILLY), Ponke (PONKE), and ANyONe Protocol (ANYONE) ends the highest risk for the highest reward coins list.

Top Chartist Admits Ignoring XRP for Ages But Now Finds XRP Chart Very Interesting

Scott Melker, the host of The Wolf of All Streets podcast, disclosed that he has not paid attention to XRP charts for a while but now finds them intriguing.

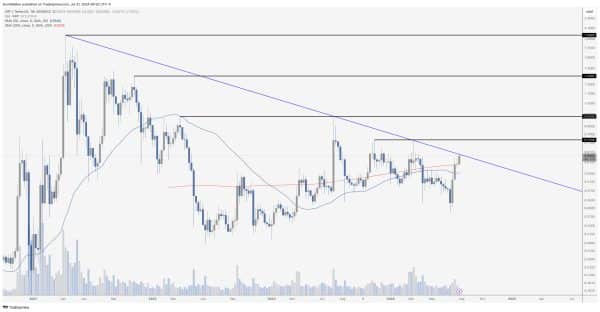
Melker disclosed this in a recent post after analyzing XRP’s pattern on the weekly timeframe. He shared a graph suggesting that XRP is on track to overcome a significant resistance channel.

While acknowledging that a rejection is likely, Melker noted a consequential breakout is on the horizon. Moreover, the analyst underlined that regardless of an individual’s perception of XRP and its performance, this impending price action is worth watching.

Notably, Melker’s latest analysis of XRP comes as the asset outperformed the broader bearish market, staging a solitary comeback while others declined. On Wednesday, XRP surged by over 10%, briefly emerging as the best-performing crypto of the day among the top 100.

This development has sparked renewed interest in XRP, even among market watchers like Melker and Ali Martinez, who rarely comment on XRP’s price action. 

XRP Resistance Levels to Watch

In his latest commentary, Melker identified immediate resistance levels that XRP needs to overcome in its climb to higher prices. These levels include $0.75 and $0.93, which XRP must surpass to reach $1, with additional barriers at $1.3 and $1.9.

XRP chart by Scott Melker

Interestingly, for the more immediate barrier of $0.75, Melker is not the only analyst emphasizing its significance before aiming higher. Analyst “Crypto Adict” also commented on this level yesterday, urging caution against ambitious targets like $100 when there are more immediate challenges.

The impact of this resistance level was evident in March when XRP rallied to $0.744 in one day but failed to continue its ascent.

In his analysis, Ali Martinez echoed Melker’s sentiment by highlighting the $0.93 price level as a significant roadblock. Martinez stressed that once XRP surmounts this level, it will effectively break its nearly seven-year downtrend, opening the door to higher highs.

At press time, XRP is back to just above $0.60 after reaching $0.6556 yesterday, reflecting an 8% decline in the last 24 hours. Notably, XRP’s uptrend was cut short by Bitcoin’s instability, as the premier asset dropped back to the $63K range yesterday.

Expert Says No Worries if You Missed a Good Entry on XRP; More Chances Ahead Before Surge Toward $1

0

Some prominent analysts believe XRP is on track to experience a temporary pullback before recording a more explosive price surge.

This opinion is shared by market watchers Trader Fred and Crypto Ed, who have forecasted a short-term correction before an expected bullish surge. Notably, their analyses came up as XRP outperformed the rest of the market, recording an uptrend where others declined.

XRP witnessed a dramatic rebound following a collapse to $0.54 on July 19. This rebound allowed it to recover the $0.65 high yesterday for the first time in four months. The upsurge marked a 72% increase over a 20-day period, as XRP aimed for $0.70. Amid the rally, Binance XRP deposits exceeded 3 billion tokens on July 29. 

XRP Poised for a Correction

However, the latest analyses confirm that the next direction for XRP is down. Trader Fred identified a significant resistance level at $0.70 that XRP has not yet tested. 

According to his analysis, a correction is imminent before XRP can gather the necessary momentum to break this resistance. His chart indicates several key support levels at $0.5711, $0.5408, $0.4983, and $0.4550, suggesting that the price may decline to these levels before rebounding.

XRP
Image Source: https://x.com/S0LFRED/status/1818733419410714947

An Imminent Rebound Post-Correction

He noted that his plan is to short XRP at this level. He believes this correction is a preparatory phase for XRP to build the strength for a future rally past $0.70. While the market may experience short-term fluctuations before stabilizing, Fred expects an imminent push toward the $1 level.

Meanwhile, another analyst, Crypto Ed, presents a slightly different perspective but aligns with the overall expectation of a short-term correction. 

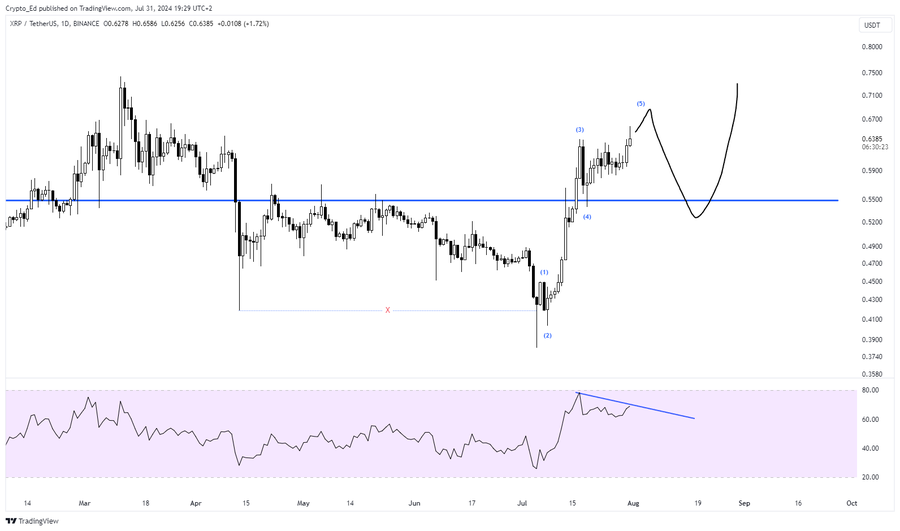
His chart features a completed 5-wave Elliott pattern, indicating the end of a mild bullish cycle and the onset of a corrective phase. He called attention to a bearish divergence in the RSI, where the RSI witnessed lower highs as XRP’s price recorded higher highs. This supports the expectation of a weakening bullish momentum.

Crypto Ed
Crypto Ed

Ed identifies $0.55 as a critical support level where XRP might find stability during the impending correction. His analysis suggests that this pullback will provide an opportune moment for traders to enter the market, as a substantial rebound is expected to follow. 

XRP Current Market Condition

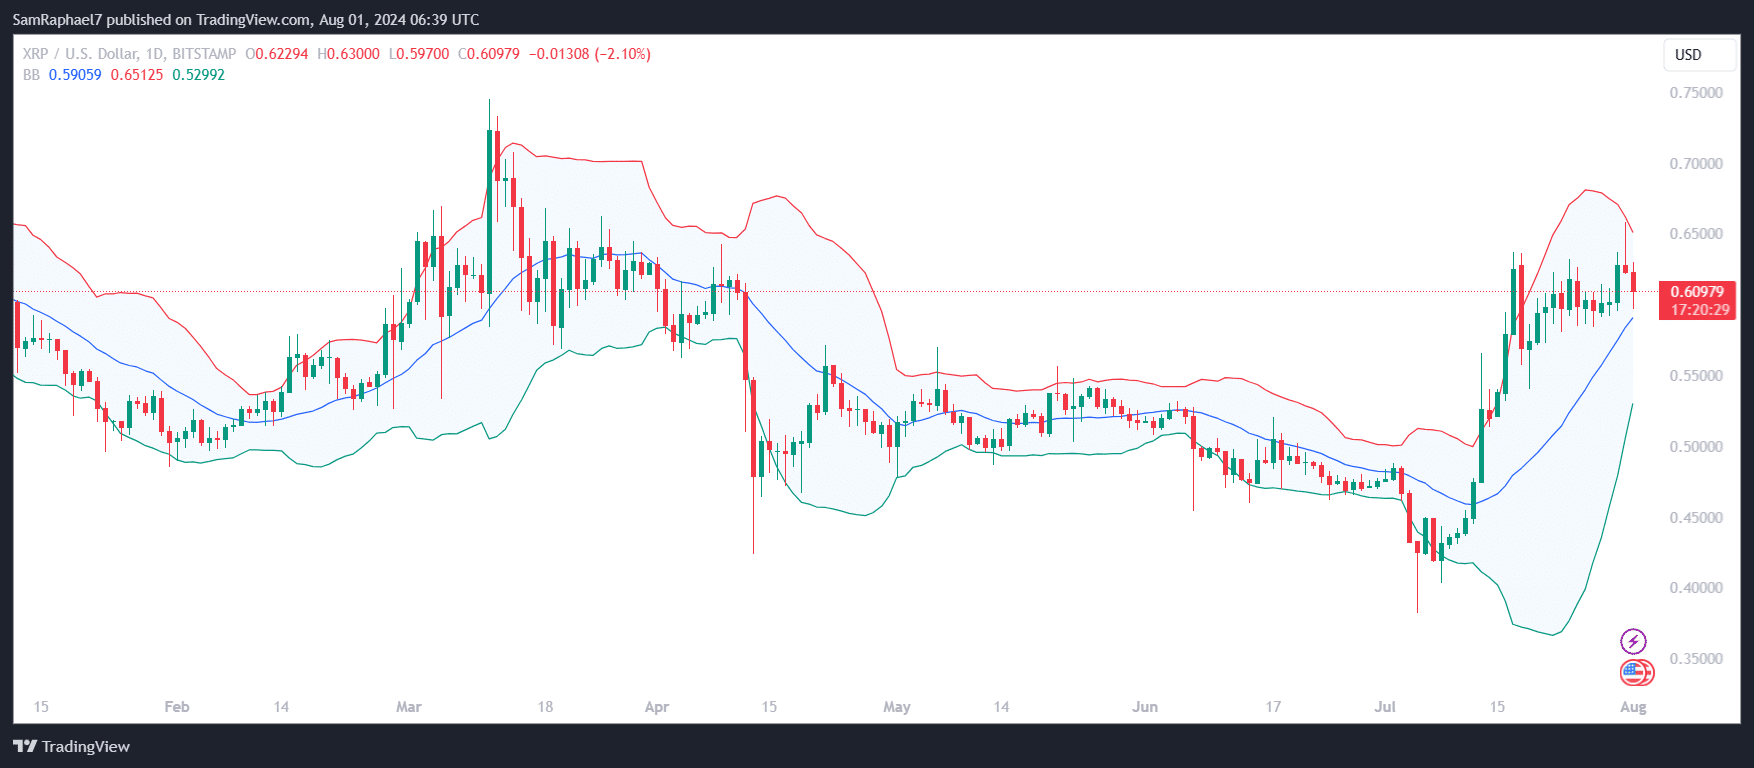
The chart illustrates a potential decline to $0.55, followed by a significant upward surge. Interestingly, at the reporting time, XRP has already begun this corrective phase, having collapsed 2.10% today. XRP is now retesting the psychological support level at $0.60, as the bears attempt to breach this defense.

XRP Daily Chart
XRP Daily Chart

The spike to $0.65 yesterday coincided with a retest of the upper Bollinger Band ($0.6512), resulting in the expected rejection. Currently trading for $0.6097, XRP remains above the 20-day SMA ($0.5906). However, if the bears successfully breach below the $0.60 psychological defense, a retest of this moving average could follow.

XRP Ledger Welcomes Tokenized US Treasury Bills with $10M Backing from Ripple

0

Ripple has made headlines with the launch of tokenized US Treasury bills (T-bills) on the XRP Ledger (XRPL), thanks to a partnership with OpenEden. 

According to the announcement, this move proves an advancement in providing institutional access to decentralized finance (DeFi) through the tokenization of real-world assets (RWAs). The introduction of these tokenized T-bills also shows how blockchain technology is being adopted in traditional financial markets.


Bringing Tokenized T-Bills to XRPL

Notably, OpenEden is pioneering the tokenization of US T-bills, backed by short-term government debt obligations and reverse repurchase agreements secured by US Treasuries. To ensure high security and regulatory compliance, OpenEden enforces stringent KYC and AML screening processes. 

In a show of support, Ripple invested $10 million in OpenEden’s TBILL tokens as part of a larger fund allocated for tokenized T-bills.

Markus Infanger, Senior Vice President of RippleX, noted the utility and opportunities created by tokenizing real-world assets on the XRPL, with institutions increasingly exploring tokenization, the XRPL’s features position it as a leading blockchain for these applications.

XRPL’s Expanding Ecosystem

The XRPL is equipped to handle institutional-grade financial use cases, featuring an Automated Market Maker (AMM), Decentralized Identifier (DID), and native Oracle support. These features make it an ideal platform for RWA tokenization and DeFi solutions. 

Additionally, OpenEden’s achievement of surpassing $75 million in Total Value Locked (TVL) for its tokenized T-bills reflects market confidence. Further, OpenEden’s tokenized US Treasury product has previously earned an investment-grade “A” rating from Moody’s.

OpenEden has attracted a diverse range of institutional clients, including foundations, corporate treasuries, and buy-side funds. Co-founder Jeremy Ng emphasized the importance of bringing tokenized T-bills to the XRPL, enabling purchasers to mint TBILL tokens via stablecoins like Ripple USD upon its launch.

Here is the Only Cardano Address Holding Over 1 Billion ADA

0

Amid a robust holder distribution, the Cardano network only features one wallet address with over 1 billion ADA tokens.

Since its launch in September 2017, the Cardano network has continued to attract investors amid sustained updates. The network has undergone multiple hard forks to evolve with changing demands, with the latest one being the Chang hard fork.

Cardano Holdings Distribution

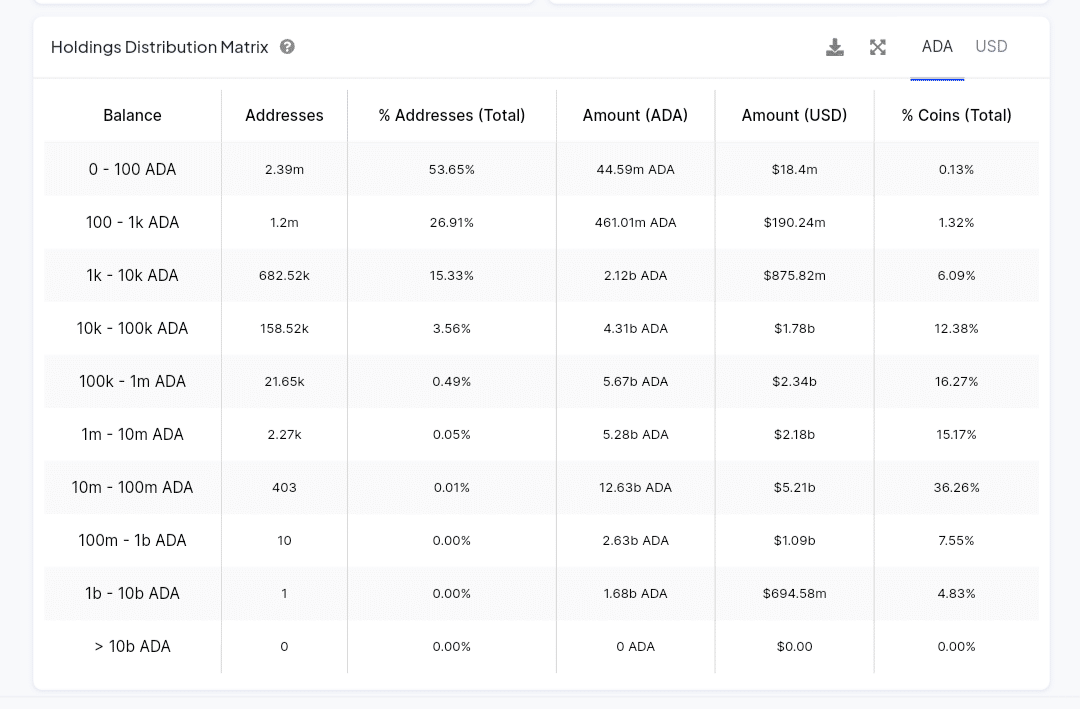
Amid its constant evolution, data from on-chain analytics platform IntoTheBlock indicates that Cardano boasts over 4.45 million addresses. Further, the Holdings Distribution metric shows some interesting insights into the wealth distribution among Cardano investors.

Notably, 2.39 million addresses, about 53.65% of the total 4.45 million Cardano wallets, hold only 44.59 million ADA. These addresses hold 100 ADA and less. The collective balance of these wallets amounts to just 0.13% of ADA’s circulating supply, representing the lowest concentration of holdings for any cohort of addresses. 

Cardano Holders Distribution IntoTheBlock
Cardano Holders Distribution | IntoTheBlock

Meanwhile, wallets holding between 100 and 1,000 ADA amount to 1.2 million, with a collective balance of 461 million ADA. Interestingly, 403 whales holding 10 million to 100 million ADA represent the tier with the largest percentage of supply. They have 12.63 billion ADA, marking 36% of ADA’s supply, in their possession. 

Another interesting data has to do with the number of addresses holding more than 100 million tokens. Those with 100 million to 1 billion tokens are just 10 in number, but they collectively hold 2.63 billion ADA. 

Only 1 Address Holds 1B+ ADA

Meanwhile, there is only 1 address holding over 1 billion ADA. ITB suggests that this address alone holds 1.68 billion Cardano tokens, representing 4.83% of the circulating supply. This is much larger than the 44.59 million ADA held by the 2.39 million addresses with 100 tokens or less.

The 1 address holding more than 1 billion ADA tokens has caught the eye. Consequently, The Crypto Basic launched an investigation into it, with on-chain data confirming that it has a balance of 1.683 billion ADA worth around $694 million. In its first transaction, the address received 671 million ADA from an early Cardano address on August 18, 2020.

It has continued to receive millions of ADA from several addresses, leading to the current 1.683 billion tokens balance. Its last transaction occurred on July 18, involving an inflow of 1,611 ADA. Before now, the address moved out 50 million ADA in two transactions nearly a month apart.

With no tag, it is difficult to confidently ascertain who owns this address. However, suggestions point to the Cardano Foundation or another Cardano affiliated entity. Nonetheless, this remains speculative as of press time with no official confirmation. 

Shiba Inu Price Analysis: SHIB Faces $100M Sell-Off As Bulls to Defend $0.000015 Support

Shiba Inu’s price fell toward $0.00016 on July 31; on-chain data reveals that short-term traders are exiting their SHIB positions, raising concerns of a potential breakdown below the $.000015 level.

Shiba Inu Bulls Retreat toward $0.000016

Donald Trump’s recent appearance at the Bitcoin Nashville conference was expected to trigger bullish sentiment across the crypto market. However, recent market trends suggest that investors’ attention has been mainly focused on the mega-cap assets this week, while the memecoin sector appears to be struggling for traction.

Shiba Inu Price Analysis (SHIB/USD) | TradingView

Since the sell-the-news cycle that greeted the launch of the Ethereum ETFs on July 22, bearish traders have dominated the Shiba Inu short-term market momentum.

This heightened volatility associated with the ETF launch has led crypto investors to adopt a more cautious trading outlook toward Ethereum-hosted assets, including Shiba Inu.

Bears Have Mounted another $100 Million Sell-Wall

As of July 31, the price of SHIB had decreased by 19.18% from its monthly timeframe peak of $0.000018 recorded on July 22. Markets data now shows short-term traders appear to be preparing to abandon the token in favour of better performing assets.

Data from IntoTheBlock’s Exchange Order books provides a clearer picture of this bearish outlook for Shiba Inu.

Shiba Inu (SHIB/USD) Exchange Order Books data, July 31 | IntoTheBlock

The Exchange Order Books, which assess the flow of buy and sell orders, reveal a substantial sell-wall forming. Traders have placed orders to sell over 5.9 trillion SHIB at an average price of $0.000017, representing a potential sell-off worth over $100 million. In contrast, prospective buyers have placed orders for only 3.4 trillion SHIB. This discrepancy indicates an excess supply of approximately 2.5 trillion SHIB in the market.

Based on the fundamental laws of market supply and demand, an oversupply typically exerts downward pressure on the asset’s prices. Additionally, rival top 20-ranked cryptocurrencies including XRP, BCH and ETH have all outperformed Shiba Inu in the past week.

This performance disparity suggests short-term SHIB traders may be inclined to sell off their holdings quicker to re-invest in assets that have performed better within the monthly time frame.

SHIB Price Forecast: Bulls to Defend $0.000015 Support

Shiba Inu’s (SHIB) price performance in July 2024 shows a 19% downtrend in the second half of the month. Bulls attempted a recovery in mid-July, rallying by 58.90% within 11 days, but faced strong resistance around $0.00002151. This resistance level remains a critical barrier for any upward movement.

The Donchian Channel (DC) indicates a current upper limit of $0.00002151 and a lower limit of $0.000015783, highlighting a tight trading range that SHIB is currently confined to. The price is hovering around the $0.000016 level, with immediate resistance at $0.000017967. If the bulls manage to break above this resistance, the next target would be the upper DC limit at $0.00002151.

Shiba Inu Price Forecast (SHIB/USD) | TradingView

The Relative Strength Index (RSI) is at 42.39, suggesting that the market is currently in bearish territory but not yet oversold. This implies that there is still room for a further decline before reaching oversold conditions. The RSI’s recent movement below the 50 level confirms the bearish momentum, indicating that the price may continue to face downward pressure in the near term.

Key support lies at $0.000015783, which coincides with the lower limit of the Donchian Channel. Bulls need to defend this support level to prevent further downside. A break below this support could lead to a steeper decline, potentially towards the $0.00001400 level.

XRP Can Surge to $378 as It Repeats Three Bullish Crosses That Led to a 600x Spike

0

XRP is on the brink of a potentially significant breakout, reminiscent of its 2017 historic surge amid a repeat of three bullish crosses in multiple indicators.

Market analyst JD disclosed this in a recent analysis, highlighting crucial formations and indicators that suggest an explosive XRP surge. The analysis comes amid XRP’s solo run, which has seen the crypto asset reclaim the $0.63 price.

XRP Symmetrical Triangles

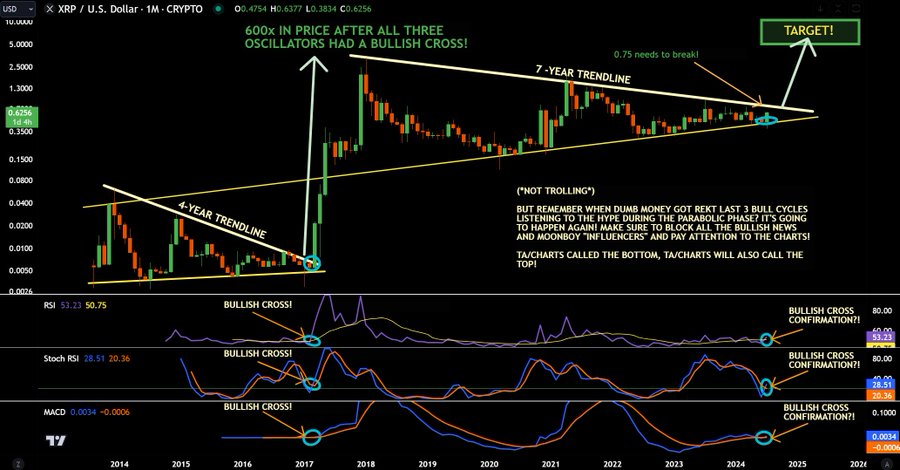
An accompanying monthly chart from JD shows the formation of two symmetrical triangles. The first symmetrical triangle spanned from 2013 to early 2017 on the back of a four-year downtrend. 

This trend ended dramatically when XRP broke above the upper trendline at approximately $0.005, leading to a meteoric rise that saw its price increase 600 times within a year. The upsurge allowed XRP to hit the current all-time high value of $3.31 in January 2018.

XRP Monthly Chart JD
XRP Monthly Chart | JD

Currently, XRP is navigating a second symmetrical triangle that has been forming since it dropped from the $3.31 ATH. This triangle has persisted for seven years and is characterized by a series of lower highs and higher lows, indicating a consolidation phase. 

Interestingly, amid the constant slope, the upper trendline of this triangle now hovers around the $0.75 mark. JD’s chart suggests that this is a crucial resistance level. A break above this line could signal the start of another significant bullish phase.

Three Bullish Oscillator Crossovers

Meanwhile, JD called attention to the importance of the three bullish crosses observed on key oscillators: the RSI (Relative Strength Index), Stochastic RSI, and MACD (Moving Average Convergence Divergence). In 2017, all three indicators showed bullish crossovers before XRP’s explosive rally. 

Data shows that all these three indicators are now showing signs of similar bullish crossovers. Should these crossovers coincide with the symmetrical triangle breakout as observed in 2017, XRP could prepare the groundworks for the much-awaited upsurge.

Notably, the XRP weekly chart shows Fibonacci retracement levels that XRP needs to surpass to confirm the breakout. Immediate resistance levels are identified at $0.6839 (23.6% retracement) and $0.9308 (38.2% retracement). 

XRP Weekly Chart
XRP Weekly Chart

Overcoming these levels would bolster the case for XRP reaching higher targets, such as $1.1303 (50% retracement) and beyond. To break above the symmetrical triangle, XRP only needs to breach the Fibonacci 23.6% retracement.

Moreover, the Aroon indicator on the weekly chart provides additional bullish signals. The Aroon Up line is close to 100%, indicating strong upward momentum, while the Aroon Down line is declining, reflecting weakening bearish pressure. This setup further supports the bullish outlook for XRP.

If XRP surges 600 times its current price of $0.63, the new price would be $378.