Home Blog Page 1341

Shiba Inu Use in Payment Spikes 76% on CoinGate 

0

Lithuania-based crypto payments platform CoinGate highlights a significant increase in Shiba Inu’s (SHIB) use as a payment method.  

According to CoinGate, Shiba Inu recorded a staggering 76% increase in orders on its platform in the second quarter of 2024. 

Factor That Bolstered SHIB Orders 

CoinGate attributed this spike to its expansion of Shiba Inu’s support to other notable networks, including BSC and Polygon, making it convenient for users to adopt SHIB for payments. 

Notably, SHIB’s expansion into the two prominent networks was driven by strong demand from Shiba Inu community members. In its latest report, CoinGate highlighted an X post published in Q2 2024, specifically on May 10, where it confirmed expanding support for SHIB to the BSC and Polygon networks. 

“As a result, this move [expansion] significantly impacted overall Shiba Inu order volumes, with SHIB orders increasing by 76% compared to Q1 2024,” CoinGate remarked.  

Commenting on the development, CoinGate confirmed that the enthusiastic and strong response from the Shiba Inu community reflects the asset’s popularity in the industry. They expressed their excitement to be part of the token’s success. 

Shiba Inu Reacts 

Notably, the official X handle of Shiba Inu called attention to the development via an X post. The ecosystem team said the spike in Shiba Inu orders confirms that “adoption is happening” for the popular dog-themed token. 

Furthermore, it invited Shiba Inu community members to reveal the items they purchased using SHIB. 

CoinGate’s Support for SHIB 

It bears mentioning that CoinGate officially supported SHIB as a payment method in November 2021. Since its integration, SHIB has become one of the platform’s most used crypto payment methods. One year after Shiba Inu’s support on CoinGate, the token ascended to the 12th position among the platform’s preferred crypto payment method. 

In November 2023, Shiba Inu fell to the 15th spot in the ranking. However, users solidified their interest in Shiba Inu as SHIB orders surged 76% in the second quarter of 2024, thanks to the token’s support over the BSC and Polygon networks. 

Shiba Inu Potential Surge: Here’s How High SHIB Could Rise if Bitcoin Hits $2.9M as VanEck Predicts

0

Shiba Inu price could potentially reach unprecedented heights if SHIB follows Bitcoin should the premier crypto asset hit $2.9 million as predicted by VanEck.

Being the firstborn and largest cryptocurrency, Bitcoin has continued to dictate the trajectory of the broader market. Notably, each bull market has begun with a Bitcoin upsurge, as the premier crypto asset typically carries the rest of the market with it when it witnesses a price rally.

SHIB and BTC Price Correlation

The latest bull market is no exception, with BTC recently breaching its all-time high price. However, some cryptocurrencies follow Bitcoin’s trajectory closer than others. For instance, data from IntoTheBlock (ITB) confirms that Shiba Inu has witnessed a 78% correlation with Bitcoin’s price over the last two months. 

Shiba Inu and Bitcoin Price Correlation ITB

Due to this close price relationship, Shiba Inu is likely to move in a similar direction as Bitcoin in most cases. This correlation could be advantageous or detrimental for SHIB’s price. Notably, when BTC records a drop, SHIB sees a similar collapse. However, should Bitcoin witness a rally, Shiba Inu would record an upsurge. 

With Bitcoin experiencing a prevalence of bullish sentiments, this close relationship is welcomed by Shiba Inu investors. Asset manager VanEck has made one of the emerging bullish projections on Bitcoin’s future. Recently, VanEck predicted that BTC could hit $2.9 million by 2050.

Shiba Inu Price if BTC Reaches $2.9M

If Bitcoin reaches this level, the rally could have far-reaching effects on altcoins, especially Shiba Inu. We recently evaluated how much SHIB is likely to increase should this price prediction plays out. 

Notably, BTC currently trades for $67,941 amid an impressive 2.2% increase over the past week. For the cryptocurrency to reach the $2.9 million price target by 2050, as predicted by VanEck, it would have to rally by as much as 4,168% over the next 26 years. 

Shiba Inu has the potential to replicate this run, boasting much higher probability. SHIB currently trades for $0.00001719, having increased 2.9% in the last 24 hours. If SHIB follows Bitcoin’s trajectory and records a similar 4,168% rally, its price would shoot up to $0.00073367 by 2050. 

However, projections from multiple analysts suggest that experts believe Shiba Inu could hit this price sooner. Interestingly, analysts at crypto exchange Changelly predict that SHIB could hit the $0.0007 region between 2033 and 2040. They expect a minimum price of $0.001204 for Shiba Inu by January 2040.

Shiba Inu Price Prediction Changelly 6
Shiba Inu Price Prediction | Changelly

Monthly XRP RSI Set to Break 7-Year Downtrend, Teasing Explosive Surge

0

The monthly XRP RSI is on the verge of breaking above a 7-year downtrend, with analysts expecting an explosive surge to follow.

The crypto market has reached a decisive stage, as prices consolidate following a modest rally to negate the effects of the latest downturn. Specifically, XRP has continued to consolidate between $0.58 and $0.63 throughout this week following its recovery push.

Despite the recent consolidation, which serves as an evidence of a roadblock, analysts remain bullish. The optimism is as a result of the favorable positioning of multiple indicators. XRP RSI (Relative Strength Index) is one such indicator. Notably, the RSI on the monthly timeframe is on the verge of a historic movie.

XRP RSI Poised for a Breakout

Harry, a crypto chartist and analyst, called attention to this impending move on X. In a monthly XRP/USD chart, Harry showed that the XRP RSI has been moving underneath a descending trendline since late 2017. For context, the RSI initially spiked to 94.57 in December 2017 on the back of the XRP rally to $3.3 in January 2018.

As the price dropped from this all-time high value, the XRP RSI witnessed a similar slump on the monthly timeframe. Since then, the RSI has been moving underneath a downtrend that formed from the 94.57 peak in 2017. Data suggests this downtrend could finally give way. 

In addition, Harry’s chart shows an equally bullish pattern on the monthly chart involving the Bitcoin halving. Data confirms that XRP’s price typically witnesses a massive rally months after each Bitcoin halving. This pattern occurred after the May 2016 halving, leading to the upsurge to $$.31 in January 2018.

The pattern repeated after the April 2020 halving, with XRP price surging to $1.96 a year later. Now, with the latest Bitcoin halving taking effect in April 2024, the chances of an XRP uptrend are high. This is bolstered by the imminent breakout of the XRP RSI on the monthly timeframe.

Additional Indicators of an Imminent Uptrend 

Market analyst Charting Guy also spotlighted the imminent bullish breakout in the monthly RSI. He confirmed that XRP price has also been trading within a 7-year symmetrical triangle amid the RSI downtrend. Consequently, a breakout of the XRP RSI could also coincide with a price breakout from the symmetrical triangle.

In addition, Charting Guy showed that XRP typically records a price rally after a third bullish RSI crossover. This bullish crossover typically involves the RSI line (purple) crossing above the Signal line (yellow). XRP has already witnessed two of these crossovers, with the third on the verge of taking effect.

These multiple indicators all point to an imminent XRP rally, but the timing remains uncertain. Charting Guy insists this upsurge could happen in a few months. Notably, XRP currently trades for $0.5993, up 26% this month. 

Here is How Much XRP You Need to Make $1M if XRP Hits $150, $258, $305 and $403

Individuals looking to make $1 million from XRP via ambitious price points in the triple-digit range require a modest initial investment. 

XRP has recently renewed optimism among community members and steadfast holders that their millionaire dreams are still on course. Last week, XRP recaptured a three-month high of $0.6366, even momentarily emerging as the best performer among prominent crypto assets.

Notably, XRP regained $0.6366 in under two weeks after revisiting a 16-month low of $0.385, marking a growth of over 65%. This impressive growth has convinced XRP bulls that they are not missing the 2024/2025 bull season. 

With widespread projections suggesting XRP’s likelihood for more than double-digit values, this article explores the number of tokens an investor must hold to attain a millionaire should XRP attain audacious prices of $150, $258, $305, and $403.

XRP Needed to Make $1M if XRP Hits $150, $258, $305 and $403

To make $1 million via XRP in the hypothetical scenario where its market value attains $150, one must have 6,667 tokens in his portfolio. With XRP trading at $0.5899 at press time, following a brief retracement, acquiring the portfolio costs $3,932.66.

Put differently, an investor stands to see their investments explode by over 253-fold should XRP attain $150. 

Meanwhile, investors targeting to make $1 million from XRP at a price point of $258 require a significantly lower initial investment. Specifically, one needs to hold only 3,875 XRP, which costs $2,286 today, to generate a million at the $258 price.

Similarly, a crypto investor must purchase 3,279 XRP valued at $1,934 today to make $1 million when XRP attains $305. The $403 XRP price point demands the least initial capital commitment. 

To make a million dollars at $403, one must purchase and hold only 2,481 XRP, which costs $1,463 today. Meanwhile, this investment would expand by 68,216% should the ambitious $403 price materialize.

Can XRP Hit $150, $258, $305 and $403?

Considering the ambitious nature of these outlooks and the substantial return, this sparks questions about the timeline and reality.

Analyst Javon Marks strongly believes XRP will reach a $150 price point should it mirror its violent 2017 pump that led to an ATH. He has repeatedly suggested that this outlook is feasible during this bull season.

Due to a MACD flip and RSI divergence, XRP could outperform the crypto market and potentially reach $258. A recent technical analysis by Blockchain Backer highlights this observation, citing similar patterns seen in 2017 and 2021 that led to significant XRP rallies.

Meanwhile, analyst Heikin Ashi foresees a multi-stage rally for XRP in this bull season based on observation of the monthly candle patterns, highlighting a potential top at $305. Other analysts, like JD, have suggested a top at $403 based on similar historical observations.

However, market watchers associated with the Changelly exchange believe these audacious projections would take multiple decades to materialize.

XRP Targets 23% Surge to $0.74 as New Two Week Ascending Triangle Nears Breakout

0

Analysts point to a potential XRP breakout from an ascending triangle, targeting $0.74, which would translate to a potential 23%.

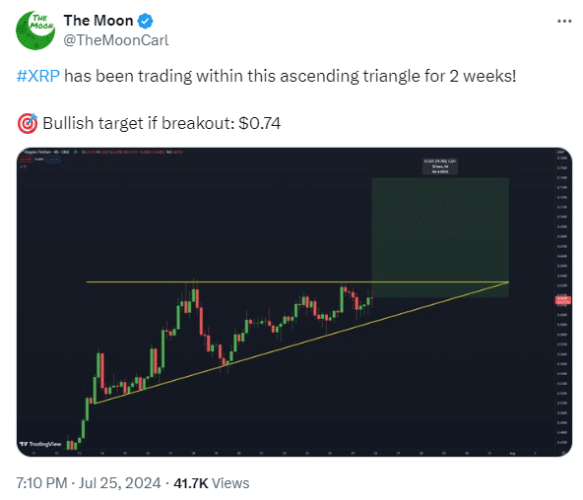
The price action of XRP has caught the attention of prominent analysts on X, pointing to a potentially significant breakout. Carl “The Moon,” the founder of CryptoJobs and technical analyst, recently posted about XRP trading within an ascending triangle.

The analyst observed that XRP had been within this formation for two weeks. Amid this observation, he highlighted a bullish target of $0.74 if a breakout occurs from the pattern.

XRP chart analysis by Carl The Moon

XRP Targeting 23% Surge Upon Breaking Ascending Triangle

Notably, the attention to XRP’s recent price movement is driven by an ascending triangle pattern on the four-hour chart for the XRP/USDT trading pair on the OKX exchange. The Moon shared a snapshot on X, showcasing this pattern with an upper resistance line around the $0.62 level and an ascending support line from approximately $0.53. 

XRP has been trading within this triangle for the past two weeks, with the price nearing the apex, suggesting an imminent breakout. Should the price break above the $0.62 resistance level, the measured move target for this pattern is approximately $0.74. Considering XRP hovers around $0.6 at press time, this target is a potential 23% increase.

Long-Term Consolidation Ending Soon

In a separate analysis, crypto analyst Yoddha emphasized XRP’s long-term consolidation phase in a 15-day timeframe. This long-term perspective illustrated significant historical price peaks after extended periods of consolidation], with major peaks above $0.02 in 2014 and surpassing $3.8 in 2018.

XRP is currently in a six-year consolidation phase, similar to periods before previous large rallies. Yoddha suggested that the current price action testing the upper boundary of the consolidation range points to a potential breakout. This analyst argued that the historical pattern shows that after years of low prices, XRP could be on the verge of a significant rally.

Technical Indicators Support Bullish Sentiment

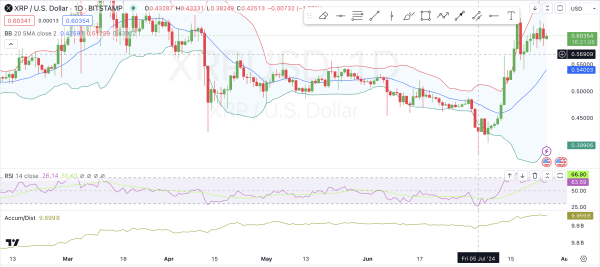
Technical indicators also confirm the bullish trend for XRP. A daily chart for XRP/USD on the Bitstamp exchange, shared via TradingView, displays several key indicators. 

Screenshot 2024 07 26 at 103855

Bollinger Bands plotted with a 20-day simple moving average shows that the price recently broke above the upper band, indicating increased volatility. The Relative Strength Index (RSI) is currently at 66.80, suggesting strong buying pressure but not yet in extreme overbought territory. 

Selling XRP is Now Retarded Move?

Recall, The Crypto Basic reported market expert Alex Cobb’s assertion that selling XRP now would be a “retarded” move, highlighting six factors pointing to an imminent price blast. Cobb emphasized XRP’s recent breakout of a monthly trendline resistance, part of a six-year symmetrical triangle. 

The current price of XRP is $0.6019, boosted by a 24-hour trading volume of $2,123,625,273. This price represents a 1.42% decline in the last 24 hours, though a 9.32% increase over the past seven days.

Michael Saylor Compares Bitcoin to ‘Manhattan in Cyberspace’, Urging US to Own Majority

0

Michael Saylor urges the US to invest in Bitcoin, comparing it to Manhattan in cyberspace and highlighting its potential for economic stability and growth.

In the midst of the long awaited Bitcoin Conference, Michael Saylor, the executive chairman and co-founder of MicroStrategy, has emphasized the importance of Bitcoin for the United States. 

In a statement, Saylor suggested that the US government should own the majority of Bitcoin, likening it to owning “Manhattan in cyberspace.” Saylor drew parallels between historical land acquisitions and the potential value of Bitcoin, emphasizing its importance in securing the nation’s economic future in the digital age.

Historical Comparisons and Economic Strategy

Michael Saylor highlighted how past economically rational decisions, such as the Louisiana Purchase, the acquisition of Alaska, and the development of the Port of New York, significantly boosted the US economy. 

These events expanded the country’s territory and resources, enhancing international commerce and strengthening the dollar. Saylor argued that similar strategic investments in Bitcoin could ensure economic stability and growth, positioning Bitcoin as a crucial asset in cyberspace.

US Government’s Bitcoin Holdings 

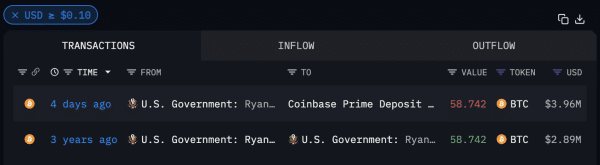
These statements by Saylor come amid reports of a Bitcoin transfer worth $4 million to the Coinbase exchange. This particularly involved digital assets seized in 2021 from a 2018 criminal conviction. 

Screenshot 2024 07 26 at 181513

It also comes amid discussions on the potential for Bitcoin to become a US reserve asset. Notably, recent reports highlighted the Department of Justice’s substantial holdings of approximately 200,000 BTC, making the US the sovereign state with the largest Bitcoin holdings.

Government Actions and Industry Reactions

It is important to note that Saylor has particularly been vocal when it comes to advocating for Bitcoin. Recall that the German authorities recently sold 49,858 BTC tokens, worth approximately $2.9 billion, as part of an emergency action related to a criminal investigation. 

This decision faced criticism from industry leaders who noted that it came at a time when Bitcoin is rapidly gaining recognition from Wall Street. Michael Saylor, along with others, expressed disapproval of the hasty liquidation, suggesting that being without Bitcoin constitutes an emergency in itself. 

Ultimately, Saylor’s company, MicroStrategy, has been a dedicated Bitcoin investor since 2020, with investments exceeding $8.3 billion and an unrealized profit of over $6.2 billion.

Solana Set to Repeat History with 7X Rally to $1,432 in Four Months

Prominent analyst Ali Martinez forecasts a resurgence of history in which Solana could rally by over 700% within the next four months to $1,432.

Solana (SOL) has rebounded notably from the brief Bitcoin-led retracement, now posting a gain of over 6.5% today to trade at $180. At this price, SOL delivers an over 30% return for investors who acquired the asset a month ago.

This impressive performance has attracted the attention of prominent market observer Ali Martinez to explore Solana’s likely future trajectory. Taking to X, Martinez revealed that Solana’s current chart patterns are giving vibes of the 2021 bull season.

Solana Eyes $1,431 with Likely Historical Resurgence

Specifically, Martinez pointed out a symmetry between Solana’s current candlesticks and those of the consolidation phase leading up to July 2021, when the trend shifted. Notably, when the Solana downtrend recalibrated in July 2021, the asset traded at an average of $30.

From then on, Solana engineered an up-only trend, reaching a high of $214 by September 9, 2021. This marks an impressive growth of 616% within two months. The token encountered a brief retracement afterward but resumed the uptrend shortly after. 

Ultimately, Solana set an all-time high of $260 in November that year. Essentially, Solana experienced an over 7X surge within four months, from July to November. 

As Martinez observes a similar trend currently emerging with Solana, he proposes a seven-fold price growth that would add $1,212 to SOL’s value. Notably, this projection potentially puts Solana above $1,432.

Accordingly, the analyst declared that a $1,000 Solana is on the horizon, likely by November, based on historical observation.

Can Solana Surpass $1,000 this Season?

Reacting to Martinez’s bullish sentiment, an X user suggested that expecting a $1,000 Solana this year might be premature. 

This observation is based on the fact that Solana reached its $260 all-time high the year following Bitcoin’s 2020 halving. In contrast, Bitcoin halved just three months ago. In other words, the current bull market may still have many months ahead before reaching similar peaks.

Meanwhile, the expectation of Solana surpassing the $1,000 threshold is not widely shared among market participants. A recent survey by market tracker CoinGecko revealed that only 10.6% of 2,558 respondents in a two-week survey favored above $1,000 for SOL. The majority, one in four respondents, expects Solana to surpass $300 this bull season.

Nonetheless, Solana is renowned for explosive growth; it is currently the best performer among the top-ranking assets, with a yearly return of 637%. A while ago, Solana outranked BNB to become the third-largest crypto behind Ethereum.

Its commendable performance, driven by a surge of meme coin launches on its blockchain, supports the views of analysts predicting Solana will exceed $1,000.

VanEck Sets 3 Price Targets for Bitcoin: $130K, $2.9M and $52.3M

0

Popular Bitcoin and Ethereum ETF issuer VanEck sets three ambitious price targets for BTC by 2050. 

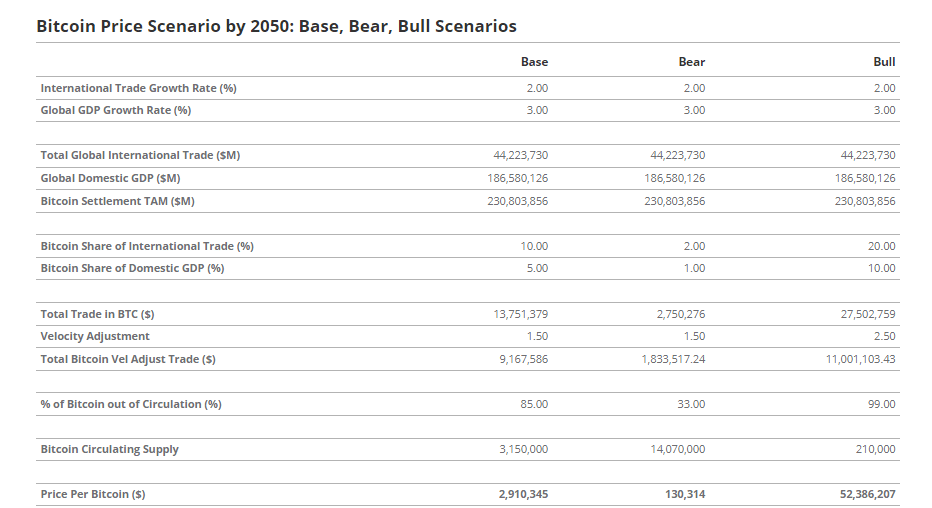
VanEck, one of the issuers of Bitcoin and Ether spot-based exchange-traded fund (ETF), has set three price targets for BTC. For the base case target, VanEck projected that BTC could trade at $2,910,345 ($2.91 million) by 2050, leading to a market capitalization of $61 trillion. 

Potential Factors That Could Drive BTC to $2.91M 

The investment manager speculated that a massive demand for the asset class will propel Bitcoin’s potential surge to $2.91 million by 2050. 

According to a report published yesterday, VanEck predicted that Bitcoin could emerge as a major medium of exchange by 2050. Under the hypothetical scenario, the company foresees Bitcoin being used for 10% of global trade settlements as well as 5% of domestic trade worldwide. 

If both scenarios come to fruition, the top Bitcoin and Ether ETF issuer projected that central banks worldwide might hold 2.5% of their reserve assets in BTC. 

Considering three major factors, like global economic growth, investor BTC demand, and Bitcoin turnover, the top investment manager projected that BTC could be priced at $2.91 million per coin by 2050, with its market cap totaling $61 trillion. 

Hitting the projected price of $2.91 million requires Bitcoin to surge 4,220% or 42.2x from its current price of $67,360. 

Furthermore, applying its existing framework used to value Ethereum Layer-2s, VanEck estimated that Bitcoin’s Layer-2 solutions could be worth $7.6 trillion or approximately 12% of BTC’s valuation by 2050. 

VanEck’s Bear and Bull Case Targets for BTC 

It bears mentioning that the $2.9 million price target for BTC marks VanEck’s base case projection. The investment manager also set bear and bull case targets for BTC by 2050. Interestingly, VanEck set a conservative price of $130,314 as its bear target for BTC by 2050. 

Under a bullish scenario, the company envisions Bitcoin hitting an ambitious target of $52,386,207 ($52.38 million). 

Vanek Bitcoin price predictions
VanEck Bitcoin price predictions

Notably, the asset manager speculated that Bitcoin’s potential surge to these ambitious targets could be partially fueled by a decline in the world’s major economies, including the United States, Japan, and the European Union, compared to global economic activity.  

Additionally, the VanEck report suggests that demand for BTC will spike in the coming years as people lose confidence in major currencies due to unconstrained deficit spending. The report also states that the declining use of the euro and Japanese yen for international settlement creates an opportunity for Bitcoin’s adoption in global trades. 

Shiba Inu Price Analysis: Can SHIB Withstand Bearish Pressure as Investors Favor BTC and ETH

Shiba Inu price dipped to $0.000016 on July 26, 2024, as investors shift focus toward BTC and ETH, here’s what SHIB traders can expect in the days ahead. 

Shiba Inu Dips 19% as Ethereum ETF Hype Cools

Between July 5 and July 18, the global crypto market was agog, as dovish NFP and CPI data revived investor interest in the sector. Like the rest of the market, Shiba Inu raced into a blistering 58.17% rally during those eventful 14 days.

However, things have taken negative turn for SHIB since July 19, amid fresh developments surrounding US political landscape as well as the Ethereum ETF launch.

First, on July 21, Joe Biden dropped out of 2024 Presidential Election race, which swung the campaigns pendulum in favour of Donald Trump. With Trump perceived to be a Bitcoin friendly candidate, this development has pulled investor attention toward BTC.

More so, Ethereum ETFs launched on July 23, sparking a wave of institutional demand for ETH. Within the first two days of trading, Ethereum ETFs recorded nearly $2 billion in trading volumes.

These two critical events appear to have skewed investors’ focus disproportionately toward the BTC and ETH markets over the past week.

Consequently, other crypto sectors, including meme-coins like Shiba Inu (SHIB) have evidently struggled for traction.

Shiba Inu Price (SHIB/USD) | TradingView 
Shiba Inu Price (SHIB/USD) | TradingView

SHIB price rallied 58.17% between July 5 and July 18. But as investors switched focus to BTC and ETH in the aftermath of Joe Biden bowing out, and Ethereum ETFs launch SHIB price has entered a steep downtrend.

The chart above shows that SHIB is now trading at $0.0000017 at the time of writing on July 26, reflecting a 19% decline from the monthly time frame peak of $0.000020 recorded July 18.

This raises concerns that major investors’ switching focus to Bitcoin and Ethereum could be hurting the demand within other crypto sectors.

And with Donald Trump scheduled to speak at the Bitcoin Conference in Nashville this weekend, that gap could widen, likely pulling the Shiba Inu price further downward.

SHIB Price Forecast: Bulls Must Hold $0.000015 Support

Shiba Inu is currently trading at $0.00001675, reflecting a modest 2.19% gain for the day. However, the overall trend appears to be bearish as SHIB faces significant downward pressure after a strong rally earlier in July. The recent price action suggests that bulls need to defend the critical support level at $0.000015 to prevent further declines.

The technical indicators on the chart highlight key resistance and support levels. The 20-day EMA at $0.000017372 is acting as immediate resistance, with further resistance levels at $0.000018572 and $0.000019834.

Shiba Inu Price Forecast | SHIB/USD

On the downside, the crucial support level is at $0.000015, and if the price falls below this level, it could potentially test the next support at $0.000014. The Parabolic SAR indicator is currently above the price, suggesting that the bearish trend may continue in the short term.

The Relative Strength Index (RSI) is hovering around 54.62, indicating that the market is neither overbought nor oversold. This neutral RSI reading suggests that SHIB could consolidate around current levels before making a decisive move.

For the bulls to regain control, SHIB needs to break above the 20-day EMA and maintain that level to target higher resistance levels. Conversely, a failure to hold the $0.000015 support could see SHIB revisiting the lower support levels, potentially leading to further declines.

Dogecoin Price Falters After 52% Rally: Analyzing Potential Causes

Dogecoin price plummeted to $0.13 on July 26, 2024, amid a noticeable lack of institutional interest. Here’s a closer look at what DOGE traders might expect as the month draws to a close.

Dogecoin Falls 19% as Ethereum ETF Excitement Wanes

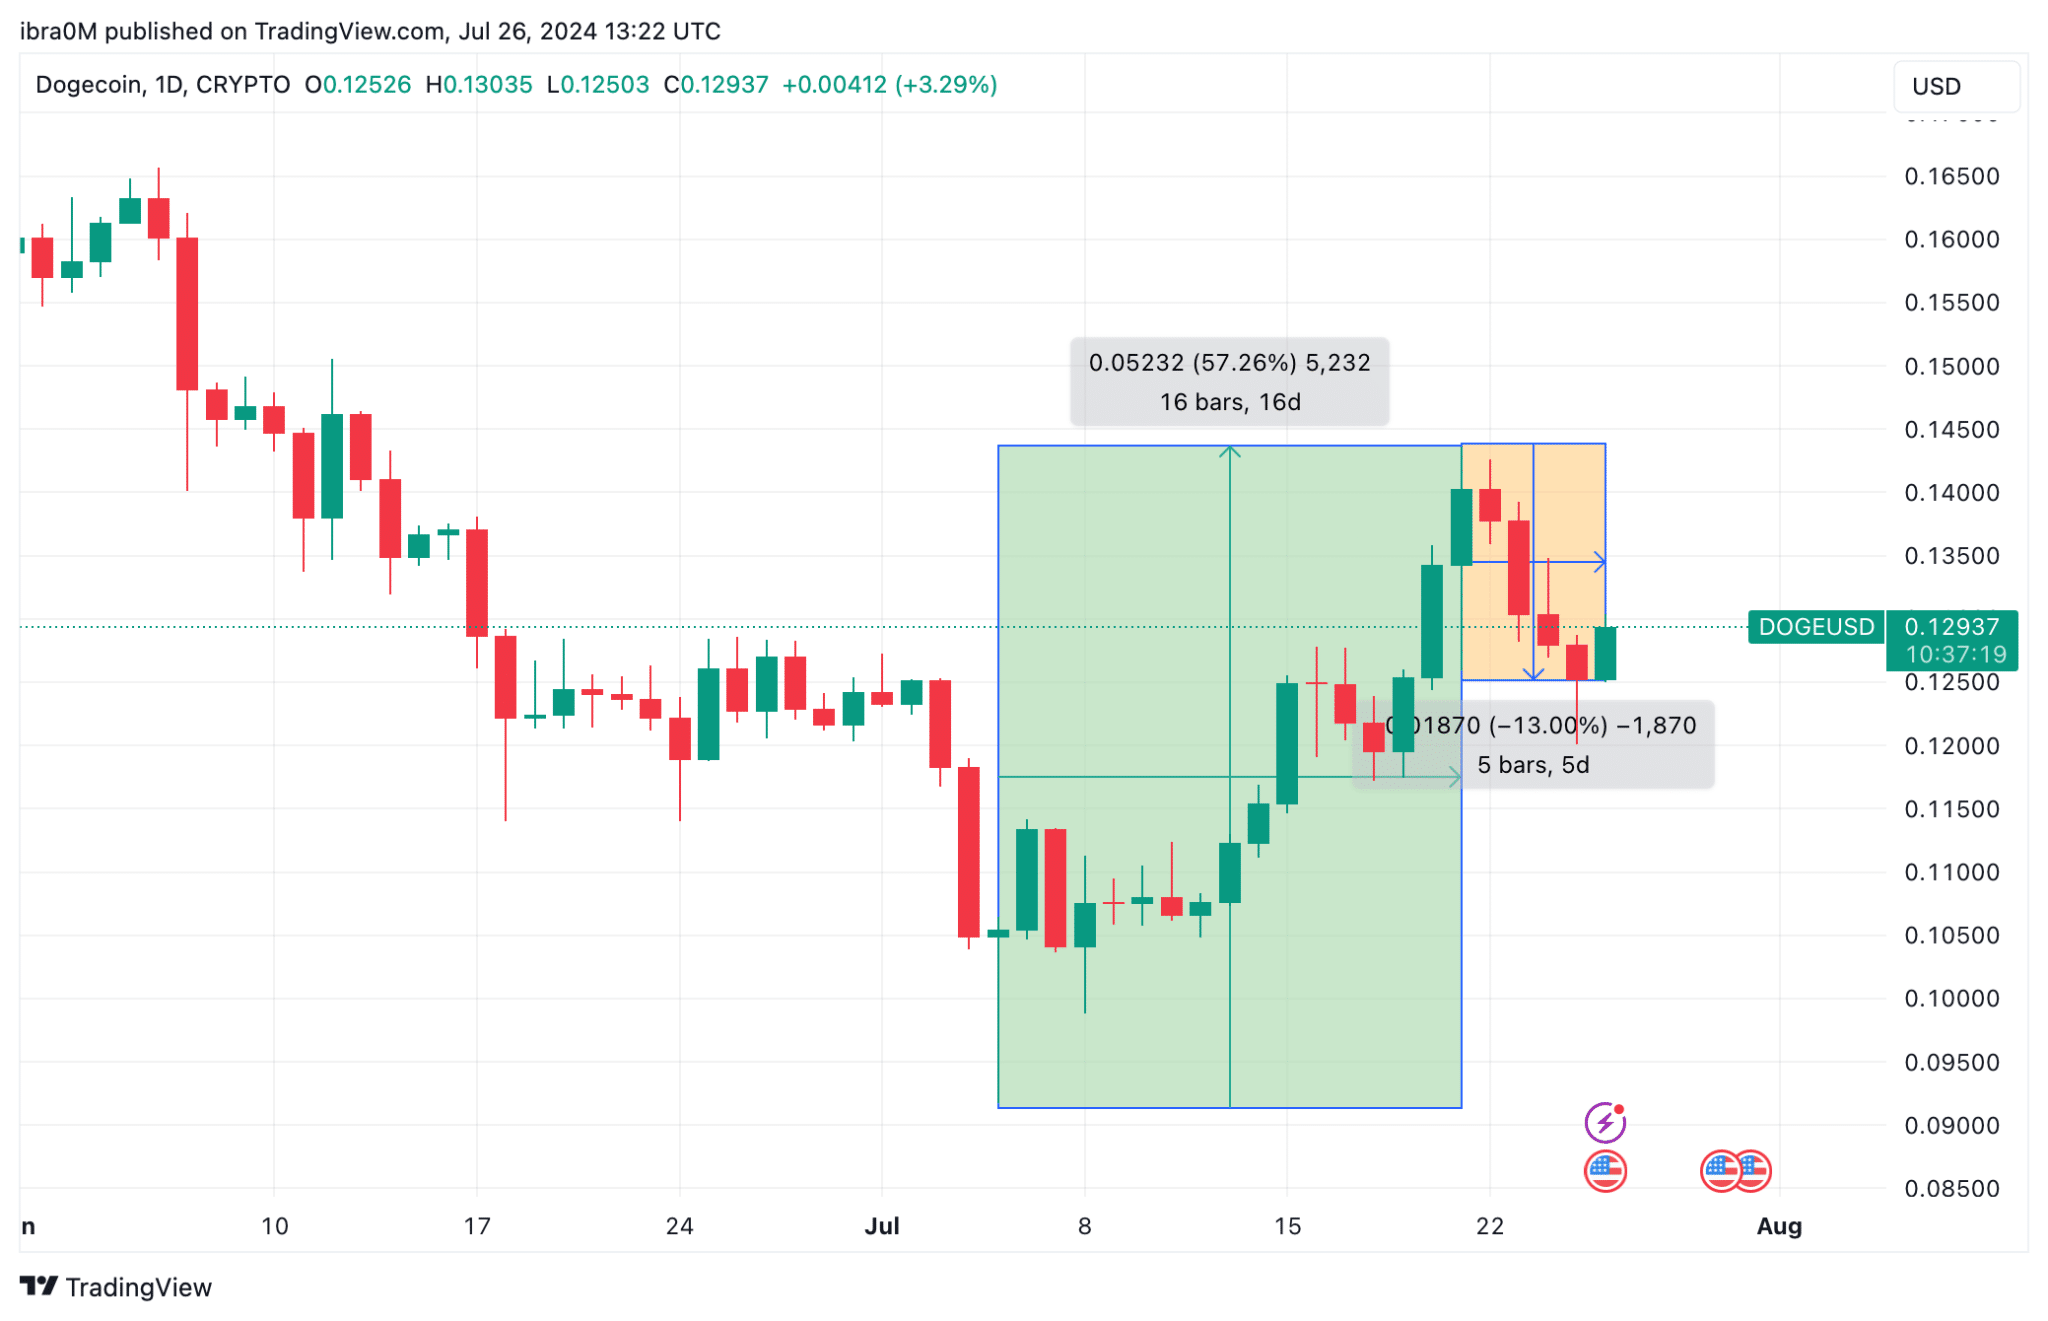
Between July 5 and July 18, the global cryptocurrency market was invigorated by dovish NFP and CPI data, which reignited investor interest. During this period, Dogecoin surged by an impressive 57%.

However, since July 19, Dogecoin has faced significant downward pressure, influenced by new developments in the US political landscape and the launch of Ethereum ETFs.

On July 21, President Joe Biden announced his withdrawal from the 2024 Presidential race, shifting the electoral momentum towards Donald Trump. Given Trump’s favorable stance on Bitcoin, this development has drawn investor attention more towards BTC.

In addition, the Ethereum ETFs, which launched on July 23, spurred a surge in institutional demand for ETH, achieving nearly $2 billion in trading volumes within the first two days.

These events have led to a notable shift in investor focus towards Bitcoin and Ethereum, leaving other cryptocurrency sectors, including meme coins like Dogecoin (DOGE), struggling for traction.

Dogecoin Price Forecast (DOGE/USD) | TradingView

During the period from July 5 to July 18, Dogecoin’s price experienced a robust rally of 57.26%. However, as traders shifted short-term focus towards BTC and ETH, DOGE price trend took a downward swing. 

As shown in the chart, Dogecoin is now trading at $0.13 as of July 26, marking a 13% decline from the monthly peak of $0.143 posted on July 18.

This situation suggests that investors are increasingly reallocating capital towards Bitcoin and Ethereum, which has led to a dearth in demand across other cryptocurrency sectors.

Additionally, last week’s 57.26% rally indicates that Dogecoin traders are currently holding high unrealized profits, which heightens the risk of rapid corrections. Also, if Donald Trump’s speech at the Bitcoin Conference in Nashville triggers more bullish catalysts for BTC, it could drive Dogecoin’s price further downward amid the current market dynamics. 

Dogecoin Price Forecast: Trump Heightens Risk $0.10 Reverse

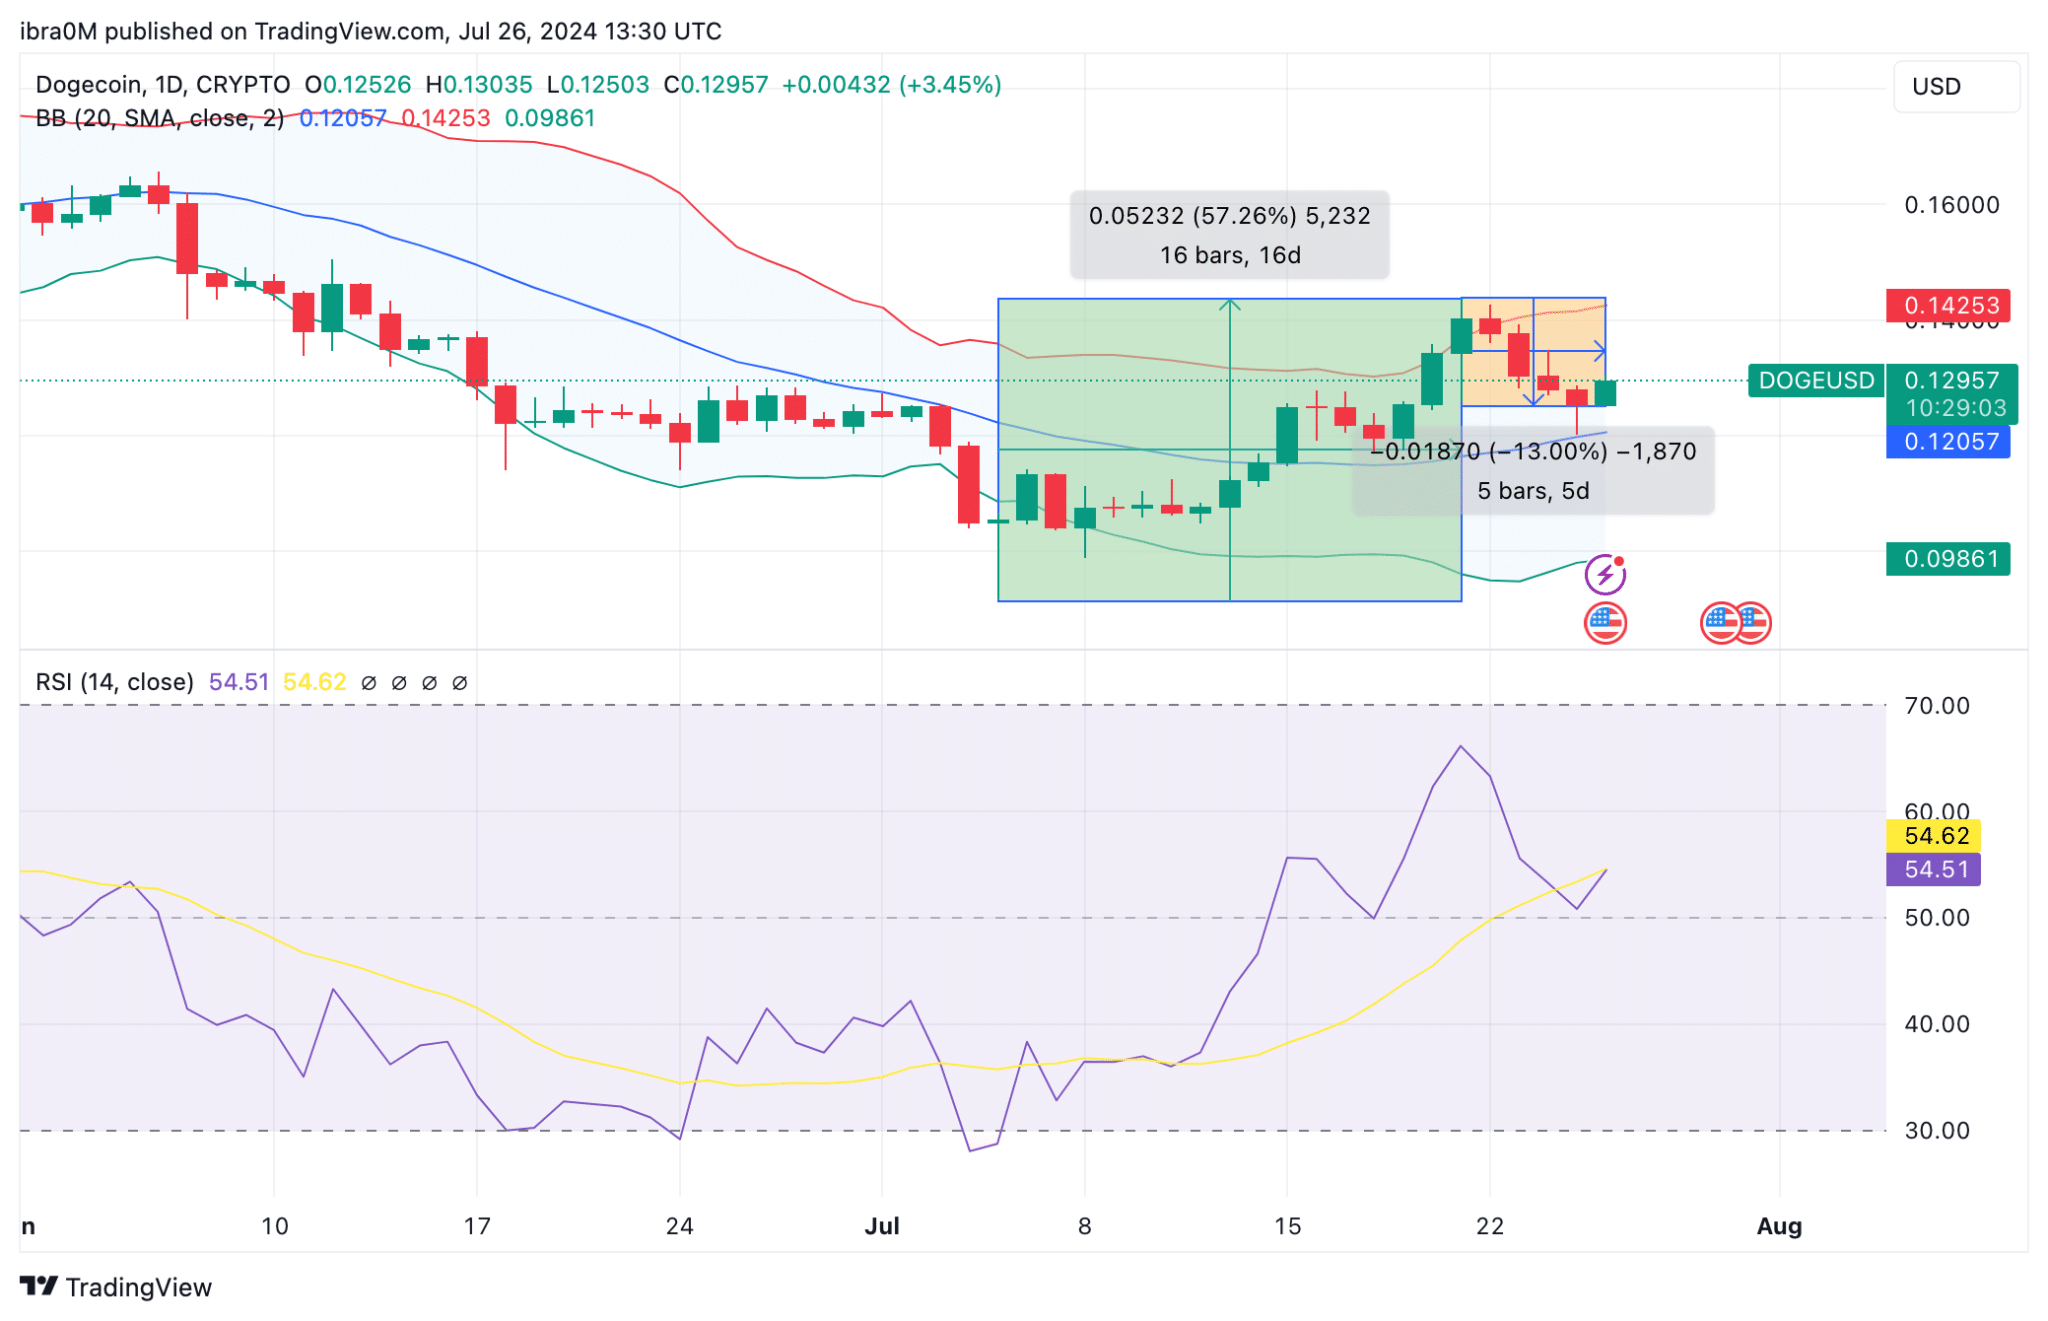
Dogecoin has seen a notable price movement, trading at $0.1295 on July 26, 2024, with recent volatility influenced by broader market conditions and political events. The technical indicators in the provided chart suggest a mixed outlook, with both potential support and resistance levels in play.


The Bollinger Bands indicate that Dogecoin has been experiencing higher volatility recently, as evidenced by the widening bands. The current price of $0.1295 sits near the middle band, which often acts as a pivot point.

Immediate resistance is seen at $0.1425, the upper Bollinger Band, which aligns with recent highs. Should DOGE break above this level, it could signal a continuation of the uptrend, potentially targeting the next psychological resistance at $0.15.

Dogecoin Price Forecast (DOGE/USD) 
Dogecoin Price Forecast (DOGE/USD)

On the downside, the lower Bollinger Band at $0.0986 provides a significant support level. This coincides with the previous consolidation phase and a psychological round number, making it a critical level to watch. A drop below this could see DOGE revisiting the $0.10 mark, which has historically been a strong support area.

The relative Strength Index (RSI) indicator is currently at 54.51, suggesting a neutral stance but slightly leaning towards bullish momentum. The RSI above 50 typically indicates buying interest, but it is not yet in the overbought territory above 70, suggesting there is still room for upward movement.

However, if the RSI begins to trend downward and falls below 50, it could indicate a shift toward bearish momentum.