Home Blog Page 1344

Shiba Inu Game Shiba Eternity to Bring Ranked Tournaments and NFT Minting in Web3 Update

0

The Web3 upgrade of the Shiba Inu ecosystem game Shiba Eternity will feature ranked tournaments, NFT minting, and strategic gameplay enhancements.

Shiba Eternity, the popular digital card game, is set to undergo a transformation with its Web3 integration. According to a recent update from Lucie, the marketing lead at SHIB.io, the game’s upcoming upgrade, Shibatopia arena, will introduce ranked tournaments and blockchain-backed card battles on the Shibarium platform. 


Web3 Integration and Ranked Tournaments

Notably, the integration of Web3 technology into Shiba Eternity is poised to revolutionize the game’s dynamics. The update will enable players to transform their digital cards into unique assets on Shibarium.

Players can participate in ranked tournaments, which will feature 15-day cycles and 14 divisions. They can earn points for victories and lose points for defeats, climbing the ranks from White Belt to Grandmaster.

In addition, the game will introduce NFT minting, allowing players to mint cards earned in-game as NFTs on Shibarium. These NFTs can be traded, sold, and showcased, adding a new layer of value and collectibility to the game. Over 10,000 unique Shiboshi heroes, each with special abilities, will lead players’ decks in strategic battles, enhancing the game’s competitive nature.

Strategic Gameplay Enhancements

Per the update, players will build 30-card decks and manage their “Bark” (mana) pool to attack, defend, and use special abilities. The game ends when one player’s stamina reaches zero, making strategic combat crucial.

Players must choose a Shiboshi hero, build a deck with fighters, spells, and weapons, and manage their Barks effectively. As the game progresses, players will use these Barks to execute strategic moves, aiming to reduce their opponent’s stamina to zero.

Additionally, ranked mode offers rewards like kibble for card packs, card packs, and card token selectors. Top players from ranked tournaments will qualify for exclusive seasonal tournaments with even bigger prizes.

Angel, the lead for Shiba Inu Games, called attention to the competitive nature and rewards of the new ranked mode, encouraging players to prepare for epic battles in the Dogjo.

Testing and Future Developments

It is important to recall that the Shiba Inu Games team had detailed the schedule for the closed beta phase of Shiba Eternity, which would operate within Shibarium’s layer-2 scaling solution.

The team disclosed in an interview with The Shib Daily that this beta testing will begin in the third quarter of 2024, focusing on assessing the game’s performance on the Shibarium network before extending beta access to the public.

Additionally, in May, Shiba Eternity received a major update named “Balancing Act,” which released version 1.2.8. This update made essential changes to balance the powers of Shiboshi characters, promoting fair gameplay.

It also introduced new gameplay features like the ability to stun enemy cards and recover from attacks using BARK tokens, as well as a fee structure for trading in-game tokens, adding depth to the game’s strategic elements. 
Solana Eyes 868% Spike to $1,630 Upon Breakout of Bull Pennant

0

Market analyst Ali Martinez believes Solana is on the verge of an 868% upsurge to $1,630 after a breakout from its bull pennant.

For the uninitiated, a bull pennant pattern typically forms as a continuation pattern. The formation occurs when there is a pause in the upward movement of an asset. For Solana, the flagpole of this bull pennant was established during its remarkable recovery from a prolonged downtrend in 2023. 

Solana Forms Bull Pennant

Notably, in September 2023, SOL’s price bottomed out at $17.34 following a bearish performance throughout the year. However, from the $17.34 low, Solana embarked on a powerful rally, culminating in a peak of $209 by March 2024. This recovery established the height of the flagpole.

Following the $209 peak, which coincided with Bitcoin’s (BTC) all-time high, the SOL price faced a correction as investors booked profits. This corrective phase, which spilled into this month, occurred as Bitcoin and the rest of the market retraced. The correction formed the pennant itself.

SOL Targets 868% Rally to $1,630

The price consolidation within the pennant’s boundaries was marked by decreasing volatility and narrowing price action. Now, Martinez confirms that Solana has broken out of the pennant following a massive 24.93% rise last week. The rebound came on the back of the latest broader market recovery.

The breakout above the upper trendline of the pennant marks a switch in market sentiment. Ali Martinez expects the upcoming upsurge to push Solana by 868% to a new all-time high at $1,630. 

While the breakout from the pennant is a bullish signal, current market conditions are not equally favorable. As of the latest data, Solana’s price has faced some downward pressure, coinciding with a broader market downturn. Notably, Bitcoin has collapsed by more than 3% today, bringing the rest of the market down.

Solana currently trades around $166.61, representing a significant 9.70% decline this week alone. The Fisher Transform indicator currently shows a negative reading. This indicator, often used to identify turning points in the market, suggests that the recent price movement might not immediately align with the bullish breakout expected from the pennant.

Solana Weekly Price Chart

Interestingly, Martinez warned of this pullback in an analysis three days ago. The market watcher cautioned on July 21 that the TD Sequential flashed a sell signal on three Solana timeframes. He subsequently stressed that the expected 868% rise will not occur in a linear manner. According to him, corrections will continue to emerge.

XRP Price Rally Halts at $0.63 amid Ethereum ETFs’ $133 Million Outflows

XRP price stumbled at the $0.61 resistance on Thursday July 25 amid bearish headwinds from Ethereum ETFs, market data analysis shows how Bull traders are battling to extend the rally toward the $0.65 territory.

XRP’s 17% Rally Halts amid Ethereum ETF’s $133M Outflows

The crypto market has been in a steady uptrend since July 5. Amid several bullish catalysts, the Ethereum ETFs launch and Joe Biden bowing out for the US 2024 Elections race have triggered both highlight potential positive shifts within the crypto regulatory landscape.

Expectedly, as one of the most litigated crypto entities during the Biden administration, Ripple (XRP) has attracted considerable demand. Crypto-native investors anticipate that Biden’s exit increases the likelihood of victory for Donald Trump, a candidate perceived to have a more friendly stance on crypto.

In effect, XRP price has raced into a 17% rally since Biden’s announcement, outperforming the BTC, ETH and every other crypto assets in the top 10 valuation rankings.

Ripple Price Action (XRP/USD) | TradingView

The chart above shows how XRP price rose 17.69%, from $0.54 on July 19, to reach a weekly time frame peak of $0.63 on July 23. This remarkable price performance spark speculations that XRP price could reclaim the $0.65 resistance territory within the weekly timeframe.

However, recent bearish events surrounding Ethereum ETFs, threatens to spill over towards the rest of the altcoin market, putting XRP’s price rally at risk.

Firstly, Ethereum ETFs officially launched on Tuesday, July 23, after nearly 2 months of regulatory delays.

Many crypto traders opted to sell-into the market euphoria, to locking some of the unrealized profits they had racked up since the bull run began three weeks ago, after the dovish NFP and CPI data released on July 5.

On the first day of trading, Ethereum ETFs attracted a healthy $1 billion trading volume and $107 million in inflows. This helped to nullify the bearish headwinds from the sell-the-news frenzy on July 23. But things took a negative turn on July 24.

However, the market sentiment flipped on July 24 amid major outflows from Ethereum ETFs. On Wednesday, Ethereum ETFs experienced over $130 million net outflows.

The highest outflows on the day came from Grayscale Ethereum Trust, which rose to the tune of $32 million, making it the only Ethereum ETF to record a net-negative on both trading days so far. On the other hand, Fidelity’s FETH led the inflows, accumulating just over $74.46 million.

The bearish afterschocks spread across to the altcoin markets. XRP price has now dipped 6% from its weekly peak, as it fell below $0.60 at the time of writing on July 25.

It now remains to be seen if the XRP bulls will hold firm to their unrealized 17% gains, or succumb to the bearish pressure building up.

XRP Price Forecast: Bulls to Defend $0.59 Support Fiercely

XRP is currently trading at $0.6185, experiencing slight upward momentum with a 0.03% increase over the last 24 hours. The price action has shown a significant consolidation around the $0.60 mark, which is a critical support level for the bulls. The Fibonacci retracement levels indicate that $0.59 is a key support level that the bulls will need to defend to prevent further downside.

The chart shows a recent dip of 6.01% over one day, reflecting a brief period of selling pressure. However, the presence of a notable 17.69% gain over a five-day span suggests that there is underlying bullish sentiment in the market.

If the price falls below the $0.59 support, it could potentially test lower support levels around $0.55 and $0.50, as indicated by the Fibonacci retracement zones.

Ripple (XRP) Price Forecast (XRP/USD) | TradingView 
Ripple (XRP) Price Forecast (XRP/USD) | TradingView

On the upside, key resistance levels are located at $0.62 and $0.65. Breaking above these levels could pave the way for further gains, with the next significant resistance zone around $0.70. The Accumulation/Distribution Line (ADL) is currently at 1,517.40, indicating moderate buying pressure, which supports the possibility of maintaining the current price level or pushing higher.

The market shows mixed signals, leaning towards a neutral stance but with a slight bullish bias due to recent price gains and moderate buying pressure.

In summary, XRP’s immediate support at $0.59 is crucial for the bulls to defend. A breach below this level could lead to further downside, while maintaining above it and breaking past $0.62 and $0.65 resistance levels could indicate a continuation of the bullish trend.

Bitcoin Miner MARA Buys $100,000,000 in BTC, Bringing Total Holding Above 20K BTC

0

Leading Bitcoin miner Marathon Digital (now known as MARA) purchases $100 million worth of BTC, bringing its total holdings to over 20,000 BTC. 

The company did not provide specific details about the transaction, including the time of the transaction and the average price of each BTC acquired. 

MARA Total Bitcoin Holdings 

However, it disclosed today that the recently acquired $100 million worth of Bitcoin took its total holdings to more than 20,000 BTC. At the current exchange rate of $64,023, MARA’s total Bitcoin holding is worth over $1.28 billion. 

It bears mentioning that as of June 30, 2024, MARA had a total holding of 18,536 BTC, according to data from Bitcoin Treasuries. With MARA’s total Bitcoin holdings currently above 20,000 BTC, it is evident that the company acquired at least 1,464 BTC via the latest acquisition. The company acquired the over 1,464 BTC within the ranges of $54,000 to $68,000 this month. 

MARA Adopts Full Hold Strategy 

Notably, MARA confirmed that it will adopt a comprehensive hold strategy for its Bitcoin reserve effective immediately. Prior to this time, MARA had sold some of its BTC holdings to cover its operational cost. In particular, it sold 1,000 BTC ($69.4 million) last month, marking the largest miner-related over-the-counter (OTC) sale.  

However, under this new strategy, MARA will retain all BTC generated via its mining operations and also periodically purchase the asset from the open market. 

Amid MARA’s holding strategy, the company disclosed that it will finance its operations using the excess cash reserve in its balance sheet in the future. MARA’s hold strategy reflects the Bitcoin miner’s confidence in Bitcoin’s long-term value. 

Commenting on the development, MARA’s chairman and CEO Fred Thiel characterized Bitcoin as the world’s best treasury reserve asset and endorsed sovereign wealth funds holding the top cryptocurrency. 

Mining Accounts for Majority of MARA Bitcoin Holding 

This is not the first time that MARA has made a hefty purchase of Bitcoin. In January 2021, the Bitcoin miner splashed $150 million to acquire 4,813 BTC. 

Despite occasionally purchasing Bitcoin from the open market, MARA asserted that it generated most of its BTC via its mining operations. 

The development comes amid a massive downturn in the broader crypto market. Bitcoin, which accounts for 54.9% of the global crypto market cap, is down 3.64% over the past 24 hours to $64,023. The top asset has also plunged 2.1% in the weekly charts at press time. 

PEPE Eyes New All-Time High Amid Growing Holder Base

PEPE struggles to continue the bull run despite opposition from a supply zone. Will the uptrend in PEPE continue, with the unique holders count crossing 264,000?

With a combined market cap of $48.024B, the meme coin market has fallen 7.72% in the last 24 hours. Amid the downtrend registered by meme coins, the third-biggest meme-based cryptocurrency, PEPE, registered a 5% drop within 48 hours.

Maintaining a lateral trend in the daily chart while respecting a crucial support level, PEPE teases a potential comeback with the broader market push. Further, in the bigger picture, PEPE eyes a breakout run for a new all-time high.

PEPE Uptrend Halts Midway with Bulls Close to Exhaustion

With a long-coming support trendline in the daily chart, the PEPE token maintains an overall bullish trend in 2024. The meme coin shows a year-to-date growth of 839% while trading at a discount of 30% from the all-time high at $0.00001718. 

However, the recent upcycle from the 200D EMA and the support trendline face opposition from a supply zone at $0.000013 as the underlying demand at the $0.0000113 support level shifts the price trend laterally. 

PEPE Price Chart
PEPE Daily Price Chart

On a side note, PEPE price action teases a potential head and shoulder pattern with the overhead supply zone as the neckline. 

Currently, the PEPE meme coin trades at $0.00001188 with an intraday drop of 2.64%. However, the lower price rejection in the intraday candle teases a bull cycle ahead. 

Pennant In The 4H Chart Teases Bullish Trend 

The lower price rejection in the intraday candle comes out as a morning star pattern in the 4H chart. The sideways shift forms a triangle pattern with a previous uptrend to complete a bullish pennant pattern. 

PEPE Price Chart
PEPE Price Chart

PEPE HODLers Grows with Numbers Surpassing 264,000

Meanwhile, per Etherscan, the number of PEPE HODLers has recently surpassed the 264,000 mark and is currently at 264,032. With the rising number of holders, the demand for the frog-themed meme coin is clearly rising. 

Screenshot 2024 07 25 174100
PEPE Token | Etherscan

However, the number of whales will be the determining factor for any significant price jumps in PEPE.

Will PEPE Leap Forward with a Breakout Run?

With a potential bull cycle in the pennant in the 4H chart, PEPE is likely to surge in the coming hours. Thus, with increased upcycle chances, the breakout run will unleash PEPE to new heights. 

According to the Fibonacci levels, the meme coin could surge to $0.00001846 or the 161.80% Fib level. 

Cardano Wedge Pattern Indicates Big Trade Potential for ADA

0

Cardano (ADA) shows a bullish falling wedge pattern, signaling a potential breakout and a lucrative trading opportunity.

The cryptocurrency market is experiencing a revival, with renewed investor interest driving altcoins like Cardano (ADA) to recover from recent losses.

A detailed analysis by “S_CAPITAL” on TradingView reveals a potentially lucrative opportunity for traders. His daily chart for ADA highlights key technical patterns and metrics that suggest a bullish outlook.

Screenshot 2024 07 25 at 150137
Source: TradingView

Cardano Falling Wedge Pattern Signals Reversal

The ADA chart, which was based on the 24-hour time frame by the analyst, highlights a bullish pattern. This pattern is characterized by two converging trendlines that slope downwards, typically signaling a potential bullish reversal.

According to the analyst, as ADA’s price pattern narrows, a breakout to the upside is imminent. He stressed that such patterns have a high success rate historically, making this setup particularly attractive for traders.

Strong support levels bolster this bullish outlook. The analyst noted that ADA has consistently found support in the $0.35 range, bouncing off these levels multiple times.

Notably, the analyst identified favorable entry points for Cardano at $0.4063, with a stop loss below $0.3096 to limit downside risk. The chart also displays a risk/reward ratio of 3.11, indicating that the potential reward is more than three times the risk involved.

Accordingly, the trader targets the $0.72 price point following a successful breakout rally. This represents a potential upside of approximately 76.10% from the current levels.

Further confirming an incoming rally for Cardano is the relative strength index (RSI) at the bottom of the chart, which shows a bullish divergence. The RSI has been trending upwards despite the price moving downwards, suggesting that the selling pressure is weakening. This divergence is often a precursor to a price reversal, adding further weight to the bullish outlook.

Whale Activity Bolsters Bullish Sentiment

Cardano has recently experienced a remarkable surge in inflows, showing that large holders are accumulating. According to data from IntoTheBlock, whale addresses saw an inflow of 5.14 billion ADA, valued at $2.1 billion, on July 22. This influx represents a 10,878% increase from the day before.

ADAAAA

Over the past week, inflows to large holders’ wallets have surged by 22,768%, and the past month has seen a 172,952% rise. This dramatic rise in large holder inflows is largely attributed to a concentrated accumulation effort by whale investors.

During this press, Cardano sells for $0.3902, experiencing a 6.82% decline in the last 24 hours and an 11.54% decline over the past seven days.

Bitcoin Analyst Says XRP Time Has Come, Targets $587

Bitcoin analyst “Flash” declared that XRP time has come, disclosing an audacious target of $587 requiring a nearly 100X surge. 

Flash voiced this sentiment in a recent post on X. The commentary was accompanied by an XRP chart on the weekly timeframe, spanning its candlestick pattern since its 2021 bull rally.

Considering that XRP traded at the peak of $1.96 in 2021, its current low prices below a dollar have formed a symmetrical triangle configuration with the peak value.

Flash’s chart depicted that XRP is now breaking out of the downtrend, closing with bigger green weekly candles. XRP has closed two big green weekly candles and is currently forming the third one. 

For context, in the first week of this month, XRP tanked below $0.4, reaching one of its lowest levels in nearly two years. By the end of the second week, XRP has recaptured the $0.5 threshold after a 20% rally, closing July 13 at $0.5263.

XRP sustained the momentum, reaching a three-month high above $0.63 before July 20. Notably, XRP ended the week at approximately $0.6. Presently, XRP continues to defend the $0.6 threshold, trading above $0.61.

XRP’s bullish performance for these two consecutive weeks has been a notable highlight among market watchers. As The Crypto Basic reported yesterday, a technical analyst stressed the significance of the two weekly green candles, citing historical data suggesting a likely further upward movement of 800%.

XRP Time Has Come: $587 Target?

Now, Bitcoin analyst Flash exclaimed, “XRP time has come,” based on the chart observation. This suggests that XRP may begin to drive the wave of sensation in the crypto market.

Flash’s bullish sentiment has attracted significant attention among crypto market participants, with many asking him for his target for the asset upon a full breakout. To one of the repeated inquiries, he disclosed $587.

This bold outlook has surprised many, especially considering that a $587 value demands nearly 100,000% price growth, which many consider far-fetched.

“Scared” XRP Might Actually Run This Time

Meanwhile, in a related discussion, analyst Alex Cobb shared that he is experiencing genuine anxiety that this cycle could finally be when XRP breaks its jinx. Cobb’s sentiment follows a similar bullish observation from another analyst, who believes that XRP is poised to reach a new all-time high, surpassing its 2018 peak.

While long-term XRP holders missed the 2021 bull run, proponents remain hopeful for a turnaround this cycle, as favorable developments are aligning simultaneously.

Bitcoin Miners’ $1.2B Sell-Off Driving BTC Price to $60k as Ethereum ETF Hype Wanes

Bitcoin price tumbled below the $64,000 mark on July 25, down 7% from the weekly timeframe peak of $68,477, on-chain analysis explores how Bitcoin miners selling into the market euphoria may have triggered the on-going price pull-back.

Bitcoin Price Decline Amid Cooling Ethereum ETF Hype

The cryptocurrency market, including Bitcoin, had been experiencing a robust uptrend since July 5, driven by favorable macroeconomic factors in the U.S. Initially, dovish NFP and CPI reports for June 2023 boosted demand for risk assets, including cryptocurrencies.

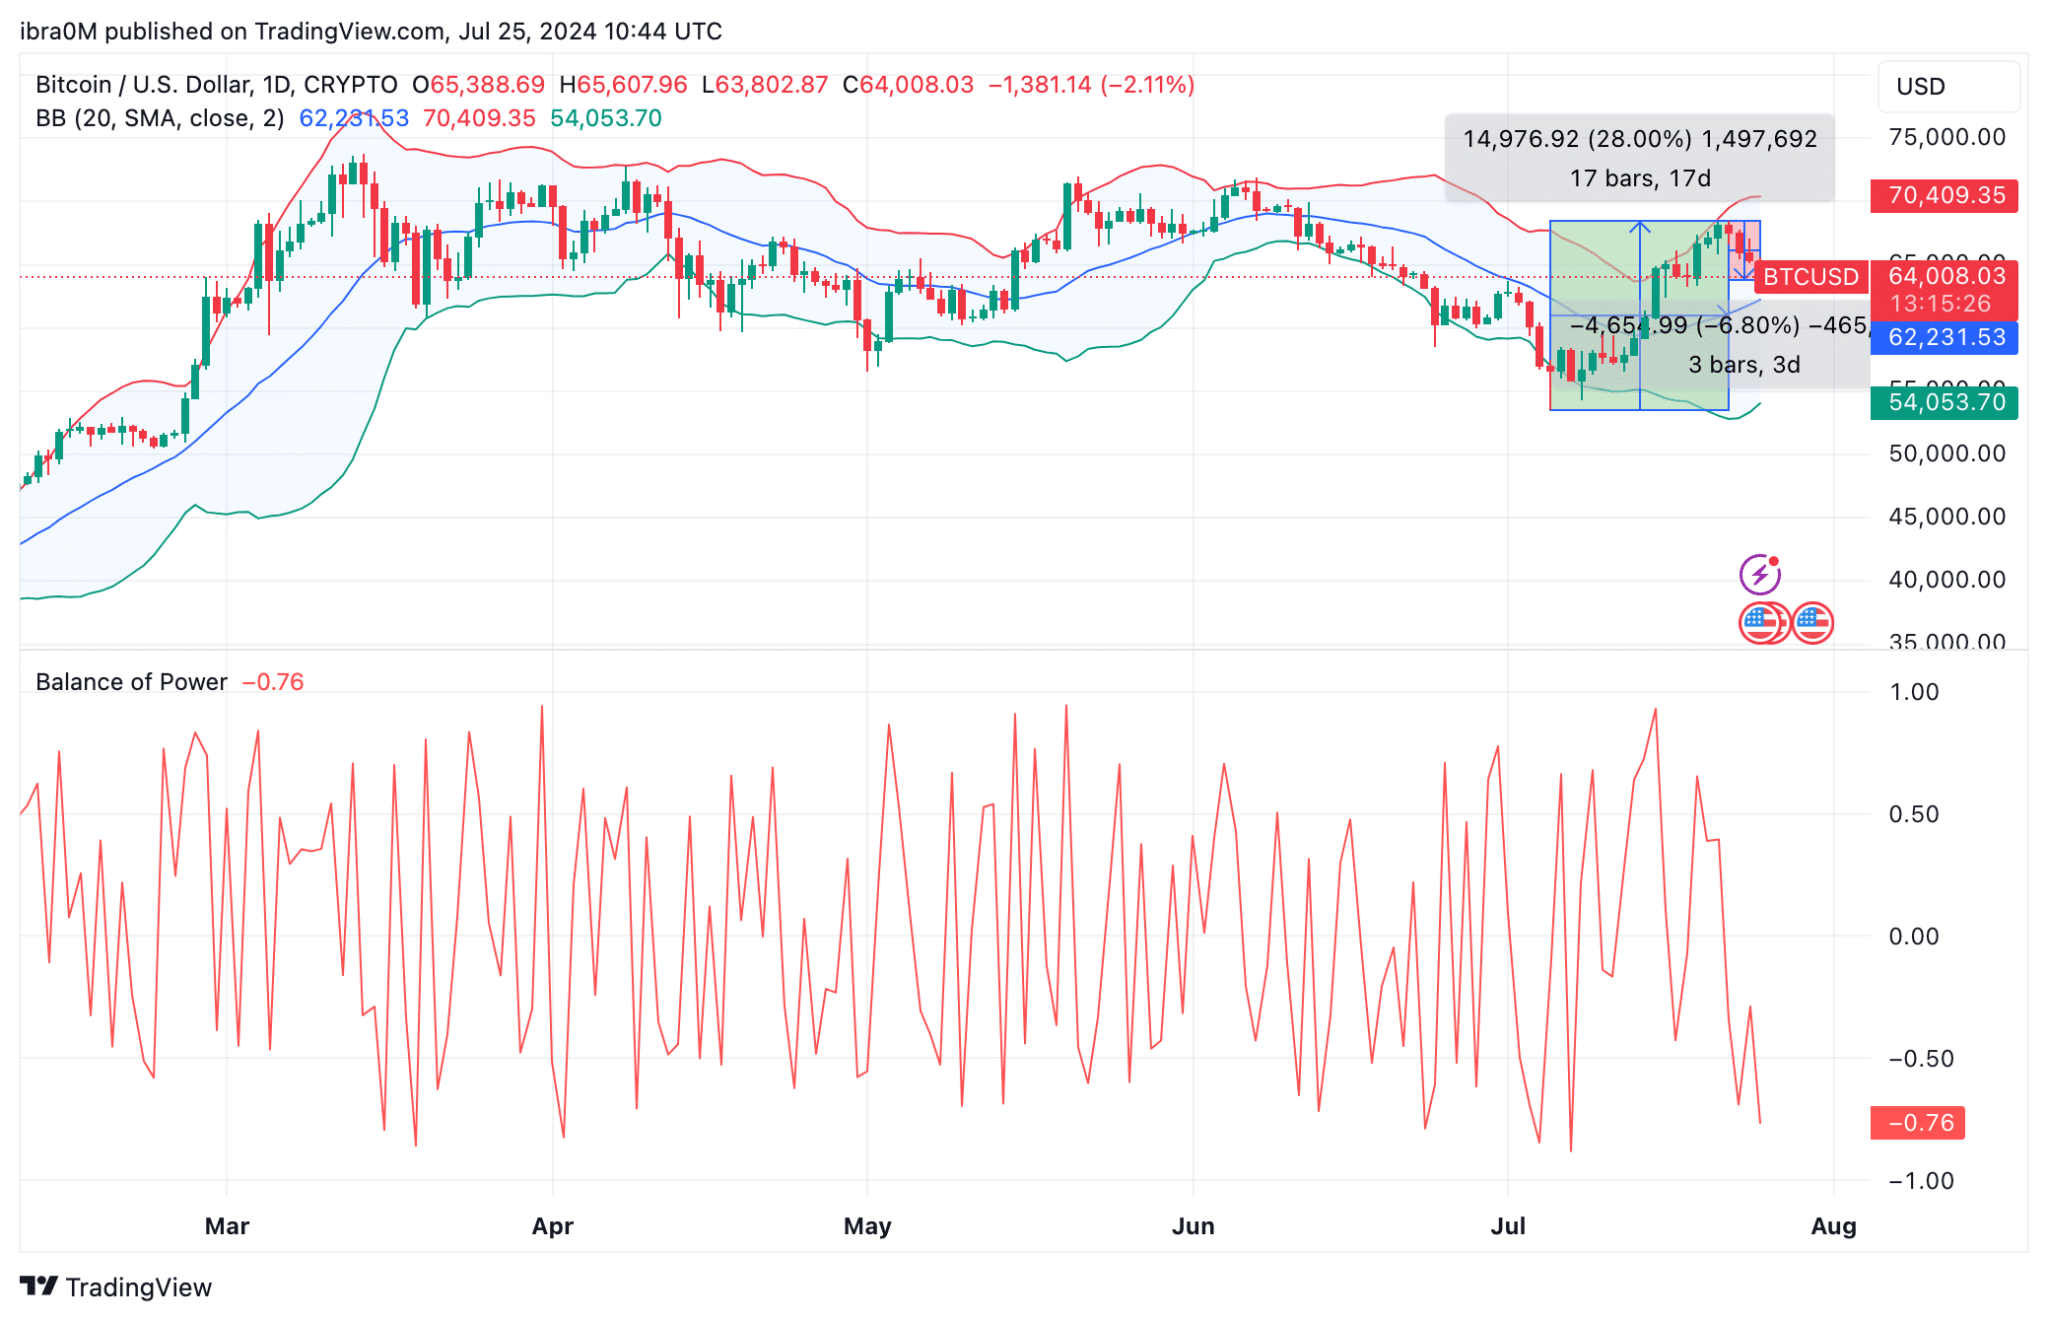
The rally intensified on July 22, propelled by the launch of Ethereum ETFs and President Biden’s withdrawal from the 2024 presidential race, positioning crypto-friendly Donald Trump as a strong contender. This glut of bullish catalysts drove Bitcoin price into a remarkable 28% in 17 days, moving from $53,540 on July 5 to $68,477 on July 22.

Bitcoin Price Action| TradingView
Bitcoin Price Action (BTC/USD)| TradingView

Notably, the $68,477 price level is Bitcoin’s highest in over 30-days, dating back to June 10, 2024. Unsurprisingly, bull traders in the derivatives mounted LONG positions worth over $1 billion in anticipation of a $70,000 breakout.

However, market events unfolding in the last 48 hours suggests the $70,000 target is now unlikely within the monthly timeframe. Look at the chart above we see that BTC price has now retraced 7% from the $68,477 peak recorded on July 22, as it tumbled as low as $63,802 on Thursday July 25.

Bitcoin Miners Have Sold 20,000 BTC in 10 Days

Firstly, there is an indication that a lot of strategic crypto traders that bought BTC in the build up to the Ethereum ETF launch are now promptly “selling-the-news” to locking some of the unrealized profits they have racked up during last few weeks.

But looking closer at recent on-chain data trends, Bitcoin miners have also been trading bearish since the market rally began, a move which is evidently pivotal to the on-going Bitcoin price correction.

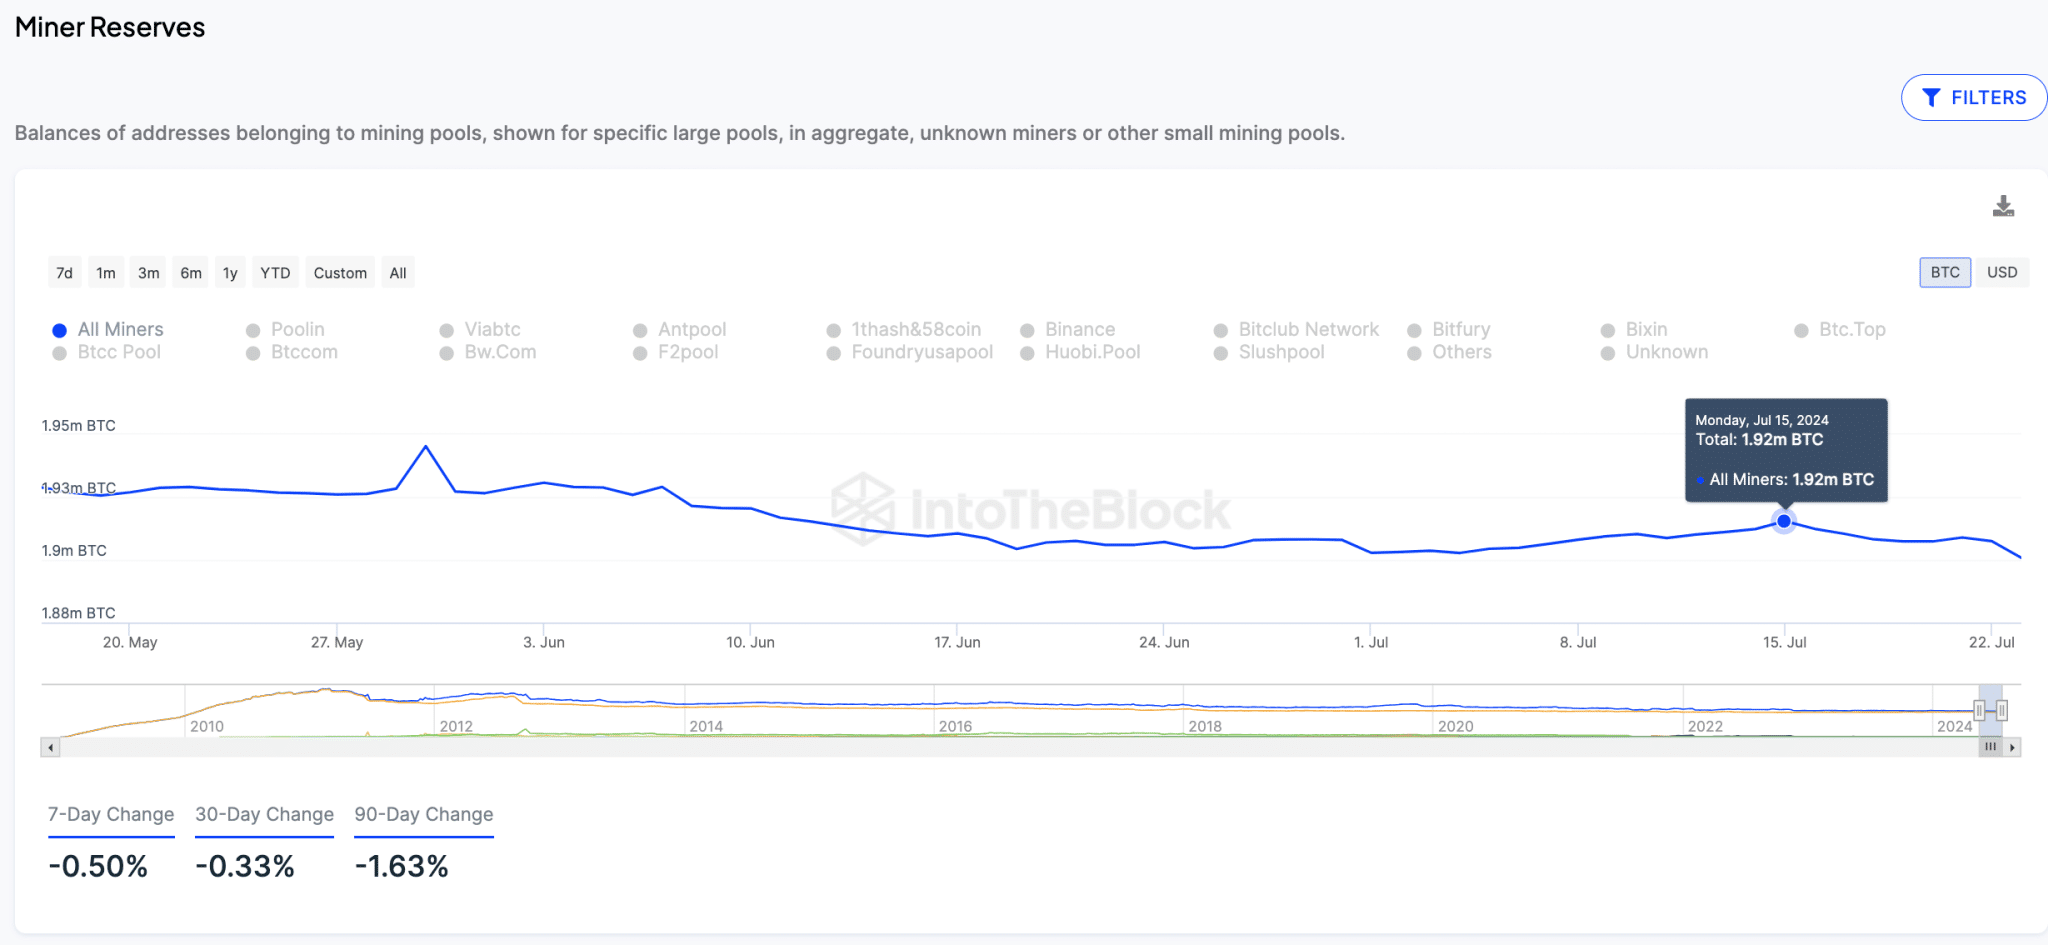
IntoTheBlock’s Miner Reserves chart below tracks the BTC holdings in control of recognized miners and mining pools. The decline in miner reserves indicates ongoing sell-off, which often impacts price negatively, and vice versa.

Bitcoin Price vs. BTC Miners Reserves | TradingView

Bitcoin miners held a total of 1.92 million BTC at as of July 15. But as the Ethereum ETF hyped kicked in after the announcement of the July 23 launch date Bitcoin miners capitalized on the renewed investor interest to stage a large sell-off.

At the time of writing on July 25, Bitcoin miners now hold only 1.90 million BTC in their reserves, reflecting a 20,000 BTC sell-off within the last 10 days. When miners on blockchain network begin selling-off their holdings, it often triggers bearish price reaction for a number of reasons.

Firstly, the miners’ 20,000 BTC sell-off has effectively diluted the Bitcoin market supply by $1.28 billion. More so, it discourages prospective new entrants from entering the markets, wary that the miners’ ongoing billion-dollar selling trend could hurt their short-term profits. 

In summary, the combination of traders locking in profits and miners selling off their holdings has contributed to Bitcoin’s recent price drop. Without a considerable shift in these bearish trends, Bitcoin may face further downward movement in the near term.

Bitcoin Price Forecast: $60k Reverse Looming

A 10-day long sell-off by miners, has seen Bitcoin’s market supply increase by $1.28 billion, deterring new investors concerned about short-term losses. In effect, BTC has recently pulled back by 7% following the Ethereum ETFs launch on July 23.

Technical indicators on the BTC/USD daily price chart also affirm this negative Bitcoin price outlook.

Bitcoin Price Forecast (BTC/USD) | TradingView

Currently, BTC is trading near $64,008, with the Bollinger Bands showing resistance at $70,409 and support at $54,053. The Parabolic SAR indicates a potential downward trend, while the Balance of Power is at -0.76, reinforcing the bearish sentiment.

To avoid further decline, Bitcoin needs to reclaim the $66,000 resistance level. If the bearish pressure persists, BTC may test the next key support level at $62,231. Traders should closely monitor these levels, as a breach below $60,000 could trigger additional selling pressure and further downside risks.

Dogecoin Eyes Massive 1,503% Rally Above $2 Amid Breakout from Descending Wedge Pattern

0

Dogecoin targets a potential 1,503% rally amid recent observation of a breakout from a descending wedge pattern with targets above $2

While Dogecoin has notably fallen by over 6% today, hovering around $0.1248, market data now suggest a bullish reversal could be on the horizon.

In a recent post on X, analyst Ali Martinez highlighted that Dogecoin is breaking out from a descending wedge pattern, suggesting an imminent upside potential for the meme coin. Martinez’s analysis included 12-hour chart patterns for Dogecoin, which now depicts that DOGE has broken a downtrend that commenced since its Q1 bull rally.

Dogecoin Short-term 44% Price Surge

The pattern features two converging trend lines, with the price trending downward, ultimately forming a symmetrical triangle.

According to Martinez’s observation, the breakout from this wedge indicates a potential short-term upward price movement that could add $0.05590 to the current price. Specifically, he expects Dogecoin to rally by 44% soon to reach $0.1844.

Dogecoin Could Rally to Above $2

In a subsequent update, Martinez shared a Dogecoin chart with a caption expressing his confidence in the meme coin’s prospect. Martinez disclosed that he has continued to amass DOGE without selling for a while now. His observation of historically bullish patterns on Dogecoin fuels his confidence in the meme coin.

The weekly chart accompanying the update illustrates three distinct descending triangle patterns in DOGE’s price history. Each pattern has led to significant rallies and subsequent retracements. 

For instance, after the first formation of the triangle pattern in the 2015-2016 cycle, Dogecoin saw a 229.58% rally, followed by a 60% retracement.

In the second emergence (2018-2021), Dogecoin experienced a 138.04% rally before a 56.20% retracement. Meanwhile, in the current triangle formation, which spans 2022 to the present, Dogecoin saw a 207% surge in Q1 2024 but has crashed by 60%.

Now, Martinez envisions Dogecoin rallying toward $2 in the next resurgence. With a current value of $0.1247, Dogecoin would need to surge approximately 1,503% to reach $2. 

DOGE Retests a Macro Downtrend

Martinez’s observation of a potential pattern reversal in Dogecoin’s movement is echoed by other market analysts. An analysis by Rekt Capital also confirmed that Dogecoin is resisting its major downtrend line, establishing support for a potential uptrend.

A few months ago, DOGE broke out from its long-term downtrend originating from its 2021 peak, reaching a multi-year high of $0.2054 on March 5. While Dogecoin has lost most of these gains, these analysts expect a significant rebound soon.

XRP ETF Expected as Ripple Partner SBI Enters US ETF Market

0

SBI Holdings plans to enter the US ETF market, sparking speculation of an XRP ETF due to its strong partnership with Ripple and digital asset focus.

Ripple partner SBI Holdings is making headlines as it prepares to enter the ETF market. This move has led to speculation about a potential XRP ETF, given SBI’s strong partnership and association with Ripple, a company that holds the largest share of XRP.

For instance, on July 1, SBI Holdings began minting non-fungible tokens (NFTs) for the upcoming 2025 World Expo in Osaka, Japan. SBI leaders have also consistently endorsed XRP.

Now, a local report reveals that SBI Holdings plans to establish an investment management company with Franklin Templeton, a major US investment firm. This new venture will focus on digital assets, with SBI holding a 51% stake and Franklin Templeton 49%. 


The new company from SBI Holdings and Franklin Templeton, expected to form by the end of the year, will focus on crypto assets, reports suggest. Notably, SBI will hold 51% of the company, while Franklin Templeton will hold 49%.

Launching XRP ETF Makes Sense

In June, Ripple President Monica Long had argued that launching an XRP spot ETF in the US market makes sense. 

She highlighted that XRP, consistently among the top 10 cryptocurrencies, meets key criteria for such an investment product. However, Nate Geraci, President of The ETF Store, suggested that the market is not ready for an XRP spot ETF. He noted that an XRP futures ETF must precede a spot ETF, emphasizing the need for a regulated trading history.

Industry Opinions on XRP

Recall Yoshitaka Kitao, Chairman and CEO of SBI Holdings, had shared his optimistic views on XRP’s future, expressing confidence that XRP would benefit significantly if Ripple ultimately wins its ongoing legal battle with the US Securities and Exchange Commission (SEC).

On his hand, Crypto expert The Bearable Bull predicts that XRP will hit new all-time highs this cycle. He asserts there’s “0% chance XRP won’t go to new all-time highs.” According to him, XRP’s price has often depended on Bitcoin’s rise. With the approval of a BTC ETF and new record values, he expects XRP ETFs in 2025.

The Bearable Bull identifies several bullish catalysts for XRP. These include its relisting on all exchanges, the launch of AMMs, the Xahau sidechain, Ripple’s stablecoin, and the Metaco custody solution. He also mentions a potential Ripple IPO, increased political focus on crypto, and expected regulatory clarity. Additionally, Ripple’s legal case is likely to conclude this summer.