Home Blog Page 1349

Toncoin (TON) Price Dips 10% as Ethereum ETFs Take Center Stage

Toncoin price has decoupled from the broader crypto market trends in the past week, dropping 11% as it fell below $7 on July 23. On-chain analysis explores the key bearish catalysts and how TON could move as the month draws to a close. 

Toncoin Crashes 11% Amid Market Rally 

Toncoin (TON) is a layer-1 blockchain protocol, with its tech stack heavily linked to the social media giant Telegram. The TON ecosystem has emerged as one of the breakout crypto sectors this year, thanks to dominant market themes like Bot trading, CryptoAI and Gaming. 

In 2024 so far, Toncoin has recorded remarkable gains in excess of 264% as it recorded a new all-time highs of $8.28 on June 15, before breaking the $8 barrier again on July 3.  This has seen Toncoin rise rapidly to become one of the top 10 ranked cryptocurrencies by market capitalization, as per CoinMarketCap data. 

However, as the Ethereum ETFs launch drew closer, Toncoin has struggled to gain traction in the past week. 

Toncoin Price Action (TON/USD) | TradingView

On July 16, Toncoin price rose to $7.35. But at the time of writing on July 23, TON price has slid below the $7 mark, reflecting a 11% decline over the last 7 days of trading. In comparison, Ethereum and Bitcoin have recorded gains in excess of 5% during that period, while the broad altcoin market cap also grew by a similar margin. 

Toncoin price declined 11% during a market rally, raising alarms among short-term bull traders. Currently the dominant speculative narrative is that crypto investors have shifted focus away from the Toncoin ecosystem, following the announcement of the Ethereum ETFs impending launch. 

The demand for TON could decline further in the days ahead, raising the risk of further downside, with investors channeling capital towards  Ethereum-hosted projects to benefit from the expected ETF inflows.

TON Price Forecast: $6 Support at Risk? 

Toncoin price has experienced significant volatility over the past few months, with notable price movements reflecting changing market sentiments. As of the latest data, TON is trading at $6.92, slightly down by 0.86% for the day. The key question for traders and investors is whether the $6 support level can hold.

From a technical perspective, the chart highlights a substantial rise in TON’s price, with a 264.52% increase over 198 days, demonstrating strong bullish momentum in the earlier part of the year.

However, recent price action suggests a period of consolidation and potential downside risk. The immediate support level is at $6.81, which is crucial for maintaining the current bullish structure.

Ton Price For caste 23 7 24
Ton Price

Key resistance levels are observed at $7.02 and $8.50, marking the upper boundaries of recent price ranges. A break above these levels could signal renewed bullish momentum, potentially targeting higher levels. 

Conversely, if the price falls below the immediate support at $6.81, the next critical support level is at $6.00, which would be a significant psychological and technical level for traders to watch.

In summary, while Toncoin has shown remarkable growth, the $6 support level is indeed at risk if bearish pressure continues.
Cardano Records 10,878% Spike in This Bullish Metric Within a Single Day

0

Cardano (ADA) sees a whopping 10,878% surge in large holders’ inflow within a single day, spiking above the 5 billion ADA mark.

The cryptocurrency market has witnessed a revival in investor interest amid the sustained recovery efforts. Altcoins like Cardano are leveraging the ongoing push to recoup the losses suffered earlier this month. For instance, despite facing a roadblock, ADA is currently up 31% from its July 5 low of $0.317.

ADA Daily Chart
ADA Daily Chart

Amid this bullish move, Cardano appears to be commanding more investor interest in recent times. Interestingly, data from IntoTheBlock (ITB) shows that large holders have taken to accumulating more ADA tokens in anticipation of a full-blown recovery.

Cardano Sees 10,878% Spike in Large Holders Inflow

Notably, the ITB Large Holders Inflow assesses how much funds are flowing into addresses holding at least 35.89 million ADA worth $15 million. This figure represents 0.1% of Cardano’s circulating supply. This tier of addresses is worth watching, as their activity can bolster chances of a rebound or trigger a drop.

Per IntoTheBlock data, these addresses saw an inflow of 5.14 billion ADA worth $2.1 billion on July 22. This large figure represents a massive 10,878% increase from the 46.82 million ADA inflow recorded on July 21. 

Cardano Large Holders Inflow ITB
Cardano Large Holders Inflow | ITB

Data further confirms that these large holder inflows have spiked by an incredible 22,768% over the past week. In addition, the metric has recorded a 172,952% increase in the last month. This rapid increase in large holder inflows is primarily attributable to an accumulation campaign from whale investors.

Moreover, Cardano has equally witnessed a recent recovery in large transactions worth at least $100,000. These transactions have continued to see notable spikes throughout July due to increased whale activity. The last time these spikes came up was in January, leading to ADA’s surge to the $0.81 yearly peak.

Cardano Large Transactions ITB
Cardano Large Transactions | ITB

ADA Shakeout Triggers Accumulation from Resolute Investors 

Interestingly, amid these large transactions and whale accumulation, newer investors are distributing. Long-term Hodlers, holding for at least a year, have increased their balances over the last three months. However, Cruisers, holding between 1 and 12 months, and Traders, holding for less than a month, have decreased their balances.

Currently, Cruisers hold 16.1 billion ADA, down from the 17.17 billion ADA balance on April 22. Also, Traders now hold a collective balance of 5.47 billion ADA, down from the 6.02 billion ADA on April 22. Meanwhile, Hodlers currently hold 13.89 billion ADA, up from the 11.9 billion figure on April 22. Essentially, Hodlers have procured nearly 2 billion ADA in the last three months.

Cardano Balance by Time Held
Cardano Balance by Time Held | ITB

The distribution among Cruisers and Traders is likely due to ADA’s correction from the $0.81 peak in March. This shift in wealth from less to more resolute investors is especially bullish for the Cardano market. 

Notably, the pattern ensures that the market is dominated by diamond hands, bolstering the chances of an upsurge during a recovery. Cardano currently trades for $0.417, down 1.64% today. The crypto asset is looking to find support at the $0.41 level in an effort to leverage it for a retest of $0.46.

Ethereum Price Faces $1B Supply Shock as SEC Greenlights ETH Spot ETFs

Ethereum’s price has consolidated within the $3,400 – $3,550 narrow channel over the last four trading days as bull traders take on a cautious outlook ahead of the spot ETH ETFs launch on July 23.  

Ethereum Price Falls Behind Bitcoin Rally 

On July 22, the Chicago Mercantile Exchange (CME), a trading platform dedicated to institutional traders in the US, announced that it had obtained a green light from regulators to list Spot Ethereum ETFs from Tuesday, July 23, 2024. 

Notably, Bitcoin ETFs have pulled in over $50 billion worth of BTC holdings within 6-months of launch, sparking bullish projections that Ethereum ETFs could also receive a healthy fraction of that in inflows over the coming weeks. 

Ethereum vs. Bitcoin Price Action Ahead of ETH ETF Launch | July 23 | CryptoQuant

Oddly, while ahead of the positive landmark event, the Ethereum price is showing early bearish signals. The chart above shows how Ethereum price has stagnated below the $3,550 resistance over the last 48-hours, meanwhile Bitcoin price has risen by another 4%, hitting a new 30-day peak of $68,747 in the process. 

This suggests that while the rest of the crypto market is rallying, ETH traders are taking on a more cautious outlook in a bid to avoid a bull trap from the potential sell-the-news cycle. 

This is a short-term trading strategy where investors rapidly sell an asset shortly after a positive event, to cash-in on the market euphoria. It appears the Ethereum traders are bracing up for this event ahead of the July 23, ETF launch. 

ETH Market Supply Increased by $1B in July 2024

The media buzz surrounding this news has impacted the global crypto market movements considerably in the last few days. But curiously, on-chain data has showed signals that Ethereum could be witnessing some sell-pressure in the aftermath of the event. 

The CryptoQuant chart below tracks the number of coins investors are currently holding in crypto exchange-hosted wallets and trading platforms. This gives insight into Ethereum’s short-term market supply trends. 

Ethereum Price vs. ETH Exchange Reserves | CryptoQuant

Looking at the chart above we see that Ethereum investors held a total of 16.6 million ETH in exchange wallets at the close of June 30. But as the Ethereum ETF launch date drew closer, investors began to move more coins into exchanges, a move that typically occurs ahead of a major profit-taking frenzy. 

Over 16,9 million ETH coins are now sitting on exchanges at the time of writing on July 23. This reflects that investors have deposited over 330,000 ETH worth since the start of July. 

When valued at the current prices, this means that Ethereum market supply has increased by over $1 billion this month. Such a large increase in market supply of an asset could lead to an accelerated price decline if traders enter a sell-the-frenzy in the coming days. 

Ethereum Price Forecast: Bulls Must Defend $3,400 Support

Ethereum price action on July 23 shows a minor pullback after testing resistance around the $3,600 level. This minor retracement is crucial as Ethereum bulls aim to defend the critical support at $3,400.

The Bollinger Bands indicator reveals that Ethereum has been trading within the upper half of the bands, suggesting a continuation of the upward momentum if the support holds. The middle band, currently at $3,252.96, acts as an immediate support level, with the lower band at $2,845.59, providing a more substantial floor if the price declines further.


Ethereum Price Forecast | ETH/USD

The Relative Strength Index (RSI) sits at 55.01, slightly above the neutral 50 level. This position indicates that Ethereum is neither overbought or oversold, providing room for the bulls to push prices higher. However, the slight downward tilt of the RSI suggests caution, as any further decline could signal a shift in momentum towards the bears.

Key resistance levels to watch are $3,600, and the upper Bollinger Band at $3,660.34. Breaking through these levels could open the path towards $3,800 and beyond. On the downside, defending the $3,400 support is crucial for maintaining bullish sentiment. A drop below this level could see Ethereum retesting the $3,252.96 support and possibly the $2,845.59 level if bearish momentum intensifies.

Dogecoin Macro Downtrend Retest and Inflow Spike Suggest a Reversal, Here’s Why

0

Meme coin market leader Dogecoin is retesting its macro downtrend line, forming support for a potential bullish uptrend.

A recent analysis by crypto trader and analyst Rekt Capital disclosed that Dogecoin broke its long-term downtrend and is currently in a retest phase, building support for a more significant upside.

Dogecoin Macro Downtrend Break and Retest

Notably, in Q1, Dogecoin significantly broke out from its macro downtrend that originated from its 2021 peak. DOGE soared to a multi-year high of $0.2054 on March 5 during this time. As the analyst noted, this significant move marked the end of a prolonged bearish phase, ushering in a bullish era.

Meanwhile, since the breakout, Dogecoin encountered a major setback, reaching a low of $0.09379 early this month.

Rekt Capital observed that following the bearish performance, Dogecoin has been retesting its macro downtrend line, which now serves as a crucial support level. The analyst noted that Dogecoin holding above this level would confirm the end of the macro downtrend and the onset of a new macro uptrend.

Dogecoin Wallet Sees 867% Surge in Inflows

Recent data from IntoTheBlock highlights substantial inflows of Dogecoin by holders, reflecting increased market interest that could lead to a buying spree. Over the past week, investors accumulated 800.95 million DOGE at a price of $0.139250.

The figure translated to an 867.04% positive seven-day change to the inflow of tokens to Dogecoin wallets, suggesting heightened accumulation and buying interest.

5834634409746222168 1

Despite these inflows, the price of DOGE has fluctuated, currently standing at $0.136387, a decrease of 2.09% on the day of the snapshot. These accumulation trends and price movements illustrate the relationship between market demand and price action.

On the other hand, heightened outflows from Dogecoin wallets over the past few months correlated with the asset’s price decline, represented by the black line in the chart below.

The data suggests that substantial sell-offs by large holders have exerted downward pressure on the price of DOGE in the past weeks. However, the trend is gradually changing course with the massive percentage surge observed in the seven-day inflow.

Dogecoin outflows

At press time, Dogecoin trades at $0.1325. While this reflects a 5% decline today, the asset maintains an 8.28% gain in weekly performance.

Channel Breakout In CORE DAO Paints A Target At $3

CORE DAO records a near 80% rally within three weeks, having completes a V-shaped reversal, with the bulls looking to sustain the run for a push toward $3 this week.

Amid the bullish rally engineered by altcoins, CORE DAO takes the place among top performers with its ongoing recovery rally. Offering a breakout entry opportunity to retail buyers, the altcoin, currently trading above the $1.50 psychological mark, is ready for a post-retest jump. 

With the streak of lower high formation coming to a potential end, the CORE price aims for a 2x price surge. Will the breakout rally reach the $3 mark in the coming month?

CORE Above $1.50 Breaks the Bearish Trendline in Action

Despite the bull run of almost 600% in early 2024, CORE took a bearish reversal from the 52W high at $3.77. Further, the bearish phase led to a falling channel pattern in the daily chart and dropped CORE under $1 to the $0.85 support level, a 77% decline. 

However, the bullish reversal accounts for an 82% rise and breaks above the resistance trendline of the falling channel. The bullish achievement ends the lower high formation and signals a breakout entry opportunity. 

CORE Price Chart

Currently, the altcoin trades at $1.536 with an intraday fall of 3.89%. Further, it warns of an evening star pattern as it retests the broken trendline in confluence with the 100D EMA. 

The bullish recovery surpasses all the crucial daily EMAs (20,50, 100, 200) and sustains above the $1.50 mark. Further, the daily RSI maintains a positive trend but experiences a minor downtick near the overbought zone at 70%.

CORE OnChain Numbers Reveal Stronger Network

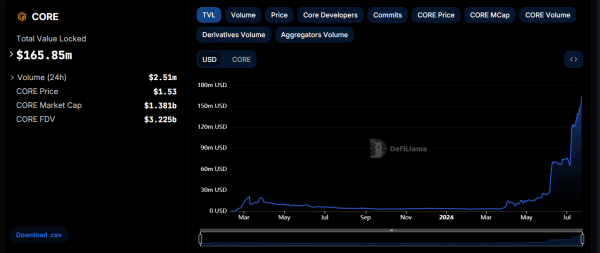
With the bullish recovery, the network strength of CORE DAO improves with the market price. In a recent post, CORE announced that its TVL over the network has surpassed the $150M milestone. As of now, the TVL stands at $165M per DefiLlama. 

CORE TVL
CORE TVL

Furthermore, the unique addresses over the network are close to approaching the 20M milestone. Currently, the data at CoreDAO reveals 19.552M unique addresses. 

Will The Breakout Rally Pump CORE To $3?

With the EMAs on the verge of bullish crossovers and RSI near overbought, the channel breakout in CORE will likely pick up pace with a broader market recovery. As per the trend-based Fibonacci levels, the 78.60% Fibonacci level comes out to be the next potential target level at $3.885. 

If things go south, a crack under the 100D EMA will result in a nosedive to the $1.35 mark.

Helium Reversal Rally Teases a Breakout Run To $10

Helium has registered a 70% surge with a double bottom reversal surpassing $5, as buyers are looking to extend the uptrend to $10.

With the Bitcoin price holding above the $67K mark, the altcoins are picking up pace. Amid the top performers, Helium continues the bull run from last week with a 4.42% surge on Monday.

As the Helium upsurge triggers a reclaim of the psychological level at $5, the buyers anticipate an uptrend continuation. Will the bull run reach the next psychological mark of $10 for a 100% surge?

Trend Reversal for Helium Surpasses All the EMAs

Turning around from the recent 68% correction in Q2 2024, Helium finds a solid support range at the $2.85 level. Despite cracking under the $3 level, the price action reveals a double-bottom reversal with the baseline at $2.85.

The bullish reversal surpasses all the crucial daily EMAs (20,50,100,200) and accounts for a 75% surge in the last 16 days. Currently, the HNT token trades at $5.155 with an intraday rise of 0.53% and a streak of bullish candles.

HNT Price Chart

The trend reversal signals a rounding bottom reversal in the HNT token with a neckline at $6.148. Further, the neckline coincides with the 38.20% trend-based Fibonacci level. 

With the surge in Helium’s price, the 20D EMA gives a bullish crossover with the 50D EMA. Further, the MACD and signal lines maintain a bullish trend, crossing into the positive territory with a streak of positive histograms.

Will HNT Surge 100% in 2024?

As per the trend-based Fibonacci levels, the bullish reversal in Helium has surpassed the 23.60% Fib level. Further, with the rounding bottom reversal approaching the neckline at the 38.20% level ($6.148), the breakout rally increases the uptrend momentum. 

Based on the retracement levels, Helium could reach the $11.462 mark, surpassing the $10 psychological level.

Helium Mobile Subscribers Hit 100,000 

This bullish uptrend could be bolstered by ecosystem developments around Helium. For one, the number of Helium Mobile subscribers recently exceeded 100,000. Further, the Helium Mobile data shows an increase of 2,744 users in the last 7 days.

XRP Outshines Ethereum with 34.24% Gains, Analysts Predict Further Upside

0

XRP has outperformed Ethereum by 34.24% over two weeks; expert analysts anticipate further significant gains based on technical observations.

In a recent analysis shared on X, market watcher RunnerXBT highlighted that XRP has outperformed Ethereum (ETH) by 34.24% over the past two weeks.

The analyst stressed that an investor who had bought XRP dip instead of ETH when BTC crashed to $54,000 early this month would have achieved a significantly higher return.

How XRP Outperformed Ethereum in Returns

The accompanying image of RunnerXBT’s analysis was an XRP/ETH graph that marks the price performances from early July to date, with July 5 as the key reference point. In particular, on July 5, the XRP/ETH pair hit one of the lowest points in recent years.

The chart indicates that XRP gained 0.0000452 in the XRP/ETH ratio since the recent bottom, translating to a 34.24% increase. The XRP/ETH price currently stands at 0.0001724, preserving an 11% weekly gain and a 23% gain against Ethereum.

Regarding individual prices, XRP has soared by over 65% from the low of $0.385, reached on July 5, to a three-month high of $0.06366 on July 17.

Meanwhile, through the same timeframe, ETH expanded by only 24.41% from the low of $2,826 to $3,516.

Experts Predict Further Upside

Amid XRP’s impressive outperformance against ETH, analysts remain optimistic about its prospects, predicting even further upside potential. Notable experts foresee significant gains for XRP, driven by technical analysis and historical price patterns.

For instance, market analyst Javon Marks predicts a substantial surge for XRP, potentially leading to a 41,400% increase, driving its value over $150. Marks’ analysis highlights historical price movements and symmetrical triangles, suggesting an imminent breakout. 

In a separate conversation, analyst “Sensei Hov” noted XRP’s impressive performance, up over 66% from his entry point.

Hov anticipates a three-wave retracement into the $0.47 level before targeting higher. He believes the $0.47 level will test XRP’s bullish momentum.

A Good Time To Buy XRP?

U.S.-based wealth advisor Mickle argues that it is still a good time to invest in XRP. Despite XRP’s recent rally of over 65% from its early-month bottom price to a multi-month high above $0.63, Mickle believes further gains are imminent. 

According to TradingView’s technical analysis, the weekly chart of XRP/USD suggests a bullish bias. 

Source TradingView

The price is above the middle Bollinger Band, indicating upward momentum. The RSI at 57.50 shows a slightly bullish bias, while significant trading volume supports the current price movement.

Forbes Predicts When Shiba Inu Can Reach $0.0001 to $0.0003 

Global business magazine Forbes highlights a timeline for Shiba Inu to make a new history in the $0.0001 to $0.0003 price range, representing a price growth of over 1,600%.

In a recently updated publication, Forbes editors weighed in on the long-term outlook of Shiba Inu. The report explored the potential trading values of SHIB by the end of this year and its outlook for subsequent years, up to 2030.

It first highlighted the prevailing Shiba Inu price around $0.00001743, which now translates to an 8% decline in weekly performance. At this price, SHIB boasts a cap of over $10.27 billion.

When Shiba Inu Can Reach $0.0001 to $0.0003

Meanwhile, some industry experts interviewed by Forbes were ambitious about Shiba Inu’s prospects.

When asked to comment on Shiba Inu’s outlook, Himanshu Maradiya, chairman of CIFDAQ Blockchain Ecosystem, cautioned that predicting its future price is challenging due to the cryptocurrency market volatility.

Despite the uncertainty, Maradiya suggested that Shiba Inu’s price could range from $0.0001 to $0.0003 by 2024 and 2025. He gave the condition that the market conditions are favorable, and the SHIB ecosystem continues evolving. 

With SHIB’s market value at $0.00001743, the lower limit of Maradiya’s prediction demands a growth of 473.72%. Notably, the $0.0001 price point will mark a fresh history for Shiba Inu, as its peak point remains at $0.00008845. Meanwhile, the more ambitious target of $0.0003 demands a more astonishing growth of 1,621.17%. 

While these targets are lofty and worth watching out for this season, Maradiya emphasized the importance of investor caution. He urged the investing public to consider the inherent risks of engaging in meme coins like Shiba Inu.

Interestingly, Maradiya’s bold prediction, as reported by Forbes, resonates with the sentiments of many market analysts in the crypto community. They eagerly anticipate a resurgence of Shiba Inu, which has lost 70% of its gains from the first quarter’s bull run.

Meanwhile, Utkarsh Tiwari, KoinBX’s Chief Strategy Officer, is less ambitious about Shiba Inu’s prospects. He predicts that SHIB may only reach a high of $0.0000396 by the end of 2024, requiring a relatively modest 127% increase from its current value.

Here is The Projected Timeline for Chainlink to Reach $100 Amid Whale Accumulation

0

Multiple projections suggest Chainlink (LINK) could reach $100 in a few years’ time, fueled by whale accumulation and market trends.

On Sunday, July 22, Chainlink (LINK) saw its price reach $15 for the first time in over 30 days, before retreating to $13. This rise coincides with notable activity from large investors. 

Over the last three weeks, whales accumulated 8.46 million LINK, valued at $118.44 million, according to analyst Ali Martinez. Such activity highlights the growing interest in Chainlink among significant market players.

Predicted Timeline for Chainlink to Hit $100

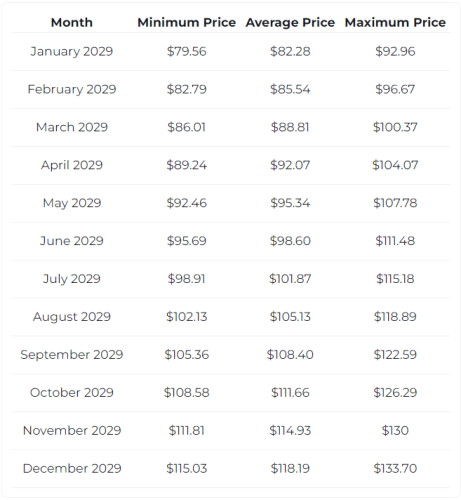
Amid the interest from whales, several platforms have revised their projections, now aiming for bold price targets like $100. According to Changelly, a crypto exchange platform, $100 is a feasible target for LINK, achievable within the next five years. The platform expects LINK to hit a maximum price of $100.37 in June 2029.

Changelly
Chainlink Price Prediction | Changelly

According to Changelly’s chart, LINK could peak at $100 but might not maintain that level for long. Their long-term forecast suggests that by 2029, LINK’s average price might hover around $118.19, with a minimum of $115.03 and a potential peak of $133.70.

ChatGPT’s 5+ Year Vision for Chainlink

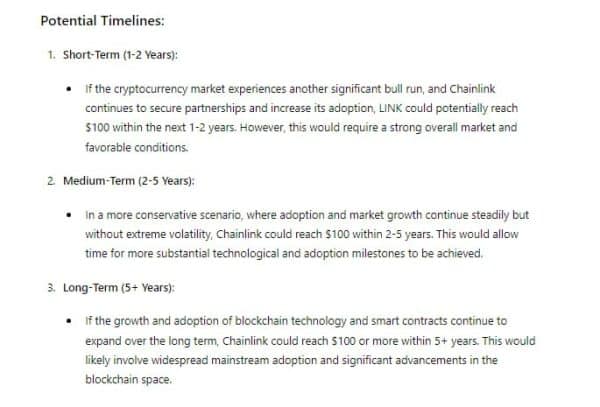
Additionally, we engaged the services of OpenAI’s ChatGPT, which offers a different perspective on Chainlink’s potential. It suggests that if the cryptocurrency market experiences another significant bull run, and Chainlink continues to secure partnerships and increased adoption, LINK could reach $100 within the next 1-2 years. 

photo 5834476818806194140 x

In a more conservative scenario, this target might be achieved within 2-5 years, given steady market growth and technological advancements. Over a longer period, 5+ years, Chainlink’s price could exceed $100, contingent on widespread blockchain adoption and significant technological progress.

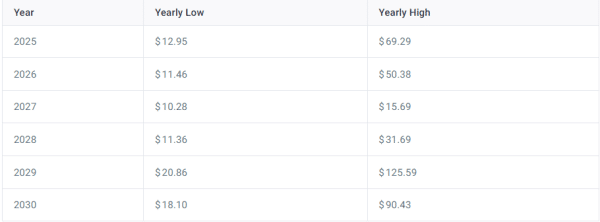
Moreover, Coincodex predicts that Chainlink will need to gain 617.67% to reach $100. Their prediction algorithm estimates that LINK will hit this target by April 2029, reflecting a more gradual ascent compared to other forecasts.

Coincodex
Coincodex

Impact of Whale Holdings on Chainlink’s Future

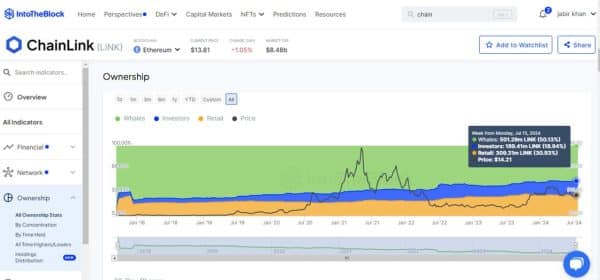
Such price surges could be bolstered by whale accumulation. As of July 15, 2024, whales held 50.13% of LINK, equating to 501.29 million LINK. This large holding by whales can provide price stability if they remain long-term holders. Conversely, significant selloffs by whales could lead to drastic price changes.

photo 5834476818806194141 y 1

Investors, holding 18.94% of LINK, offer a supportive base, aligning with Chainlink’s long-term growth. Retail holders, who possess 30.93% of LINK, play a crucial role in market sentiment and short-term price movements. High retail participation indicates widespread adoption and usage of LINK, essential for long-term growth.

Holding Patterns and Their Long-Term Effects

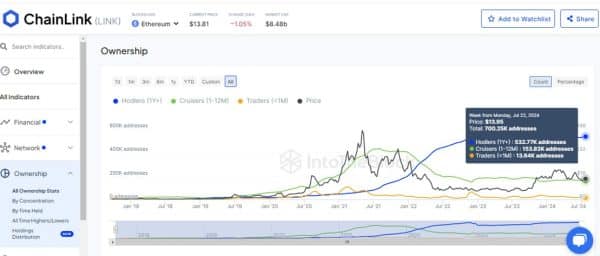
To understand the long-term effects, data from IntoTheBlock reveals the ownership distribution among different types of holders: hodlers (1+ year), cruisers (1-12 months), and traders (<1 month). As of July 22, 2024, hodlers account for 532.77K addresses, indicating strong confidence in Chainlink’s long-term potential.

photo 5834476818806194142 y 1

The number of cruisers stands at 153.83K addresses, reflecting medium-term sentiment and their activity can influence short to mid-term price movements. Traders, at 13.64K addresses, contribute to short-term volatility and market liquidity.

Analyst Sees XRP Reaching Up to $3.1 Following 2,275-Day Accumulation Period

Notable analyst Alex Clay has identified short- and long-term targets XRP investors can anticipate as the asset gradually breaks out of a giant symmetrical triangle.

In a recent post on X, Clay shared his insight about XRP. He highlighted that the asset is now breaking out of a symmetrical triangle configuration. 

The analyst stressed that XRP has been in an accumulation phase for 2,275 days, or over six years, since its 2018 ATH. This period was marked by a challenging period of declining prices and a prolonged battle with the SEC. 

Mid-Term Targets for XRP with 161% Surge

However, Clay is now optimistic that XRP is reversing its course, and as a result, he is bullish on the asset. He went on to outline mid-term and long-term targets that XRP enthusiasts can anticipate if the asset successfully breaks out of the downtrend.

Specifically, the analyst identified $1.258 as his most conservative mid-term target for XRP, while $1.57 represents the more ambitious goal for the asset’s mid-term trajectory.

Notably, with XRP trading at $0.6 at the time of reporting, achieving the higher target would imply a potential surge of 161.6% in the short term.

This projection comes at a time of increased optimism in XRP as the Ripple lawsuit is counting down to a final resolution. This month, XRP has skyrocketed by over 65%, though it is currently correcting most of the gains.

Long-term Targets for XRP with 416% Surge

Meanwhile, Clay expects XRP to only reach $3.1 in a longer time frame after breaking out of the symmetrical triangle structure. This is his most ambitious outlook for XRP for this bull season, as he projects the $3.10 to materialize around 2026. Notably, $3.10 would mark a substantial return of 416% from XRP’s current value.

Clay’s analysis only considered the symmetrical triangle XRP formed after the 2021 peak of $1.96. Emphatically, he only sees XRP surpassing this target in this bull run. The analyst’s projections do not see XRP cracking the 2018 ATH of $3.84.

Some other market watchers have expressed similar views, even arguing that $2 is XRP’s peak for this cycle. 

Meanwhile, more ambitious analysts are expecting XRP to expand by over 70,000% and trade in the triple-digit range after breaking out of its giant symmetrical triangle. They anticipate a repeat of the historical pattern where XRP expanded by over 700X between 2017 and 2018.