Home Blog Page 1351

Zeebu (ZBU) Achieves New All-Time High As Whales Actively Accumulating Token

0

The cryptocurrency market is a treasure trove of opportunities for those who can analyze market trends and identify potential cryptos for substantial and safe returns within a short period. Among the recently launched altcoins, Zeebu (ZBU) has been on an exhilarating uptrend, culminating in a historic all-time high of $5.16. This unprecedented ascent has captured the attention of seasoned and novice investors alike.

With each new peak, the question arises: Is this the start of an epic bull run, or is a correction imminent? Let’s dive into a technical analysis to uncover potential insights into Zeebu’s future price movements.

Understanding the Zeebu Rally

Before delving into technical analysis, let’s briefly discuss the potential factors behind Zeebu’s impressive rally. While this article focuses on technical indicators, fundamental analysis can provide valuable context.

  • Increasing Adoption: A surge in user adoption and partnerships could be driving demand for Zeebu, with nearly 497 international telecom business and enterprise users leveraging Zeebu’s Web3 payment settlement platform.
  • Platform Growth: Zeebu’s Web3 payment settlement platform addresses several challenges in the telecom industry, showcasing strong platform growth in a short span. Recently, Zeebu announced surpassing $3 billion in transaction volume on the platform.
  • Market Sentiment: Positive market sentiment towards cryptocurrency in general, or specific developments within the Zeebu ecosystem, might be fueling the rally.
  • Speculative Buying: The fear of missing out (FOMO) can lead to rapid price increases as investors rush to buy, pushing prices even higher.
  • Recent Announcements: Zeebu recently announced its upcoming and largest token burn event in crypto history which will result in burning over $1 billion worth of ZBU tokens to ensure sustainable tokenomics, and unveiled the advanced liquidity engine, the ZBU protocol. This announcement has sparked interest among existing investors and new buyers, significantly contributing in reaching new all-time highs for the ZBU token.

Technical Analysis Breakdown

After reaching an all-time high of $5.17, ZBU has seen a minor correction, now trading at $5.13, reflecting a nearly 2% gain in the last 24 hours. Currently, ZBU seems to be in a slight accumulation phase post-ATH, with trading volume noted at $31.4 million.

ZBU Technical Analysis Source TradingView


According to CoinMarketCap data, the recent growth has pushed the token’s market capitalization to over $1.7 billion, marking a more than 500% increase in price since ZBU’s inception. The token has garnered investor trust and attention due to its consistent safe returns and its pattern of higher highs and higher lows. Consequently, bulls have been turning previous highs into immediate demand zones.

Recently, ZBU broke out of an ascending triangle pattern, marking a significant breakout. This development has ignited a bullish wave among investors, with potential targets of $7.0 and $8.5 before possibly reaching a new all-time high at the conceptual level of $10.

ZBU USDT Trend Source TradingView

As per Tradingview, ZBU remains above the upper range of the Bollinger Bands indicator and is poised to break out of the upper band soon. Notably, ZBU has remained stable and bullish despite market turbulence. With Bitcoin recovering from its monthly low, a rapid rally in the altcoin market is anticipated, and ZBU could be a top choice for investors.

The moving average convergence divergence (MACD) indicator continues to rise in the positive region, with increasing green histograms on the daily timeframe.

Additionally, the RSI indicator is approaching the overbought territory, currently at 64. These strong bullish signals could spark the next wave of ZBU’s upward trend.

Conclusion

Zeebu (ZBU) has shown significant growth, recently reaching an all-time high. Technical analysis indicates a strong bullish sentiment, backed by various indicators. The breakout from the ascending triangle pattern, along with the price remaining above the Bollinger Bands, suggests potential for further upward movement. Targets include $7.0 and $8.5, with a possibility of reaching a new all-time high around $10.

Solana Meme Coin POPCAT Explodes by 360% Amid Mainstream Attention: Is Massive Correction Underway?

0

POPCAT, a Solana meme coin, has garnered significant interest from mainstream traders following a remarkable price surge of 117% within the last two weeks.

Santiment, a market intelligence platform, recently posted on X about the remarkable feat of the Solana-based meme coin. The update emphasized that POPCAT has more than doubled in value since July 11.

Indeed, POPCAT traded at $0.3519 early this month but has soared to claim the $1 threshold over the weekend. Considering last month’s low of $0.2173, the Solana meme coin has advanced by 360% in 30 days.

Is a Massive Correction Underway for POPCAT?

Meanwhile, the intelligence platform noted that such sudden spikes in interest and value often precede corrections. This historical pattern suggests that while the current surge draws traders, better entry points may emerge post-correction.

POPCAT Volume and Social Dominance Spike

POPCAT’s social dominance chart reveals a sharp increase, confirming heightened discussions and focus among traders. This surge in social interest often correlates with FOMO, driving more traders to buy in anticipation of further price increases.

Santiment stressed that historically, spikes in social dominance typically lead to corrections as the asset becomes overbought. 

Notably, the trading volume for POPCAT has seen significant spikes, particularly in late February, mid-April, and early July 2024. These periods of high trading activity align with major price movements, as seen with the recent surge in early July. 

Screenshot 2024 07 22 at 165611
POPCAT chart on Santiment

The correlation between volume spikes and price increases suggests strong buying interest driving the current market trend. However, increased volume often precedes higher volatility, indicating the potential for a bearish phase.

What Technical Indicators Say

Analyzing POPCAT’s daily chart reveals critical insights into its current market position. The Bollinger Bands indicate high volatility, with the price nearing the upper band, suggesting an overbought condition.

The 20-period SMA acts as mid-line support, and the price is significantly above this level, reflecting strong upward momentum. 

Screenshot 2024 07 22 at 164054
Source, TradingView

Furthermore, the Relative Strength Index (RSI), currently at 66.75, further supports these observations. It indicates strong momentum without being overbought, suggesting that while there is room for further price increases, a correction may still occur. 

At press time, POPCAT trades at $0.9049, having lost 6% of its value in the last 24 hours.

Bitcoin (BTC) Price Analysis: Biden Announcement to Drive $70k Rally?

Bitcoin price reached a 30-day peak of $68,457 on Monday July 22, 2024 as BTC markets reacted to crypto-friendly Donald Trump stretching his lead further after Biden bows out of the Presidential re-election race. 

Biden Announcement Sends BTC Price to 30-Day Peak

After surviving a mild correction scare on Friday July 19, Bitcoin price entered another uptrend over the weekend, following a dramatic twist in the US Presidential Elections race. 

On July 21, US President Joe Biden announced a decision to stand down from the 2024 re-election race. Investors anticipate that this move could further tilt the market momentum in favor of Donald Trump, a self-acclaimed crypto-friendly candidate. 

Consequently, Bitcoin experienced considerable buying pressure over the weekend, along with the rest of the crypto markets. 

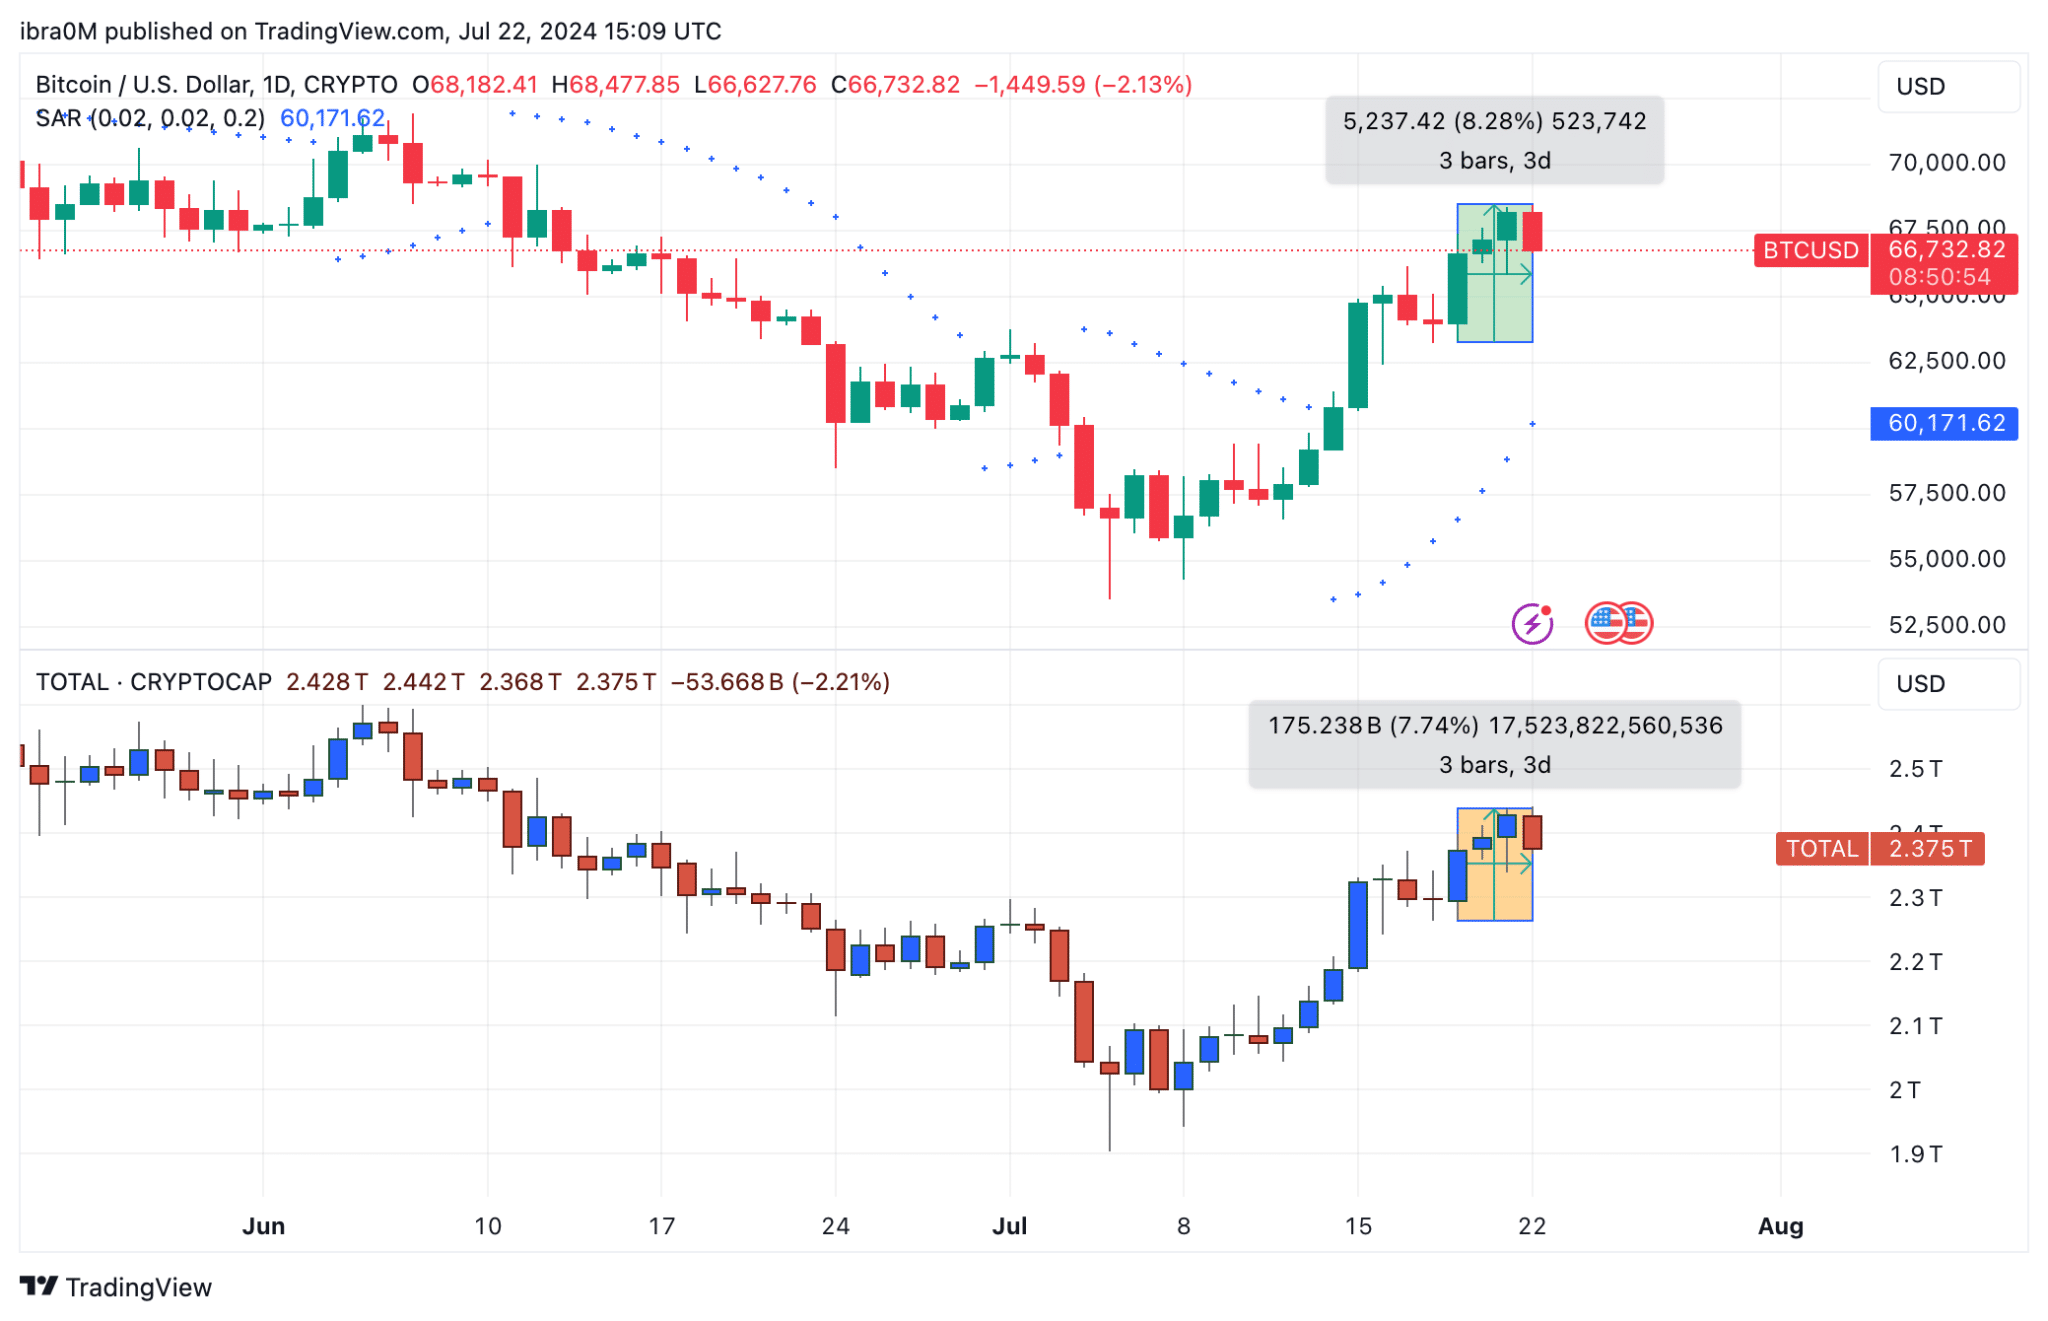
Bitcoin Price Action (BTC/USD) vs. Crypto Market TOTALCAP | TradingView

Bitcoin price slid to a daily time frame bottom of $63,294, amid intense market volatility on Friday July 19. However, following Biden’s announcement on Sunday, Bitcoin price climbed 8.28% to reach $68,477, as US markets opened on Monday, July 22. 

Notably, $68,477 is the highest Bitcoin price has traded in over 30-days dating back to June 10. This shows that US-based investors are taking bullish positions on BTC, as Trump stretches his lead further ahead of the Presidential Elections slated for November 2024. 

More so, as the Bitcoin market cap surged by over $100 billion during the 8.2% weekend rally, the rest of the altcoin markets also benefited from the improved market sentiment. The Crypto TOTAL Cap chart above clearly shows how the aggregate valuation of the broader crypto market increased 7.74% (~$175 billion) during the last 72-hours. 

During Biden’s administration, US authorities have been locked in long-running legal battles with various crypto entities, including Ripple, Binance, Coinbase, Uniswap, to name a few. The administration has also secured convictions of top personalities including Sam Bankman-Fried and Binance Co-founder/CEO, Changpeng Zhao. 

Unsurprisingly, the positive market reaction over the weekend suggests that investors interpret that a Donald Trump presidency could potentially offer a more favorable regulatory landscape for the broader crypto markets, than what the sector has experienced under the Biden 

If this growing narrative persists, it could build up a strong resistance buy-wall preventing  dramatic corrections in the short-term, as Bitcoin price edges closer to the $70,000 milestone.

BTC Price Forecast: $70k Target Now in Sight

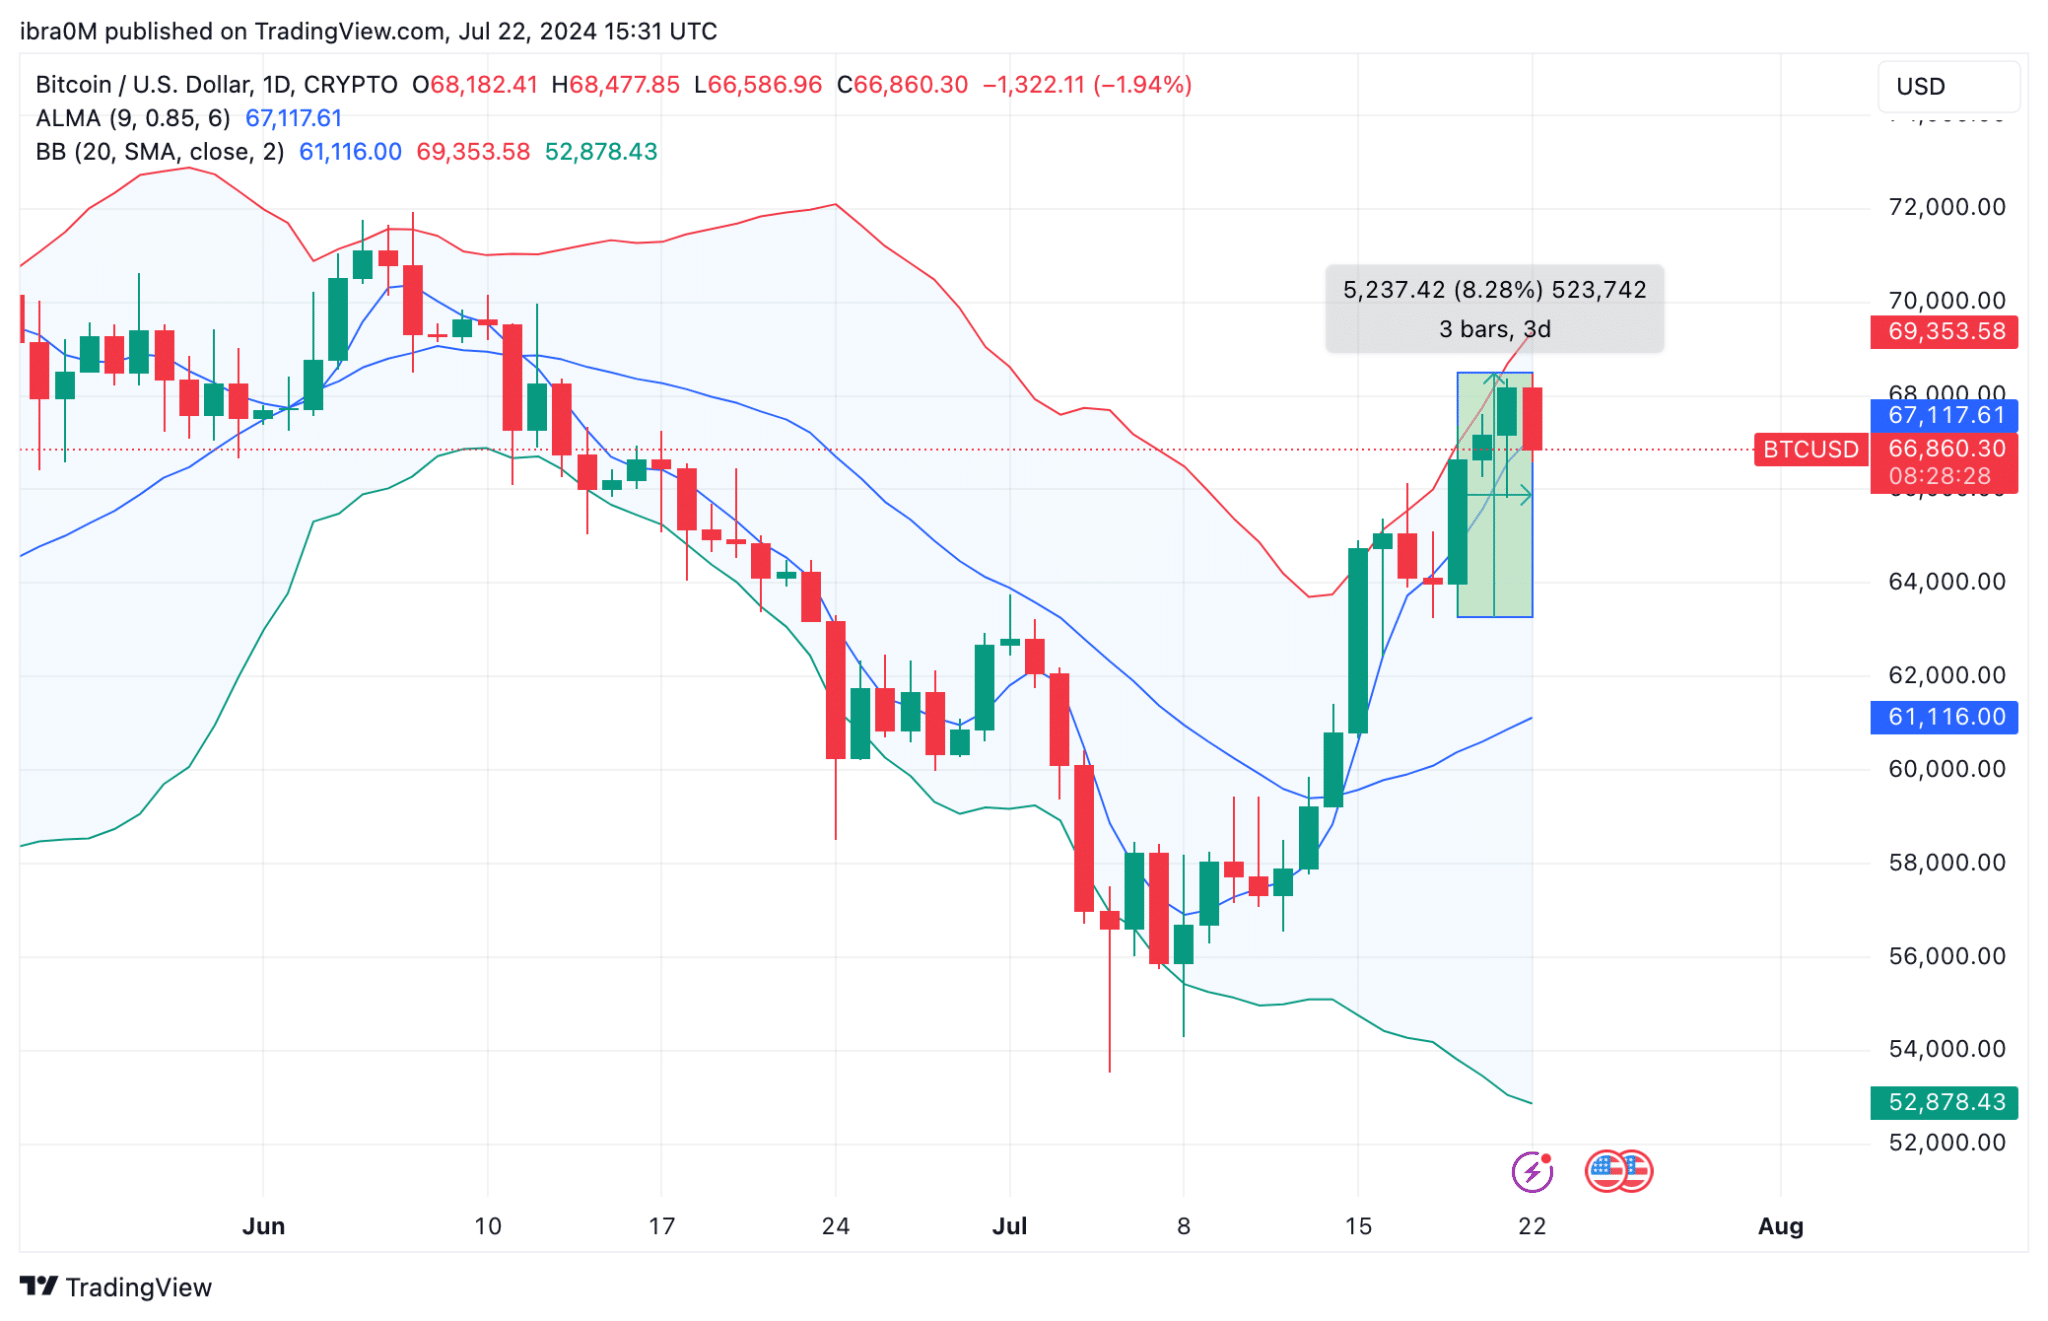
Bitcoin price action over the last 72-hours indicates a significant upward trend, having  recovered strongly from its recent lows. The price has climbed back above the 9-day Arnaud Legoux Moving Average (ALMA) of $67,117.61, suggesting a short-term bullish momentum.

More so, the Bollinger Bands (BB), with the upper band at $69,353.58 and the lower band at $52,878.43, are widening, indicating increased volatility, which is often a precursor to a major breakout.

Currently, Bitcoin is facing resistance around the $68,000 level, as evidenced by the recent pullback from its high. If BTC can break through this resistance, the next significant target would be $70,000, which aligns with the upper Bollinger Band.

Bitcoin Price Forecast (BTC/USD) | TradingView

On the downside, immediate support lies at the 9-day ALMA of $67,117.61, with a more substantial support level at the lower Bollinger Band of $61,116.00.

The recent three-day gain of 8.28%, as highlighted on the chart, further supports the bullish outlook. However, traders should remain cautious due to the increased volatility. A sustained move above $68,000 could pave the way for further gains towards the $70,000 target, but a failure to maintain this level might result in a retracement to the support zones mentioned.

Overall, while the technical indicators suggest a bullish trend with a $70,000 target in sight, traders should watch for potential resistance at $68,000 and monitor the support levels closely to manage their positions effectively.

Chainlink Whales Accumulate $118.44M LINK as Market Volatility Persists

0

Whales have accumulated 8.46 million Chainlink (LINK) worth $118.44 million over the last three weeks.

Chainlink (LINK) has been a focal point in recent market trends, with significant activity from large investors.

Ali Martinez, an analyst on X, highlighted that in the last three weeks, whales have accumulated 8.46 million LINK, valued at approximately $118.44 million. This accumulation, paired with price fluctuations, provides insights into market sentiment and future price movements.

Whales on the Move

The provided data from Santiment showcases a detailed chart from April 21, 2024, to July 21, 2024, illustrating the price of LINK and the accumulation patterns of large holders.

Notably, there was a sharp drop in the LINK price in late April, followed by a gradual recovery through May and June, with fluctuations continuing into July.

The yellow area on the chart reflects the accumulation of LINK by large holders, specifically those owning between 100,000 to 1,000,000 LINK coins. From late June to mid-July, there is a noticeable surge in accumulation, indicating increased buying activity by whales.

This trend peaks on July 21, 2024, suggesting heightened interest and confidence among large investors in Chainlink’s future performance.

Large Holder Confidence in Chainlink

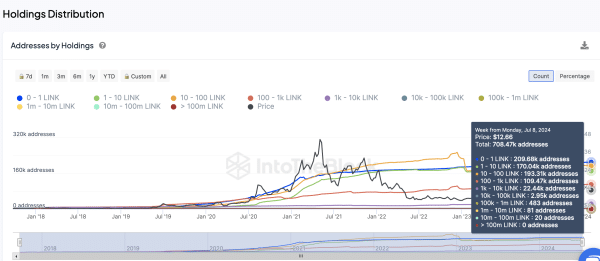
Further analysis from IntoTheBlock provides a holdings distribution chart for LINK addresses from January 2018 to July 2024. As of July 8, 2024, LINK’s price was $12.66, with a total of 708.47k addresses holding varying amounts of LINK.

The distribution shows a high number of addresses holding small amounts of LINK (0 – 10 LINK), indicating widespread participation from retail investors.

Screenshot 2024 07 22 at 172037
Chainlink Addresses by Holdings | IntoTheBlock

Larger holdings (100k – 1M LINK and 1M – 10M LINK) are fewer in number but significant in volume. There are 483 addresses holding between 100K – 1M LINK and 81 addresses holding balances from 1M to 10M LINK.

The slight increase in addresses holding 1M – 10M LINK suggests some accumulation by large holders over time, reflecting confidence among whales and institutional investors.

Market Bottom Indicators

Previous reports indicate critical resistance and support levels for LINK’s price. The key support level lies between $12.52 and $12.87, where 9.1K addresses hold 38.32 million LINK. This range represents strong support, indicating a substantial number of investors are in profit at this price level.

On the resistance side, the price range of $12.92 to $13.26 is crucial, with 10.93K addresses holding 44.04 million LINK. This volume suggests a strong resistance level that must be overcome for further upward movement.

Further resistance is identified at the $14.04 to $14.44 range, with 18.14k addresses holding 35.84 million LINK. Breaking this resistance could propel LINK towards $15.50, according to Ali Martinez and data from IntoTheBlock.

Recent data from Santiment also indicates that Chainlink may be approaching a market bottom. This conclusion is based on significant investor behavior, including its biggest capitulation spike this year and substantial realized losses.

On July 8, realized losses amounted to $60 million, reflecting high levels of fear, uncertainty, and doubt among traders. This capitulation event is an indication of a market bottom.

Ripple Likely to Issue EUR Stablecoin Amid MiCA Restrictions, Experts Say

Reputable figures in the XRP community believe that Ripple could be inclined to issue a Euro-based stablecoin amid MiCA regulatory restrictions.

This idea was first floated by Crypto Eri, a prominent community figure, in a recent post on X. According to Eri, the cryptocurrency market may see an increase in EUR stablecoins as the European Union’s Markets in Crypto-Assets (MiCA) regulation gains traction. 

Notably, MiCA’s rules for stablecoin came into effect on June 30. To operate within the European Economic Area (EEA), stablecoin issuers must meet specific criteria outlined by MiCA. This regulatory framework categorizes stablecoins into e-money tokens and asset-referenced tokens.

One key aspect of the regulation is its cap on non-euro-based stablecoins, such as USD-pegged stablecoins like USDT. Specifically, MiCA imposes a limit of 1 million transactions per day or €200 million in daily trading volume for these stablecoins.

Ripple Likely to Issue EUR Stablecoin

The relatively low volume under this regulation has attracted significant attention among crypto market participants. 

Some observers have suggested that the low volume limit may be a deliberate design choice to allow the market to start slowly with lower volumes, reducing risk.

On the other hand, Crypto Eri envisions that Ripple and other payment firms in the stablecoin market will likely issue a EUR stablecoin to beat the restriction. 

Recall that early this month, Circle, the second-largest stablecoin issuer, introduced the first MiCA-compliant Euro stablecoin “EURC” on the Base blockchain.

In response to Eri’s update, widely followed community figure “WrathofKahneman” expressed that the relatively low trading volume threshold outlined in the MiCA regulation appears to force large companies to create and use a EUR stablecoin. 

“Makes sense Ripple would offer one,” he remarked. Additionally, WrathofKahneman pondered if this development could lead to increased demand for XRP Ledger capabilities.

EUR Stablecoin Benefits XRP Ledger

Meanwhile, Vet, an XRPL dUNL validator, expressed enthusiasm for the potential development. He suggested that the auto-bridge feature of XRPL would benefit from adding more assets, saying, “The more assets, the better.”

Notably, Ripple is preparing to launch a USD stablecoin on XRPL this year. The company recently disclosed the ticker symbol as “RLUSD.” 

However, XRPL enthusiast Jimbo has expressed disappointment that Ripple did not prioritize the launch of a EUR stablecoin, dubbed “RLEUR” instead.

According to Jimbo, Ripple missed an opportunity to gain market share from Tether amid the favorable regulatory environment in the EU. He believes Ripple’s focus on the U.S. market, where the regulatory landscape is less clear, is not so praiseworthy.

Bitcoin Investment Products Attract $1.27B Weekly Inflow, US Leads the Charge

0

Recent data from CoinShares shows that crypto-based investment products saw an astounding net inflow of $1.35 billion over the past week.  

According to the data, the total net inflow recorded in the past three weeks hit a whopping $3.2 billion, reflecting growing confidence and positive sentiment across the market. 

Assets Flows 

Interestingly, over the past seven days alone, Bitcoin-related investment products accounted for $1.27 billion of the total $1.35 billion net inflow recorded during this period. 

Conversely, short-bitcoin investment products witnessed a net outflow of $1.9 million. The report highlights that short-bitcoin exchange-traded products (ETP) have seen $44 million in net outflows since March 2024, representing 56% of its total assets under management (AUM).  

Flows by Assets CoinShares
Flows by Assets | CoinShares

Ethereum ranked as the second asset with the most net inflow over the past week, totaling $45.3 million. Recall that Ethereum witnessed three consecutive weeks of net outflows last month. As of July 1, Ethereum-based investment products saw net outflows totaling $60.7 million in one week, marking its largest outflow since August 2022. 

Ethereum Surpasses Solana YTD Flows 

However, Ethereum has moved past the days of back-to-back outflows. With investors showing significant interest in the cryptocurrency, Ethereum-based ETPs witnessed a $45.3 million inflow last week. 

Following the development, Ethereum overtook Solana as the altcoin with the most inflow year-to-date (YTD) at $103 million. Solana ETPs, which saw an inflow of $9.6 million last week, now boast a YTD inflow of $71 million. 

ETPs related to other altcoins, such as Binance Coin, Litecoin, XRP, Cardano, and Chainlink, also recorded inflows in the past week, respectively totaling $400,000, $2.2 million, $500,000, $400,000, and $700,000. 

Regional Flows 

In terms of regional flows, the United States witnessed the largest inflows, gulping $1.29 billion of the total $1.35 billion. Switzerland ranked behind the U.S., with $66.3 million worth of inflow recorded. Notably, Canada and Australia saw inflows of $7.8 million and $3.8 million, respectively. 

Conversely, Sweden, Brazil, and Hong Kong recorded minor outflows of $600,000, $1.7 million, and $1.9 million in the past week. Furthermore, Germany also saw outflows worth $5.2 million. 

Flows By Providers

Meanwhile, BlackRock’s iShares Bitcoin ETF recorded the largest inflow in the “flows by provider” segment. The top fund attracted investments worth $707 million out of the $1.35 billion inflows. Interestingly, Fidelity’s Bitcoin ETF ranked in the second position, with an inflow of $244 million. 

Other providers that witnessed inflows in the past week include ARK 21 Shares ETF, Bitwise ETF, and 21 Shares AG. These providers recorded inflows worth $99 million, $71 million, and $49 million, respectively. 

Grayscale’s investment products saw the most weekly outflow at $52 million. In addition, Purpose Investment and CoinShares XBT recorded minimal outflows of $1 million each. 

WazirX Receives 80 Intentions to Recover Stolen Shiba Inu and More in Bounty Program

0

WazirX, one of the largest exchanges in India, has received up to 80 intentions from individuals looking to help recover the stolen Shiba Inu tokens and other assets for the bounty program.

Following the recent hack, the exchange announced a bounty program aimed at recovering $230 million in stolen assets, including $100 million in Shiba Inu (SHIB). WazirX rolled out a two-bounty program. The first, known as the “track and freeze,” offers up market participants up to $10,000 for information that helps in freezing the assets.

The second part of the bounty program is a “white hat recovery” bounty, which seeks the help of ethical hackers. Participants in this program can earn up to 10% of the amount they help recover, with the total cap for rewards recently increased to $23 million following community feedback.

As per the announcement, the bounty program is set to run for three months from the date of the announcement. In a statement on X (formerly Twitter), WazirX called on white hat hackers and blockchain and cybersecurity experts from around the world to join this important mission. So far, the exchange has received 80 white hat hackers’ applications.


The WazirX Attack

WazirX faced a major cyberattack on July 18, losing funds in several cryptocurrencies, including around $100 million in Shiba Inu (SHIB) tokens. The incident coincided with a sudden 8.5% drop in the SHIB’s value.

Other stolen funds included $52 million in Ether (ETH), $11 million in Polygon (MATIC), and around $13 million in other cryptocurrencies like FLOKI, Chainlink (LINK), Fantom (FTM), and Fetch.ai (FET). However, since the breach, the WazirX attacker has converted the majority of the stolen funds into Ether and transferred them to different wallets.

The impact of the cyberattack has been severe, affecting WazirX’s ability to maintain a 1:1 collateral with assets. As a result, the exchange has temporarily paused all deposits and withdrawals on its platform. Additionally, trading activities have been halted to allow for a comprehensive security audit.

While WazirX has not provided a specific timeline for resuming normal operations, the exchange has assured its users that it is actively working on enabling fund withdrawals as soon as possible.

Nischal Shetty, co-founder of WazirX, recently stated that his exchange is reaching out to over 500 other exchanges globally to block the addresses associated with the stolen assets.

Cardano Founder Hard Fork Suggestion Births Speculations of a New Meme Coin

0

A suggestion from Cardano founder Charles Hoskinson for the next hard fork name has sparked speculations around the birth of a new meme coin.

These speculations are primarily due to Hoskinson’s influence in the Cardano and broader crypto communities; a phenomenon observed with the recent slew of meme coin launches related to him. 

Cardano Hard Fork Names

Cardano is on the verge of fully welcoming the Chang hard fork, with Phil Chang, an early Cardano proponent who passed away two years ago being the inspiration behind the name. The Chang hard fork will mark Cardano’s entry into the Voltaire era, characterized by improved decentralization.

Amid the anticipation around the forthcoming hard fork, some community members have made propositions for the name of the next hard fork after Chang. Notably, Cardano’s most recent hard fork was the Valentine hard fork, so named because it occurred on Feb. 14, 2023. Before Valentine, Cardano witnessed the Vasil hard fork in September 2022.

With Chang on the verge of implementation, community members already have names for the next hard fork. Interestingly, the Cardano founder took to X to jump on the trend. Hoskinson humorously suggested in a recent post that they could call the next hard fork a Tasseled Wobblegong Shark.

For the uninitiated, the Tasseled Wobbegong Shark is carpet shark species that primarily inhabits the shallow waters of the Indo-Pacific. The carpet shark features a unique fringe of skin flaps around its head, resembling tassels. This sets it apart from most sharks, giving it a distinctive look.

Speculations around an Imminent Meme Coin Launch

Hoskinson’s humorous reference to the carpet shark species has sparked speculations around a possible meme coin launch. Notably, the Cardano founder has recently found himself embroiled in multiple cases involving new meme coins. These new tokens have taken inspiration from his pets. 

Last month, Hoskinson’s pet pig NIKE took center stage when the Cardano founder shared a picture of the animal. Shortly after, a meme coin inspired by the pig began trading in the market. At the time The Crypto Basic reported the event, the meme coin had surged 80,370% in 24 hours.

Moreover, another meme coin with an inspiration from Hoskinson’s pet parrot emerged a few days after Nike launched. Nonetheless, this meme coin took a hard hit when Hoskinson confirmed that the parrot’s name is not Rio, as earlier speculated. The token saw a 96% price slump in an hour.

Citing these instances, proponents have suggested that the community could soon witness the launch of a Tasseled Wobblegong Shark (TWS) meme coin. California-based coach Jeff Sutherland began a countdown for such a launch. Another commenter suggested a similar outcome. 

At the reporting time, The Crypto Basic has not discovered any meme coin associated with the name. However, the possibility of a launch in the next few days remains high. The Cardano ecosystem has also had its fair share of meme coins, with SNEK being the most successful one to date.

Despite Weakness at $0.030, Vechain (VET) at Crossroads Eyes $0.050

Despite the 37% price jump in the Vechain (VET) price, which is struggling to surpass the $0.032 level, the altcoin warns of a continuation of the downfall.

Notably, a potential evening star and a falling channel formation warns of the $0.030 breakdown. However, will the breakdown rally hit 0.027?

Vechain Struggles At $0.32 Post 42% Surge

With a clear downtrend in the daily chart, Vechain has dropped from the 2024 peak at $0.051 to test the $0.02254 support level. The downfall accounts for a 54% decline in the VET market cap in just four months. 

Vechain Daily Chart

However, amid the broader market recovery coupled with the hype surrounding the VeBetterDAO release, Vechain quickly took a bullish reversal. The reversal from the $0.02254 level accounts for a 42% surge to challenge a secondary resistance trendline marked out in the chart above.

VET reclaims the $0.030 mark but struggles to surpass the overhead trendline, resulting in additional stress of over $0.030. Currently, VET trades at $0.029, registering an intraday decline of 1.92%. However, the constant show of underlying demand is visible with lower price rejections in the form of small-tailed candles. 

Amid the declining momentum, the MACD and signal lines warn of a bearish crossover as VET tests the 23.60% Fibonacci level at $0.029.

Declining Channel Warns $0.030 Drop

In the 4H chart, VET trades within a falling channel pattern and tests the 100 EMA near the support trendline. While a potential double bottom reversal looms, underlying demand teases a strong bull cycle. 

Vechain 4-hour price chart

Further, the RSI line shows a gradual lateral shift as the downfall takes support. With a bullish divergence in the 4H RSI line, the momentum indicator teases the Vechain market price spike. 

Will VeChain Surpass $0.050?

A high momentum uptrend is possible because the bull cycle in the 4H chart gains momentum to break the falling channel. Starting a domino effect, the channel breakout could result in the secondary resistance trendline in the 1D chart. 

Analyzing the bullish targets based on the Fibonacci levels, Vechain is likely to reclaim the 50% Fib level at $0.036. However, a bullish failure and breakdown under $0.030 will likely drop VET to $0.025. 

The chances of reaching $0.050 depending on the critical trendline breakout. In such a case, the bull run will not just hit $0.050 but likely surge to the 1.618 Fib level at $0.069.

Veteran Analyst Peter Brandt Sees Bitcoin in Down Channel, Not Flag

0

Veteran market watcher Peter Brandt identifies a congestion in the price movements of Bitcoin, which he believes is a down channel rather than a flag.

In a recent update, Brandt pointed out a congestion phase in Bitcoin, emphasizing its classification as a down channel. The season analyst noted that flags typically last between four to six weeks, while the present congestion in Bitcoin has extended beyond this timeframe, hence its labeling as a down channel.

Bitcoin Likely Due for Trend Reversal

Brandt’s analysis highlights the significance of the current down channel in Bitcoin’s price action within the context of its broader uptrend.

The down channel is characterized by two parallel trendlines, suggesting a controlled price action within a defined range, indicative of a consolidation phase within the larger bullish trend.

Notably, these trendlines are Bitcoin’s 18-week and 8-week moving averages, providing both long-term and short-term trend perspectives. The recent interaction between these moving averages could signal potential trend changes, further guiding traders in their decision-making processes.

Brandt has identified a key resistance point at $71,980.00, a crucial point to watch for a potential breakout.

Notably, this latest assessment from Brandt follows his repeated warnings that Bitcoin could be heading for bearish days despite recent price gains. In a previous analysis during a period of selling pressure, he argued that the bull market might be over, predicting a potential correction to $48K.

Analysts Believe Bitcoin Still in Uptrend

Following Brandt’s analysis, various market analysts and traders shared their insights and reactions. One commenter suggested that the pattern might be a descending broadening wedge, to which Brandt responded, acknowledging the possibility of the pattern morphing.

Some analysts viewed the prolonged period around the $65,000 area post-halving as potentially bullish, speculating a possible breakout to the upside rather than the bearish sentiment Brandt suggests.

Another critic argued against Brandt’s interpretation, emphasizing that technical observations on charts are not absolute and open to interpretation.

In addition to Brandt’s analysis, other market watchers have previously pinpointed crucial price levels that could determine Bitcoin’s next direction. Micro2Macro, a pseudonymous market analyst, highlighted the 200-day moving average as critical.

Moreover, while Brandt is bearish, other analysts continue to argue that Bitcoin will attain new lofty highs. Market pundit John Osterman predicted a significant price surge for Bitcoin after the 2024 halving, potentially surpassing $400,000. Osterman’s analysis draws on historical trends, noting substantial price increases following previous halving events.

At press time, Bitcoin hovers around $67K, reflecting a growth of 8% over the past week.