Home Blog Page 1356

PEPE Price Analysis: Here’s Why PEPE Dipped 10% in 48-Hours

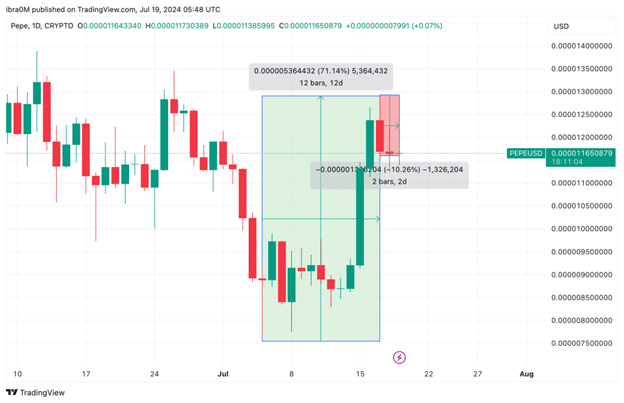
PEPE price rose 70% within a frenetic 12-day period, before retracing 10% towards $0.000012 on July 19, on-chain analysis explores the main catalysts behind Ethereum’s second-largest meme coin’s ongoing pullback.

PEPE Price Hits Brick-wall after 70% Gains

After multiple all-time highs in the last 60-days, PEPE price continued on its remarkable upward trajectory at the start of this week. However, after delivering gains in excess of 70% within a frenetic 12-day period, profit-taking and events surrounding the Ethereum ETFs launch have pulled the hand brakes on the PEPE price rally. 
PEPE Price Action PEPE USD 19 7 24
PEPE Price Action (PEPE/USD) | TradingView

Between July 5 and July 17, the PEPE price had increased by a whopping 71.14%, from a 100-day bottom of $0.000007 to reach the $0.000013 level on Wednesday. This sparked hopes that the PEPE price could reclaim the all-time highs of $0.000017 recorded back in May. However, over the last 48 hours, those bullish speculations have gone cold. 

PEPE Traders Take “Sit-and-Watch” Stance Ahead of Ethereum ETFs Launch

Rather than advance further, the PEPE price has now retraced 10% towards the $0.00011 area at the time of writing on July 19. When assets begin to retract during a period of market-wide bullish sentiment, it suggests active profit-taking and less aggressive bullish trading among existing investors.

The IntoTheBlock chart below monitors the daily count of all transactions executed within the PEPE cryptocurrency ecosystem. This shows the level of trading activity that investors are currently engaging in and how that could impact short-term term price trends.
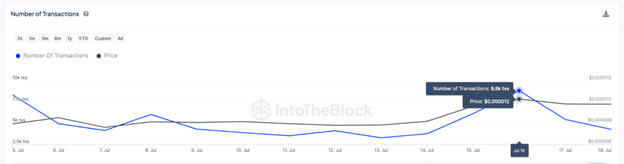
PEPE Price vs Daily Transactions 19 7 24
PEPE Price vs. Daily Transactions | IntoTheBlock

Daily Transactions count is a proxy for measuring, investors’ enthusiasm, and short-term network demand. PEPE Investors conducted 8,800 transactions when the markets peaked for the month on July 16. Unsurprisingly, within 24-hours PEPE price hit a 25-day peak of $0.000013 on Wednesday July 17.

But since then, the network transactions have cooled significantly, signaling that PEPE bulls could be taking their foot off the gas as the week draws to a close. At the time of writing, the latest data shows that PEPE attracted only 4,250 transactions at the close of July 18. 

This reflects that investors have cut back on their network activity by over 50% within the last 48 hours. 

The upcoming Ethereum ETFs’ launch, slated for July 23, is one key event that could drive this bearish shift in PEPE network activity. As the second-largest memecoin hosted on the Ethereum network, investors anticipated that the inflows by the ETH ETFs could spill over towards strategic native tokens. 

The US SEC approved Ethereum ETF applications nearly two months ago on May 24, since then, multiple proposed launch dates have been delayed. As the newly-designated July 23 launch date approaches, investors are aware that another last-minute delay could spark widespread bearish price action. 

With the launch date now barely 3-days away, the growing uncertainty could partly explain why PEPE investors have taken a less aggressive stance by cutting network transactions by 50% over the last two days. 

In PEPE bulls remain in sit-and-watch mode, as observed since July 17, bears could set-sights on a rapid breakdown below $0.000010. 

PEPE Price Forecast: Possible Detour Below $0.000010

PEPE price has recently experienced a notable increase of 71.14% over a 12-day period, reaching a high of approximately $0.000011796. This upward movement is characterized by a breakout above the 20-day Simple Moving Average (SMA) and the middle Bollinger Band, indicating a strong bullish momentum. However, the price encountered resistance at the upper Bollinger Band around $0.000012796, where it appears to have consolidated.

Currently, PEPE is trading near $0.00001176, with the Bollinger Bands starting to widen, suggesting increased volatility. The key resistance level to watch is at $0.000012796, where the price has struggled to break through. If PEPE manages to close above this resistance, it could pave the way for further gains toward the next psychological resistance level at $0.000014000. 
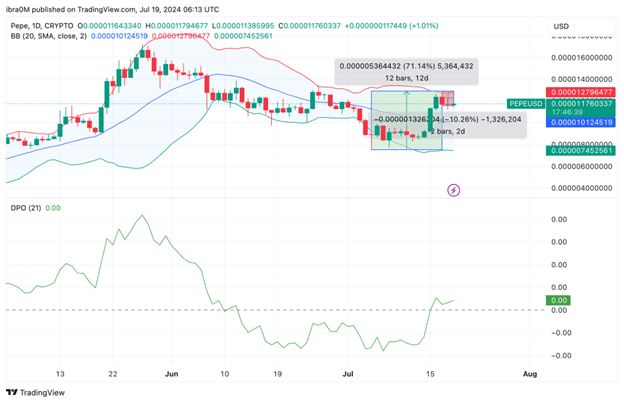
PEPE Price Forecast 19 7 24
PEPE Price Forecast | TradingView

On the downside, immediate support is found at the 20-day SMA around $0.00001012, followed by stronger support at the lower Bollinger Band near $0.00000745.

The Detrended Price Oscillator (DPO) below the price chart has started to tick upwards, indicating that the bullish trend might continue in the short term. 

However, traders should be cautious as a potential correction could occur, bringing the price below $0.000010 if the support levels fail to hold. In such a scenario, the price could retest the recent low around $0.00000745, presenting a buying opportunity for those looking to enter at lower levels.

Toncoin (TON) Price Targets $8 Retest amid 200% Growth in Userbase

Toncoin price has rebounded 3% in the last 48-hours to reclaim the $7.30 mark on July 19, on-chain analysis explores how new users trooping into the network could drive TON further towards the $10 milestone target. 

Toncoin Rally Continues after 7.5% Correction

Toncoin has emerged, arguably the best performing Layer-1 blockchain sector in terms of network growth and adoption since the start of 2024. Unsurprisingly, the native coin TON, has been in hot demand among network users and speculative traders alike. 

However, since breaking into new all time highs of $8.28 last month, the $8 mark has formed a major psychological resistance for Toncoin bulls. This bearish catalyst came to fore again this week.

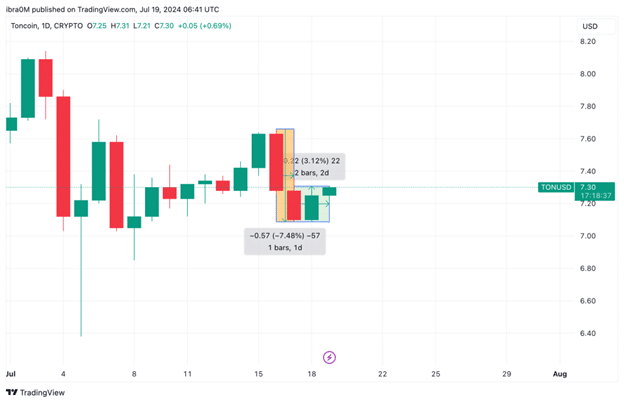
Toncoin Price Action TON USD 19 7 24
Toncoin Price Action | TON/USD | TradingView

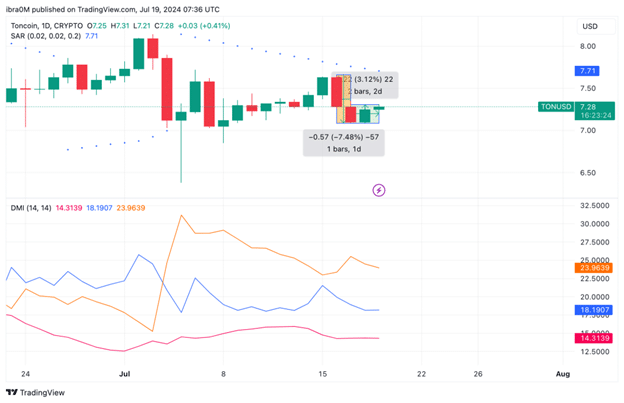
The chart above shows how Toncoin price retraced 7.48% to hit $7.09 on July 17 after having reached the weekly peak of $7.65. But within just 24-hours, bull traders stepped on the gas to avert a bearish trend reversal. 

At the time of writing on July 19, TON price has rebounded 3% to reclaim the $7.30 mark, on course to post 2 consecutive green candles (gainer trading days). 

Toncoin Userbase has Grown 200% In 2024

Since Wednesday, July 17, Toncoin’s rival Layer-1 coins in the top 20 crypto market rankings, including BTC, BNB, and DOGE, have recorded significant pullbacks as crypto investors begin to book some profits after two weeks of persistent uptrend in prices. 

This rare market divergence suggests the presence of a unique internal catalyst driving up TON prices while other rival assets have struggled in the last 48 hours. On-chain data trends suggest the persistent increase in Toncoin’s user base could be a key factor. 

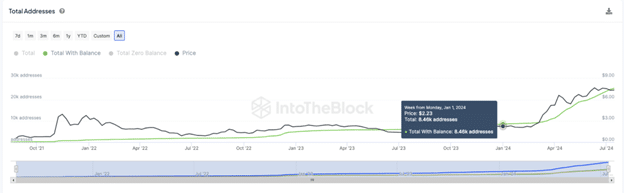
The IntoTheBlock chart below represents Toncoin’s network growth by tracking the real-time changes in the number of actively funded wallet addresses holding TON.

Toncoin Price vs TON Funded Wallets
Toncoin Price vs. TON Funded Wallets | IntoTheBlock

According to Toncoin blockchain data, there were only 8,460 active wallet addresses held units of TON as of January 1 2024. But thanks to dynamic partnerships and innovative products launched particularly within the GameFi, and Social trading sectors, Toncoin has experienced breakout growth since the turn of the year, which culminated in a 400% rally to new all-time highs on June 15. 

At the time of writing on July 19, Toncoin now has over 25,220 active funded addresses, reflecting 200% growth in its core user base since the turn of the year.  Essentially, this trend emphasizes Toncoin’s meteoric 400% growth over the last 6-months has been driven by organic growth.

An increase in the number of funded addresses is interpreted as a critical bullish signal as it indicates the influx of new investors, who are not only creating accounts but actively funding them to conduct valuable ecosystem transactions.  

This week, Toncoin added another 460 new fund wallets. The demand and fresh capital inflows from those new investors puts upward pressure on TON price. This partly explains why TON price has recorded a 3% bounce between July 17 to July 19, while other mega cap assets have struggled. 

Toncoin Price Forecast: Bulls Set Sights on $8 Retest

Toncoin’s 3.12% price surge indicates a positive shift in sentiment. Based on the current technical analysis, TON’s short-term momentum continues to signal more upside ahead. 

The Parabolic SAR (Stop and Reverse) indicator is positioned above the current price at $7.71, suggesting a potential shift in trend if the price manages to break above this level. 

A successful breach of the SAR level would confirm a bullish reversal, setting the stage for a retest of the key resistance at $8.00.

Toncoin Price Forecast TON USD 19 7 24
Toncoin Price Forecast (TON/USD) | TradingView 

The initial resistance at $7.71, marked by the Parabolic SAR, must be overcome to maintain the bullish momentum. Beyond this, the psychological resistance at $8.00 is crucial. 

A break above $8.00 could signal further gains and validate the bulls’ strength, targeting higher levels.

The Directional Movement Index (DMI) supports the bullish outlook, with the +DI (blue line) at 18.1907 above the -DI (red line) at 14.3139. The ADX (orange line) at 23.9639 suggests a moderately strong trend. If the ADX continues to rise, it will further confirm the strength of the bullish trend.

On the downside, immediate support is found at the recent low of $7.21. If this level fails to hold, the next support level is around $7.00, which is crucial for maintaining the bullish outlook. A drop below $7.00 could invalidate the current bullish setup and lead to further downside.

Dogecoin Price Analysis: Will this Signal Halt DOGE’s 40% Rally

Dogecoin price slid to $0.12 on Friday July 19, marking an 8% correction in the last 48-hours, on-chain data beams the spotlight on how DOGE miners recent trading activity may have contributed to the ongoing pullback.

Dogecoin’s 40% Price Rally Halts at $0.13

Over the last 2-weeks Dogecoin price has experienced a relatively positive price performance. The positive swing in US macroeconomic landscape, as well as crypto-friendly candidate Donald Trump taking an early lead in the US 2024 Presidential Campaigns race have shored up investor confidence across the crypto sector.

The memecoin sector has not been left out of this dramatic demand surge. Since the positive CPI data was released on July 5, mega-cap assets like Dogecoin (DOGE) and Shiba Inu (SHIB) have witnessed significant upside.

Dogecoin Price Action DOGE USD 19 7 24
Dogecoin Price Action (DOGE/USD) | TradingView

Dogecoin price had increased by a whopping 40% between July 5 and July 17. But as seen in the chart above, the DOGE price rebound phase halted at the $0.13 level on July 17 and has entered a steep pullback since then.

At the time of writing on Friday, July 19, the DOGE price has now retraced toward the $0.12 area. This reflects an 8% downsizing from the weekly timeframe top of $0.13 recorded on Wednesday.

However, while the DOGE price has retraced considerably in the last 48 hours, other memecoins like PEPE and SHIB have shown more resilience, holding on to their gains from earlier in the week.

Dogecoin Miners Capitalized on Market Rally to Sell-off $84M DOGE

When an asset decouples from its broader sector trend during a market rally, it suggests the presence of some internal bearish catalysts. On-chain movements suggest the Dogecoin miner’s trading activity could be behind DOGE’s recent price correction.

The chart below tracks the real-time changes in DOGE balances held in the custody of recognized miners and mining pools. This metric strategic investors to how quickly miners are drawing down on their reserves and block rewards, and how it could potentially impact short-term price action.

Dogecoin Price vs DOGE Miner Reserves
Dogecoin Price vs. DOGE Miner Reserves

When the market rally began around July 5, Dogecoin miners held a total of 4.44 billion DOGE in their cumulative balances. However, since the demand surge in the wake of positive NFP and CPI data began to lift DOGE, the miners have entered sell-off mode to capitalize on the rising prices.

At the time of writing on July 19, the latest Dogecoin miner reserves have dropped to just 4.37 billion DOGE. This reflects that Dogecoin miners have sold 700 Million DOGE in the last 14 trading days between July 5 and July 19.

Miners are highly influential stakeholders within any Proof of Work (PoW) cryptocurrency ecosystem. When they enter a persistent sell-off frenzy, it spooks existing holders while also discouraging potential new entrants.

More so, they dilute the short-term market supply when they offload newly mined coins into exchanges and trading platforms.

Valued at the current prices, the DOGE miners have effectively diluted the short-term market supply with over $84 million worth of newly mined coins. This explains why DOGE’s price has decoupled from the market trend with an 8% pull-back in the last 48 hours.

Dogecoin Price Forecast: $0.10 Could Be at Risk

Dogecoin (DOGE) is currently trading at $0.11969, showing a slight increase of 0.11% over the past day. The technical indicators suggest that Dogecoin is experiencing some volatility, with significant movements in recent sessions.

The Relative Strength Index (RSI) stands at 50.07, indicating a neutral position, neither overbought nor oversold. This implies that Dogecoin might experience sideways trading in the short term. However, the recent RSI movement indicates potential upward momentum, as it has been rising from oversold levels earlier in the month.

Dogecoin Price Forecast Doge USD 19 7 24
Dogecoin Price Forecast (DOGE/USD) | TradingView

The Parabolic SAR dots are positioned below the current price level, indicating a bullish trend. If Dogecoin maintains this upward trajectory, the first significant resistance level to watch is at $0.1212. Breaking above this resistance could pave the way for further gains towards $0.13 and beyond.

However, traders should be cautious of the support level at $0.0965. If Dogecoin fails to hold above this support, it could revisit lower levels, threatening the $0.10 mark.

In conclusion, while Dogecoin shows potential for further gains, the $0.10 support level remains crucial. Maintaining the bullish momentum above key resistance levels could lead to further upward movement, but a breach of the $0.0965 support might pose risks to Dogecoin’s short-term price stability.

Expert Says Ripple Selling XRP Does Not Affect XRP Price

0

Popular American wealth advisor Mickle addresses misconceptions around the periodic XRP sales from Ripple and their impact on XRP’s price.

Ripple, being the largest holder of XRP, is known for unlocking 1 billion XRP from its escrow accounts monthly. While 80% (800 million) of the tokens are re-locked in escrow, the remaining 20% (200 million) is periodically sold to fund the company’s operations. 

Community Thinks Ripple Suppresses XRP Price 

Consequently, some community members accuse Ripple of suppressing the coin’s price via these periodic sales. This was reflected in a poll created by the official X handle of the Good Morning Crypto podcast earlier this year. 

In the poll, nearly 67.7% of 1,964 community members claimed that Ripple’s periodic sales suppress XRP’s price. 

Expert Dismisses XRP Price Suppression Theories 

Reacting, Mickle dispelled these allegations, highlighting multiple factors indicating that the impact of Ripple’s periodic sales on XRP price is minimal. According to Mickle, Ripple conducts its sales strategically to avoid flooding the market with huge amounts of XRP. 

The expert emphasized that these Ripple-related XRP sales account for a small fraction of the token’s 24-hour trading volume, thus minimizing any potential impact on price. 

Mickle stated that the XRP market is liquid and vast, with Ripple’s periodic sales being negligible compared to the asset’s trading volume. 

In addition, the expert identified institutional clients and strategic investors as the primary buyers of Ripple’s XRP holdings. According to Mickle, this move tends to foster long-term benefits, like increased adoption and utility, which outweigh short-term price action.  

Bitcoin Performance Influences XRP Price More Than Ripple’s Sales 

The expert, citing historical data, claimed that Bitcoin’s performance impacts XRP’s price more than Ripple’s periodic sales. 

Like most crypto assets, XRP is correlated with BTC. The top asset’s price action usually determines the movement of the broader market. However, there have been times when XRP has decoupled from BTC, as seen over the past week. 

Contrary to claims about Ripple’s suppression of XRP, Mickle asserted that the company’s efforts contribute immensely to strengthening the XRP Ledger (XRPL), positively impacting the token’s price. 

Finally, the expert said while it is easier to blame Ripple for XRP’s suppression, the company’s periodic sales have minimal impact on price. Mickle added that XRPL’s ecosystem development and broader market trends are more influential than Ripple’s sales. 

Meanwhile, XRP recently led the crypto rally, surging over 40% in one week, according to a Bloomberg report. At press time, XRP has witnessed a weekly growth of 29.19% and a 17.95% surge in 30 days. 

Conversely, the price of XRP is down 5.62% in 24 hours to $0.5816, with its daily volume currently standing at $3.85 billion. 

Market Expert Predicts Bitcoin to Exceed $400K Post 2024 Halving

0

Market pundit John Osterman predicts Bitcoin price could surpass $400K in the wake of the 2024 halving, citing historical trends of significant price increases after previous halvings.

John Osterman, a notable Bitcoin enthusiast, recently posted an image on X predicting Bitcoin could surge above $400,000 this cycle. Osterman’s snapshot indicates that past halving events have significantly boosted Bitcoin’s price, suggesting a similar outcome for 2024.

Historical Trends on Bitcoin Halvings

An analysis of Bitcoin’s price movements reveals notable patterns post-halving. After the 2012 halving, Bitcoin’s price rose from around $400 to approximately $1,100. The 2016 halving saw the price increase from around $8,000 to $15,000. In 2020, the price crossed the $60,000 mark.

During this current cycle, Osterman’s chart projects a potential increase where Bitcoin could exceed $400,000 following the 2024 halving.

The prediction has sparked diverse reactions within the crypto community. Some commenters agreed with Osterman’s projection, citing growing global adoption of Bitcoin and the trend demonstrated in his data as supporting evidence.

One individual mentioned that many influential figures are discussing Bitcoin, and, with increasing global adoption, they foresee $400K and above as achievable.

Expert Analysis

Richard Teng, CEO of Binance, has also gone to X to comment on the cyclical nature of markets, emphasizing the importance of a long-term investment perspective. He noted that it is important to take a long-term horizon when making investment decisions. Historical data supports Teng’s statement, showcasing significant price increases post-halving. 

Richard Teng

For instance, six and twelve months after the 2012 halving, Bitcoin’s price rose by 923% and 7,043%, respectively. Similar trends were observed after the 2016 and 2020 halvings. With only three months since the recent 2024 halving, Teng’s advice suggests potential substantial price increases yet to manifest.

Key Points Ahead of 2024 Halving

It is important to recall that the market analyst Ali Martinez in January highlighted crucial points ahead of the April 2024 halving. Martinez noted that Bitcoin often experiences corrections within a month post-halving, with a 30% drop in 2016 and a 7% drop in 2020. 

However, these dips are usually followed by significant rallies, with prices spiking 11,000%, 2,850%, and 700% after the 2012, 2016, and 2020 halvings, respectively. Martinez also observed that each halving event typically introduces a bull market, lasting between 365 to 549 days.

Japan SBI VC Trade Opens Portal to Earn Shiba Inu Passive Income

SBI VC Trade, the cryptocurrency arm of SBI Japan, has launched an application period for Shiba Inu token holders to participate in its ongoing staking service.

The Japanese crypto firm announced this latest lending widow on Thursday via its official X handle. Notably, this service offers a passive income stream to users who lend out their SHIB tokens.

Lending Shiba Inu on SBI VC Trade

Per the notification, the application to lend out Shiba Inu assets opened yesterday, July 18, and will close on August 1. Afterward, the lending period itself will commence, spanning 28 days and concluding on August 29. 

SBI VC Trade is offering a notable incentive to participants, providing an annual rate of return of 1.3%, including tax, on the deposited SHIB tokens.

SBI VC Trade Open Application

Notably, SBI VC Trade has opened this service for investors who plan to hold onto their crypto assets for an extended period and want to generate passive income in the meantime. Emphatically, the service enables crypto asset holders to monetize their idle digital assets by lending them out and earning rental fees during the designated period.

It is worth noting that SBI VC Trade has been providing this lending service for some time now. Back in April, the exchange announced a recruitment application that offered participants a 2% annual rate for committing their Shiba Inu assets.

Other Crypto Assets with Open Application

Notably, the coin lending service is open to 23 crypto assets listed on SBI VC Trade. In this latest round, applications to lend out XRP, Chainlink (LINK), Litecoin (LTC), Bitcoin (BTC), and Bitcoin Cash (BCH) are currently open. 

The application window for lending BTC and BCH closes on July 25. After that, the loan period will commence and conclude on August 22. BCH offers the highest annual rate of 5% for this lending period.

Meanwhile, the registration period for individuals seeking passive income with their XRP, LTC, LINK, and SHIB holdings will close in 13 days. Notably, within this group, Shiba Inu offers the highest annual return rate of 1.3%, followed by LTC and LINK, which offer 0.5%. XRP offers only a 0.1% return.

Importantly, participants have no additional obligations or responsibilities besides depositing their crypto assets during the lending period.

Pundits Push for XRP Adoption as Bank of England Faces Payment Delays

0

Payment delays affecting the Bank of England (BoE) has sparked calls for the adoption of XRP in traditional payment systems.

The Bank of England recently experienced delays in high-value, time-sensitive payments due to a “global payments issue.” The issue caused disruptions to payments made through the UK’s CHAPS interbank payment system.

Notably, the central bank assured that delayed payments would be resolved before the end of the day. Meanwhile, the crypto community has quickly responded, suggesting that XRP could have helped mitigate chances of the predicament.

Crypto Community Advocates XRP

King Solomon, CEO of Generation Infinity, highlighted the potential of XRP during this disruption. He suggested turning on the XRP faucet to resolve the issue. 

When another user mentioned that the problem was already fixed, Solomon humorously implied that the fix might have involved purchasing XRP from the Fed. 

It is important to note that the issue reportedly originated from a problem with the global Society for Worldwide Interbank Financial Telecommunication (SWIFT) service, though it didn’t impact other nations’ financial infrastructure. This incident renewed discussions about the efficiency of traditional banking systems compared to blockchain solutions like XRP.

XRP vs. Other Systems

Data from the XRP Ledger website reveals significant advantages of XRP over traditional systems and other cryptocurrencies like Bitcoin. Remarkably, XRP settles transactions in 3-5 seconds, while Bitcoin takes around 500 seconds. 

XRP Ledger
XRP v Bitcoin

Transaction costs are also lower with XRP at $0.0002 compared to Bitcoin’s $0.50. XRP’s scalability allows for 1,500 transactions per second, whereas Bitcoin handles only 3. Additionally, XRP is more environmentally sustainable, consuming negligible energy compared to Bitcoin’s 0.3% of global energy.

The XRP Ledger (XRPL) outperforms Bitcoin, Ethereum, and Cardano in major blockchain metrics, particularly speed, cost, and scalability. XRPL transactions average 3.6 seconds, significantly faster than Bitcoin’s transaction time, which can range from minutes to an hour. Ethereum processes transactions in 15 seconds to five minutes, still slower than XRPL.

Uphold and FedNow’s XRP Integration

Notably, Uphold’s support for XRP transactions via FedNow proves the growing acceptance and integration of cryptocurrency in traditional banking. This development allows users to convert their XRP holdings to USD swiftly and securely, leveraging the efficiency of the FedNow system. 

As more financial institutions acknowledge XRP’s significant advantages, its adoption in everyday transactions is likely to increase, paving the way for broader acceptance and utilization of digital currencies in mainstream finance. Regulatory clarity could also play a role in this adoption.

Shiba Inu community Officially Petitions Binance to Burn SHIB

0

The Shiba Inu community is intensifying efforts to have Binance burning SHIB tokens using a portion of the token’s trading fees. 

In an interesting development, popular community member Labib recently launched a petition on Change.org asking the world’s largest crypto exchange to implement a daily burn of 1% of all Shiba Inu trading fees on its platform. 

Petition to Burn SHIB on Binance 

According to Labib, the move is imperative to Shiba Inu’s long-term success and sustainability. The community member emphasized that the proposal will help reduce SHIB’s hefty circulating supply, potentially increasing scarcity and boosting the token’s price. 

Labib said although Shiba Inu community members believe in SHIB’s potential and unique tokenomics, they recognized burns as an essential way to solidify the token’s value proposition.  

“By burning 1% of all daily transactions, we can significantly enhance the value proposition of SHIB and reward the community that has passionately supported this project from the beginning,” Labib remarked. 

As of yesterday, the petition has already attracted 111 signatures out of the initial target of 200. In the meantime, the petition boasts 142 signatures, with 58 signatures left before it reaches its initial target. Notably, the ultimate goal is to hit a milestone of 50,000 signatures. 

Interestingly, the creator of the petition believes the community could achieve the 50,000 signature goal by sharing it across every nook and cranny of the Shiba Inu ecosystem. 

Community Seeks Widespread Burn Initiative 

The development follows the community’s initial discussion about burning SHIB on Binance and Coinbase. At the time, 96.4% of Shiba Inu community members voted in favor of an X poll to actualize this goal. It did not take long before top community members like Lola joined the campaign to persuade Binance to burn SHIB using part of the token’s trading fees. 

Earlier this month, Lola called on Binance CEO Richard Teng to extend the exchange’s LUNC burn support to SHIB. This request got the community deliberating on how impactful the support could drastically reduce SHIB’s hefty circulating supply. 

Recall that Shiba Inu launched with an initial supply of 1 quadrillion tokens. According to data from Shibburn, over 410.72 trillion SHIB have been burned, leaving Shiba Inu with a circulating supply of more than 589.27 trillion tokens. 

Meanwhile, the Shiba Inu community is known for using online petitions to propel crypto-related companies into doing their bidding. This is reflected in SHIB’s listing on Robinhood in 2022. 

It remains to be seen whether the community will be successful in persuading Binance to burn 1% of SHIB’s daily trading fees through its petition. 

XRP Sees Surge in New and Active Wallets, Reaching Highest Levels Since March

0

XRP Ledger experiences record activity in new and existing addresses amid a roadblock to the latest rally, as prices correct to the $0.57 territory.

The XRP Ledger recently witnessed a notable surge in both new and existing addresses, reaching levels not seen since March. This heightened activity comes at a time when XRP is undergoing a steep market correction, recently dropping to $0.57.

XRP Ledger records growth in new XRP wallets

According to on-chain data, the XRP Ledger saw the creation of 1,721 new XRP wallets in a single day—the most since March 30. This spike in new wallet creations suggests a growing interest from new investors and a potential expansion in user base.

Moreover, the number of individual addresses interacting on the network reached 47,363 on a single day, marking the highest level of engagement since March 9. This rise in active addresses indicates not only heightened trading activity but also increased utilization of the XRP Ledger for various transactions.

Responding to community queries, Santiment noted that there is generally positive movement with an uptick in network activity like this. However, there is often a “FOMO effect” at the initial stages when the spike happens that causes a correction, as is currently being observed. The platform added that the current test is to see if XRP’s activity maintains these levels.

Market Impact and XRP Price Performance

Parallel to the increase in on-chain activity, XRP’s price achieved its highest weekly gain ever, peaking at $0.6378 on July 17. However, the price has since corrected to $0.5538, experiencing a 5% drop amidst a broader market correction and profit-taking by traders.

Elsewhere, XRP has recently taken the lead in trading volume within South Korea over Bitcoin. It reached a high of $650 million 24-hour trading volume on the country’s leading cryptocurrency exchanges, surpassing Bitcoin’s by about 2.3 times.

Despite these positive trends, the XRP market has experienced notable fluctuations, highlighted by substantial withdrawal activities. Data from Whale Alert revealed that approximately $111.8 million worth of XRP was withdrawn from two major exchanges in a single day. The funds moved to other prominent exchanges, including Bitso and Bitstamp.

Solana Price Could Pump to $1,400 Amid Bull Flag Formation

0

A bull flag pattern in the Solana weekly chart signals a potential price surge to $1,400, supported by strong development activity and positive sentiment.

A recent analysis by Ali Martinez highlights a bull flag pattern in Solana’s (SOL) weekly chart against the US Dollar. This pattern, often a continuation signal, suggests the potential for further upward movement. 

The bull flag pattern is characterized by two main elements: the flagpole and the flag. The flagpole represents a strong upward move, while the flag indicates a consolidation phase where the price moves within a narrow range. In Solana’s case, the flagpole starts around $20 and reaches up to $200, followed by the consolidation phase. 

The chart covers a period from late 2023 to mid-2024. A black line extending from the flag’s apex indicates a potential breakout point. If Solana breaks above the upper boundary of the flag, it could signal a new upward move, potentially reaching up to $1,400.

Crypto Community Believes It’s Possible

The crypto community has expressed varied opinions on Solana’s (SOL) potential following the recent analysis. One commenter remarked that the bull flag was widely discussed before its formation, but many traders were shaken out as it began to form.

Another individual speculated about a significant increase, suggesting a potential tenfold return and questioning Solana’s performance relative to the overall market and total market capitalization.

In addition, some community members shared varying technical analyses. A particular market watcher noted that their recent chart depicted a symmetrical triangle rather than a bull flag.

On-Chain Metrics Support Bullish Outlook

Meanwhile, recent data from Santiment supports this bullish outlook. Solana’s price movements have shown significant fluctuations, with notable upward trends followed by periods of consolidation. Peaks in development activity specifically often coincide with or precede price increases. 

For instance, development activity surges in mid-February and mid-April correspond with price increases. Notably, SOL’s development activity and price are currently in an upward trend, indicating potential for further increases.

Screenshot 2024 07 19 at 105232
Santiment

It is important to also note that increased social volume typically aligns with higher price levels. As seen in Santiment’s chart, high social volume in mid-March and early May coincided with upward price movements.

Ultimately, positive sentiment peaks often precede price surges. High positive sentiment in late January and early April corresponded with price increases, reinforcing the bullish outlook if these metrics surge again.