Home Blog Page 1360

Bitcoin Now Rivals Visa and Mastercard, with $46.4B in Daily Payment Volume: CME Report

0

A report from CME Group suggests that Bitcoin now rivals payment giants Visa and Mastercard in volume, boasting a daily payment volume of $46.4 billion.

CME Group released the report today in collaboration with crypto analytics platform Glassnode. Calling attention to the article on X, Glassnode spotlighted the impressive feat achieved by Bitcoin (BTC) in terms of daily on-chain volume.

Further insights from the report, dubbed “Digital Assets: Insights and Market Trends,” shows a bullish trend across the market in H1 2024. These bullish trends come from data provided by Glassnode mostly as of May 31, 2024. Interestingly, data confirms that Bitcoin had increased 370% since January 2023 despite the recent downturn.

Bitcoin Volume Rivals Visa and Mastercard

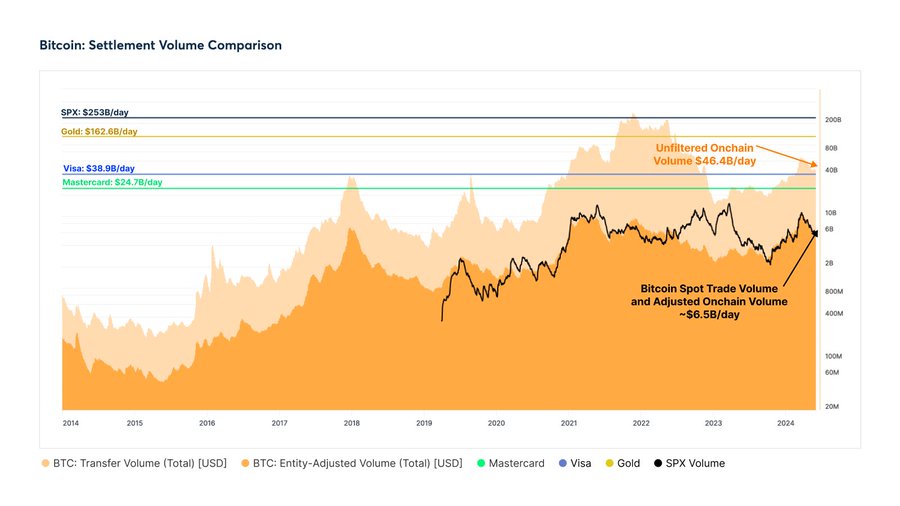
The report then called attention to Bitcoin’s on-chain payment volume. Per available data, unfiltered on-chain volume on the Bitcoin network hit as high as $46.4 billion every day. This figure rivals what is obtainable with payment processing giants like Visa and Mastercard.

For proper context, data from the report confirms that Visa processes a daily volume of $38.98 billion. Meanwhile, Mastercard boasts a much lower $24.78 billion in daily payment volume. Only gold and the S&P 500 (SPX) have significantly much higher daily volumes than Bitcoin, respectively amounting to $162.6 billion and $253 billion.
Bitcoin Settlement Volume Comparison Glassnode
Bitcoin Settlement Volume Comparison | Glassnode

Notably, CoinMarketCap data shows a similar figure for Bitcoin’s daily volume. 24-hour trading volume for Bitcoin has averaged $29.68 billion over the past nine days. Within this period, BTC saw the highest daily volume of $41.6 billion on July 16. Volume has been considerably higher in recent times amid the ongoing market rebound.

Bitcoin Daily Volume
Bitcoin Daily Volume | CoinMarketCap

However, Glassnode applied a filtering mechanism by assessing the economical nature of Bitcoin’s on-chain transaction volume. It also assessed in-house transfers from leading exchanges such as Binance and Coinbase. This filter resulted in an adjusted daily volume of $6.5 billion for Bitcoin.

Besides its volume, the CME Group report confirmed an influx of capital into the Bitcoin market in H1 2024. This increased influx is attributable to the successes of the spot Bitcoin ETFs in the United States. Data from Farside Investors shows that these products have seen $16.5 billion in net inflows since January. 
Solana Price overtakes Ethereum as Bull Traders Mount $2.1B Positions 

Solana price reached $163 on Wednesday, July 17, its highest in 40 days of trading, recent capital inflows into the SOL derivatives markets suggests more upside could follow. 

Solana Price Outperforms Market Average with 35% Rally

Solana has recently experienced notable price action driven by a combination of internal developments and external market factors. Over the past few weeks, Solana’s price has climbed significantly, reflecting growing investor confidence and the network’s ongoing advancements.

The first leg of the Solana market rally began in late June after news broke that two investment first, 3iQ capital in Canada and VanEck in the USA applied for spot SOL ETFs within their jurisdictions.  

While the rally was initially subdued, Solana bulls eventually gained a foothold over the weekend after the US authorities published dovish Non-Farm Payrolls and Consumer Price Index (CPI) data.

Solana Price Action 17 7 24
Solana Price Action  | SOL/USD | TradingView

Looking at the chart above, we see how solana price of solana has increased from $121 on Friday July 5, to reach a daily timeframe peak of $163.81 at the time of writing on July 17. This reflects a 35.40% rebound in Solana prices over the last 12 days of trading. 

While the rest of the crypto markets have been on an uptrend this week, thanks to dovish macroeconomic speculations, Solana appears to be a standout performer. For context, Ethereum price has witnessed only a 25% upswing in the last 12 days despite enjoying a much broader media coverage since it was announced that the ETH spot ETFs would now launch on July 23. 

With Solana outperforming Ethereum by nearly 10% over the past two weeks, it suggests the presence of vital internal bullish catalysts driving SOL prices. 

Solana Open Interest Crossed $2 Billion as Bulls Traders Seize Control. 

One of the primary internal catalysts for Solana’s recent price surge is the speculation that Ethereum ETFs listing could significantly increase the likelihood that Solana ETFs will follow suit in the long-run. Market data trends show that many strategic traders have moved to front-run gains from this positive narrative. 

In an indication of this, Coinglass’ Open Interest chart below tracks the real-time changes in the value of capital activity invested into Solana’s derivatives futures contracts. 

Solana Price vs SOL Open Interest TradingView
Solana Price vs. SOL Open Interest | TradingView 

Looking at the chart above, Solana open interest has now reached $2.2 billion at the time of publication on July 17. Notably this is the first time the Solana open interest has crossed the $2.2 billion threshold in 40-days dating back to June 7. 

A closer look at the data shows that Solana’s 35% price uptick over the last 12 days has far outpaced the growth in Open Interest, which has only increased by 22% during that period. 

When an asset’s open interest grows faster than its price, strategic investors may interpret it as a critical bullish signal for two main reasons. Firstly, it indicates increased participation and confidence in the asset’s future price movements, suggesting that more investors are opening new positions. This heightened activity often reflects positive sentiment and expectations of further price increases.

Secondly, higher open interest relative to price growth can signal that traders are willing to hold their positions longer, anticipating continued bullish momentum. This commitment to maintaining positions underlines a strong belief in the asset’s potential and will likely contribute to a sustained Solana price uptrend as buying pressure persists ahead of the Ethereum ETF launch scheduled for July 23. 

Solana Price Forecast: $180 is the Next Target

Looking at the chart above, Solana (SOL) is demonstrating a robust bullish momentum, with the price currently sitting at $159.44. The recent 35% price increase over the past 12 days, accompanied by an increase in open interest, indicates a strong buying interest and growing confidence among investors. Notably, the RSI (Relative Strength Index) is hovering around 60.01, signaling that while the asset is nearing overbought territory, there is still room for further upward movement before reaching critical levels.

One key resistance level to watch is at $154.82, which corresponds to the 0.236 Fibonacci retracement level. This level has been tested recently and broken, suggesting that Solana has the potential to continue its upward trajectory. 

If the bullish momentum persists, the next significant resistance to watch will be at the psychological level of $180. This level not only represents a round number resistance but is also likely to be a critical point where profit-taking could occur.

Solana Price Forecast SOL USD 17 7 24 Q
Solana Price Forecast | SOL/USD | TradingView

On the downside, the primary support level is located around $101.46, which aligns with the 0.786 Fibonacci retracement level. This level has provided strong support in the past and is likely to act as a safety net in case of a pullback. 

In summary, Solana’s recent market dynamics suggests a bullish outlook with the next target set at $180, and an immediate support buy-wall at $140. With the current technical indicators pointing towards continued upward movement and robust investor confidence reflected in the rising open interest, Solana is well-positioned for further gains.

Ethereum Foundation Deposits $12M+ ETH to Kraken as Market Rebounds

0

Ethereum Foundation wallets have transferred 3,631 ETH worth $12.5 million to Kraken as the market witnesses a rebound.

In a notable move during the recent market rebound, two Ethereum Foundation and ICO-related wallets transferred 3,631 ETH, valued at $12.5 million, to the Kraken exchange over the past two days.

Recent Transfers from Foundation-Linked Wallets

One wallet offloaded 2,631 ETH, equivalent to $9.01 million. This wallet received its ETH from both the Ethereum Foundation and an ICO participant. Since June 8, it has deposited a substantial 17,886 ETH, worth $65 million, to centralized exchanges. 

Another wallet transferred 1,000 ETH, valued at $3.46 million, to Kraken. This ETH originated from an ICO participant who received 100,000 ETH at the Ethereum genesis in 2015.

Despite these recent transactions, the Ethereum ICO participant still holds a reserve of 49,000 ETH, valued at $171 million, across four different wallets. 

Historical Context and Market Impact

Recall in January, the Ethereum Foundation was reported to have sold off 700 ETH through the Cow Protocol. The proceeds, approximately $1.68 million, were converted into DAI.

While the monetary equivalent seemed small, these sell-offs, coupled with bearish market sentiment, have contributed to a gradual downward pressure on Ethereum’s price. The digital currency experienced a 4.09% drop in the past 24 hours, bringing its seven-day cumulative loss to 6.72%.

The foundation’s recent transactions were executed through a specific wallet address. The Ethereum was sold at an average price of $2,406 across three sessions of 200 ETH transfers each, with an additional 100 ETH transfer completing the latest moves.

Additionally, in February, Ethereum Foundation transferred $13.3 million worth of ETH to Kraken. This move came as Ethereum’s price surged above $3,300, buoyed by Jim Cramer’s endorsement.

The surge allowed Ethereum to reclaim several key price levels, including the significant $3,300 mark. In response, the Ethereum Foundation, which supports the Ethereum ecosystem, moved 4,000 ETH to Kraken following this price increase.

US Presidential Candidate Trump to Release Fourth NFT Series

GOP presidential candidate Donald Trump has confirmed plans to unveil the fourth edition of his famous NFT series. 

In a Bloomberg interview, Trump boasted about the success of his previous collections, stating that they were highly favored and sold out quickly. Specifically, he mentioned that 45,000 cards were snatched up in just a day, a success he encountered with all three NFT endeavors.

Notably, following the release of the MugShot edition last December, the second series registered a 3,213% sales surge in one day.

Fans Are Demanding Trump’s Fourth NFT Collection

Trump attributed the demand for the fourth to his fans, saying they are eager for him to release another collection. He expressed delight with the enthusiastic response, describing it as a remarkable display of spirit.

Furthermore, the former U.S. president disclosed that almost all of the sales from his previous NFT collections were made in crypto. This experience gave him a new appreciation for digital currencies’ potential.

Trump Positioning US at the Fore of Crypto Advancement

As a result, he expressed his desire for the United States to take a leading role in developing the cryptocurrency industry. He likened the industry to a young child, still in its early stages, and emphasized the significance of the U.S. staying ahead of the curve. 

Trump warned that if the U.S. fails to take forward-thinking actions, China will likely become a dominant player in the industry.

Furthermore, Trump noted the shift in attitude towards cryptocurrency among banking executives, specifically mentioning Jamie Dimon, the CEO of JP Morgan. Trump observed that Dimon, previously outspoken in his criticism of crypto, has recently softened his stance.

Seven months ago, Dimon had testified before a Senate hearing that the “only” legitimate use case for crypto was for criminal activities and tax evasion, even going so far as to suggest that the government should shut it down. 

Meanwhile, despite Dimon’s vocal opposition to crypto, JPMorgan has its own native cryptocurrency, JPM Coin. BlackRock’s Larry Fink also recently admitted that he was wrong during his days of Bitcoin criticism, calling the asset digital gold and a legitimate financial instrument.

Trump’s latest hint about the coming of his fourth NFT collection comes as the crypto industry increasingly throws its support behind his reelection campaign.

Trump’s campaign endorsed crypto donations in May. Data from the Federal Election Commission (FEC) revealed that Trump’s election campaign raised approximately $331 million last quarter, of which around $3 million came from cryptocurrency donations. 

In a further indication of his growing affinity for crypto, Trump yesterday announced his choice for running mate: pro-Bitcoin Senator J.D. Vance.

Ethereum Price Analysis: Here’s the $700M Signal Driving ETH to $4k

Ethereum price topped out at $3,517 on Wednesday, July 17, 2024, marking a 25% rebound over the last 12 days of trading; on-chain data shows increased staking on the ETH 2.0 network could be a key bullish catalyst. 

Ethereum Price Spikes 25% Ahead of Expected ETF Launch on July 23

The anticipation surrounding the potential launch of an Ethereum ETF on July 23 has been a significant driver behind Ethereum’s recent price surge.

Further buoyed by the dovish macroeconomic indices in the recent Non-Farm Payrolls and Consumer Price Index (CPI) data, market sentiment surrounding ETH has turned overwhelmingly positive as investors look forward to increased institutional participation and Fed Rate cuts in H2 2024.

Ethereum Price Action ETH USD 14 7 24
Ethereum Price Action | ETH/USD | TradingView

The chart above shows how ETH price fell to a 100-day low of $2,815, during the market crash on July 5. But since the dovish NFP data, bulls traders entered a buying frenzy over the weekend pushing Ethereum price back above the $3,000 level.

However, on Monday, July 15, the Ethereum ETF’s impending launch on July 23 hit the newsreels. The bullish headwinds from the anticipated ETF inflows have put the Ethereum price rally into second gear this week.

At the time of writing on July 17, Ethereum’s price had broken above the $3,517 area, up 25% from the historic lows recorded on July 5. With the Ethereum ETF launch date still nearly a week away, speculators are betting on further upside toward the $4,000 range.

Ethereum ETH 2.0 Stakers have Deposited $700M in 7 Days

Another vital catalyst that has boosted the Ethereum price action in the last few days is the increased staking deposits lumped up by ETH investors. Since the Bloomberg analysts highlighted July 23 as a possible launch date, investors have increased the spate of deposits into the ETH 2.0 beacon chain staking contracts.

The chart below tracks the official data from Ethereum blockchain network, showing the daily changes in the number ETH coins deposited within the ETH 2.0 beacon chain contracts. Increased staking often occurs during periods where investors consider the effective yield more profitable than other alternatives, or when they are increasingly confident of the project’s growth trajectory.

Ethereum 20 Staking Deposits as of July 17 2024 Beaconchain
Ethereum 20 Staking Deposits as of July 17 2024, Beaconchain

As of July 10, investors staked a total of 32,919,270 ETH in the Ethereum 2.0 staking contract. But following back-to-back dovish NFP and CPI macroeconomic reports, as well as the announced ETH ETF launch data, Ethereum investors have reacted by increasing their staking deposits.

At the time of writing, the total staked funds have now reached 33,124,709 ETH, reflecting an increase of 205,439 ETH within the last seven days. Increased staking during a market uptrend is interpreted as a bullish signal for a number of reasons.

Firstly it signals that despite Ethereum prices climbing towards monthly-time frame peaks, majority investors are looking to staked more funds, and hold out for future gains rather than sell now. This decline in sell-side pressure could encourage indecisive new entrants to buy-in on the ETH rally in the days ahead.

More so, when the newly-staked 205,439 ETH is valued at the current prices, it means that investors effectively removed over $711 million worth of liquidity from the short-term market supply.

In essence, if investors keep cutting down selling pressure by adding more to the $700 Ethereum 2.0 staking deposits, ETH price is likely to advance further toward $4,000 as demand rises ahead of the ETF launch date slated for July 23.

In summary, the combination of heightened anticipation for an Ethereum ETF and the substantial increase in ETH 2.0 staking deposits are driving Ethereum’s price toward new highs.

FOX Business Reveals Bitcoin as Top Performing Asset with 315,678% Growth Since 2013

0

A FOX Business report spotlights Bitcoin as the top-performing mainstream asset since 2013, having recorded an impressive 315,678% within this timeframe.

Bitcoin continues to dominate the financial landscape as the top-performing asset, showcasing substantial growth rate. A recent report from Fox Business highlights that Bitcoin has surged by 315,678% since 2013, making it a peerless performer among mainstream risk assets. 

This remarkable ascent is attributed to Bitcoin’s inherent qualities of scarcity, utility, and global accessibility. Unlike fiat currencies, which are prone to inflationary pressures, Bitcoin’s deflationary model with a capped supply of 21 million coins has propelled its price higher over time.

Notably, as of today, Bitcoin’s price stands at $64,710, with a 24-hour trading volume of $35,902,216,478. This price represents a 1.37% increase in the last 24 hours and an 11.10% rise over the past week. 


The highest recorded price for Bitcoin is $73,737.94, which occurred in March 2024. Comparatively, today’s price is 12.21% lower than this all-time high. Conversely, the lowest price recorded for Bitcoin was $13 in January 2013. The current price reflects a 497,669% increase from that low.

Sector Performance and Bitcoin’s Dominance

Meanwhile, a recent analysis by Artemis reveals that the Bitcoin ecosystem outperformed all other cryptocurrency sectors over the past week, showing a 35.1% gain. In comparison, the AI sector gained 28.4%, and both DePIN and Store of Value sectors saw increases of 22.1%. 

Artemis
Artemis

Meanwhile, centralized exchanges and utilities and services had modest gains of 4.5% and 4.6%, respectively. Meme coins and gaming sectors also showed significant gains.

Bitcoin’s Role as Digital Gold

Interestingly, a recent analysis from Ali Martinez draws a compelling parallel between Bitcoin and gold, supporting Bitcoin’s role as “digital gold.” The comparison between historical gold prices and recent Bitcoin movements underscores Bitcoin’s potential as a store of value. 

Bitcoin’s decentralization and capped supply enhance its durability and scarcity, while its portability and divisibility surpass those of gold. These attributes make Bitcoin an attractive option for quick, cost-effective global transactions. As a hedge against inflation, Bitcoin’s limited supply and resistance to central bank policies bolster its appeal.

Two Bitcoin Addresses Holding 155 BTC, Worth Only $20K 10 Years Ago, Wake Up from Dormancy

0

As the broader crypto market shows signs of recovery, Whale Alert indexes the reawakening of two dormant Bitcoin addresses containing a combined 155 BTC. 

According to Whale Alert data, the first activation involves an 11.3-year-old dormant Bitcoin wallet that suddenly came out of hibernation yesterday. The wallet in question boasts a balance of 130 BTC, worth $8,423,540 ($8.42 million). 

Whale Alert disclosed that the 130 BTC tokens were worth $9,733 at the time they first made their way to the wallet in 2013. Fast forward to 11.3 years later, the value of the funds has skyrocketed tremendously to a whopping $8.42 million. This suggests that the wallet registered a return of 86,446% in less than 12 years. 

Another Dormant Wallet Awakens After 10.3 Years of Hibernation 

Furthermore, Whale Alert also alerted the public to a Bitcoin address that initiated a transaction for the first time since 2014. 

According to the whale-tracking resource, this address has been dormant for 10.3 years and only reawakened yesterday at 21:33 UTC. Prior to its reactivation, the address held 25 BTC, worth $1,619,912 ($1.61 million) at the time of Whale Alert’s tweet. This reflects a massive surge of 15,049% compared to their initial value of $10,693 as of 2014. 

Data from blockchain analytic platform Arkham Intelligence shows that the wallet’s owner transferred the entire 25 BTC to two addresses. Notably, 15 BTC were sent to an unknown address, while the remaining 10 BTC were moved to a wallet affiliated with the German crypto exchange Bitcoin.de. At press time, the formerly dormant address has a zero BTC balance. 

Increased Activation of Dormant Bitcoin Addresses 

The transactions are part of a broader trend involving the reawakening of dormant Bitcoin addresses in recent times. 

The Crypto Basic has reported a series of these transactions. This month alone, we spotted the reactivation of Bitcoin addresses that have been dormant for several years. In particular, a 12.4-year-old dormant wallet containing 119 BTC was activated on July 4. Five days later, another Bitcoin wallet with 48 BTC was reactivated after 13 years of dormancy. 

The continuous reactivation of these dormant Bitcoin addresses has triggered concerns among investors, who worry it may have a bearish impact on crypto prices. 

In the meantime, Bitcoin’s price is up 2.26% over the past 24 hours to $65,291. The top asset has also witnessed a double-digit gain of 13.05% in the weekly charts. 

BTCUSDT 2024 07 17 14 53 50
Bitcoin Daily Chart

XRP May Outperform Crypto Market to Hit $258 Amid MACD Flip and RSI Divergence

0

XRP shows potential for a rally as MACD flips and RSI divergence points to outperformance against the broader crypto market.

XRP has exhibited significant technical patterns that suggest potential outperformance against the broader cryptocurrency market. An analysis by Blockchain Backer, a prominent YouTuber, highlights a massive weekly bearish divergence for the broader crypto market against XRP at critical resistance levels. This technical setup has previously led to XRP outperforming in 2017 and 2021, hinting at a similar trajectory this time.

Resistance and Divergence Indicators

The analyst’s chart reveals that the broader crypto market has reached a critical resistance level against XRP, indicated by the black horizontal line. Historically, this resistance level has marked points where price movements face significant challenges.

The Relative Strength Index (RSI) demonstrates a massive weekly bearish divergence for the broader market against XRP. This divergence occurs when the market makes new highs, but the RSI forms lower highs, signaling weakening momentum. Such divergences often precede significant price corrections or trend reversals.

MACD and Historical Patterns

The Moving Average Convergence Divergence (MACD) has reached a historical extreme and flipped aggressively, as seen in the lower chart. This flip from bullish to bearish indicates a potential trend change for the broader market relative to XRP.

Historical patterns from 2017 and 2021, marked by green rectangles on the chart, show similar technical setups. In both instances, XRP experienced substantial price increases following these patterns. This historical context suggests that XRP might be poised for another period of outperformance if the current setup mirrors past trends.

Current Market Dynamics

The Stochastic RSI, which shows overbought conditions for the broader market, supports the potential for a short-term bearish reversal. However, these conditions often precede significant bullish runs for XRP once the market corrects.

Notably, during the bullish phase in 2017, XRP rose 43,000% from $0.0065 to $2.80. In 2021, it increased by around 791%, from $0.22 to $1.96. Based on the current price of $0.60, if XRP experiences a rise similar to 2017, it could reach approximately $258. If it follows the 2021 pattern, it might hit $5.35.

Market Commentary and Projections

Meanwhile, market commentator The3Antons suggests that XRP might be on the verge of flipping Ethereum. XRP’s recent 59% surge from $0.3823 to $0.6114 marks significant bullish momentum.

The3Antons highlighted a larger trend, the “Wealth Transfer,” benefiting XRP as it outperforms the market. His March forecast predicted a major XRP rally, potentially surpassing Ethereum in market capitalization.

Technical Analyst Says XRP $57 Price Prediction is Absurd

Zach Humphries, a prominent technical analyst in the crypto community, has denounced some of the widely touted XRP price predictions.

The market commentator reacted to reports citing another technical analyst, “XRP CAPTAIN,” who boldly asserted that $57 would be the minimum value for XRP in this bull run. 

This audacious outlook was founded on optimism about XRP attracting fresh adoption and utility after the Ripple lawsuit ends. XRP CAPTAIN expressed confidence that XRP will not miss this bull run. Moreover, he stated that those who would part ways with the asset at $10 would miss out on potentially higher targets, with $57 being his minimum.

Interestingly, other well-known ambitious analysts, like JayDee, endorsed this view. JayDee went on to say he anticipates much higher targets than $57. However, market watcher Humphries finds these outlooks absurd and out of reality.

In a post on X, Humphries noted that while he is convinced in XRP’s long-term prospects, he finds the widespread projections of $50 to $100 outlandish. He noted that such price growth bears extraordinary implications that the proponents are overlooking. 

Why XRP $57 Price Prediction is “Absurd”

For instance, with XRP now trading above $0.6, attaining $57 requires a substantial growth of 9,400%. Some individuals even hope for a $10,000 price point for XRP, which would demand over 1,800,000% growth.

Humphries stressed that this percentage growth is improbable for a crypto asset that already commands a valuation exceeding $33 billion.

To illustrate, a $57 value would hypothetically elevate XRP’s market cap to over $5.6 trillion, nearly twice Apple’s current valuation. For context, Bitcoin’s market cap is around $1.36 trillion. A proportionate growth could theoretically push the premier cryptocurrency to a valuation exceeding $100 trillion.

Essentially, this significant market cap implication has been a key point for critics who argue that ambitious XRP enthusiasts’ predictions of prices above $50 are unrealistic, at least in the near future.

Meanwhile, some community pundits have suggested $5 to $10 remains a more realistic outlook for XRP. 

For instance, Web3Alert founder Nick argued that XRP reaching $10 this season “is not crazy” because it would put XRP’s market cap at $550 billion or a fully diluted valuation of $1 trillion, which is comparable to the valuations of Bitcoin and Ethereum.

XRP Pumps Heavily in 60% Spike, Do Insiders Know What’s Coming

XRP is now sparking a significant sensation in the crypto community by reclaiming the long-lost $0.6 threshold after growing by 11% in the last 24 hours.

Over the past week, XRP has soared by an impressive 38.10%. Although it is not a solitary bull run, the broader market is bullish. However, XRP is currently outperforming the market.

XRP Pumping Heavily

Among the ranking assets with billion-dollar valuations, XRP stands at the top with the most substantial seven-day price gain, a rare feat for the asset mostly known for underperformance.

At press time, XRP has established a new four-month high above $0.61. Considering this asset was worth around $0.38 just 12 days ago, this implies that XRP has rebounded by 60% in less than two weeks.

This incredible turnaround has continued to spark discussion in the crypto community about what influences the price gain.

Do Insiders Know Something?

Crypto commentator Alex Cobb has suggested that XRP’s sudden rise may be indicative of insiders having knowledge of an impending development. This sentiment is widely shared among community members. Even the Singaporean exchange Bitrue has echoed a similar perspective.

Indeed, XRP is amid crucial impending developments that are potent enough to influence positive market sentiment.

Foremost among these is the highly anticipated settlement announcement in the ongoing Ripple and SEC lawsuit, as well as the judge’s final ruling in the case.

In recent weeks, Ripple and the SEC have engaged in a heated dispute over the appropriate fine for Ripple’s violation of securities laws. While the SEC is seeking a penalty of $2 billion, Ripple believes a $10 million fine is more suitable. 

Both parties’ arguments are currently before District Court Judge Analisa Torres. According to legal experts, a final judgment from Judge Torres may emerge by July 31. Ripple and the XRP community anticipate a favorable outcome.

Notably, the impending resolution of the Ripple and SEC lawsuit could be a significant catalyst for XRP’s growth. Once the lawsuit ends, it will likely eradicate all perceived regulatory uncertainties surrounding XRP, potentially unlocking the asset’s full potential.

This could enable XRP to capitalize on the current bull run, making up for lost ground after missing out on the 2021 bull run due to the ongoing SEC suit.

Moreover, this development will further open the door for an XRP ETF to launch in the U.S. Ripple CEO Brad Garlinghouse has said in numerous interviews that an XRP ETF is inevitable. Supporting the bold view is that XRP has regulatory clarity and is among the most prominent crypto assets, making it deserving of an ETF.