Home Blog Page 1362

Bitcoin Price Analysis: Here’s Why BTC Surged 15% in 4-Days

Bitcoin price surged to a peak of $65,007 on July 16, 2024, marking a 15% increase within the last four trading, market data trends highlight the main catalysts behind the renewed bullish momentum.

Bitcoin ETFs Invest $515M as ETH ETFs Launch Nears

One of the primary drivers behind Bitcoin’s recent rally has been the anticipation of Ethereum ETFs launching in the U.S. next week. This development is expected to enhance institutional interest and confidence in the broader cryptocurrency market, indirectly benefiting Bitcoin as the market leader. 

According to Bloomberg, the Ethereum ETFs are now due to launch on July 23, with several major asset managers, including BlackRock and VanEck, as front-runners. 

Bitcoin ETFs BTC Holdings 16 7 24
Bitcoin ETFs BTC Holdings, July 16, 2024 | TheBlock

In response to the green light from the US SEC regarding Ethereum ETFs’ impending launch date, the Bitcoin counterparts have attracted increased demand over the past week. The chart above shows that the active Bitcoin ETFs currently held a cumulative balance of 870,700 BTC during the market dip on July 5. 

But at the time of writing on July 16, the Bitcoin ETFs holdings had reached 878,830 BTC. This reflects that the Bitcoin ETFs have acquired an additional 8,100 BTC worth approximately $515 million within the last 10 days alone. 

This affirms that stance Bitcoin ETFs are increasing their demand for BTC as the Ethereum ETF launch date draws closer. If this market trend persists in the coming days, Bitcoin price could continue on its current upward trajectory towards $70,000. 

Moreover, the positive shift in the US macroeconomic environment has also played a crucial role in bolstering Bitcoin’s ongoing price rally. The latest Non-Farm Payroll (NFP) data exceeded expectations, indicating a strong job market and economic resilience.

Additionally, the recent Consumer Price Index (CPI) data revealed a slower-than-expected rise in inflation, which has alleviated concerns about aggressive monetary tightening by the Federal Reserve. 

Both indicators signaling lower inflation pressures suggest that the US Fed may now take a more likely to cut interest rates which would create a favorable environment for risk-on assets like Bitcoin.

Bitcoin Price Forecast: Rocky Road to $70k

Bitcoin’s recent bullish momentum has been impressive, with the price peaking at $65,007 on July 16, 2024. This 15% surge over the past four days highlights the strong buying interest in the market. The technical indicators in the chart suggest that Bitcoin might continue its upward trajectory, albeit with some volatility.

The Chande Momentum Oscillator (ChandeMO) has risen sharply to 71.52, indicating strong bullish momentum. This uptick reflects increasing buying pressure and a potential continuation of the upward trend. 

The Average True Range (ATR) stands at 2,431.53, signaling heightened volatility, which is typical during periods of strong price movements. This suggests that while Bitcoin may face some fluctuations, the overall trend remains bullish.

Bitcoin Price Forecast 16 7 24
Bitcoin Price Forecast (BTC/USD) | TradingView

Within the current dynamics, the immediate support level is around $62,000, which has held firm during the initial consolidation phase on Tuesday morning. 

This level will be critical for maintaining the bullish momentum. On the upside, the first resistance level is at $68,000, with a more significant barrier at the psychological $70,000 mark. Breaking through these resistance levels would pave the way for new all-time highs.

Given the current market dynamics, Bitcoin’s journey to $70,000 appears promising, though not without challenges. Investors should monitor the support levels closely and watch for any signs of weakness.

If Bitcoin manages to sustain its momentum and break through the $68,000 resistance, $70,000 could be reached. However, the heightened ATR suggests intense volatility ahead.
Solana W Pattern Could Propel SOL Price to $174, Liquidating $2.98 Billion in Short Positions

0

Ali Martinez predicts a bullish future for Solana, highlighting a “W” pattern that suggests a price surge to new heights and potential short liquidations.

Ali Martinez, a seasoned analyst, has recently taken to X (formerly Twitter) to discuss Solana’s (SOL) potential price movement. His analysis highlights a “W” pattern on Solana’s chart, suggesting a significant bullish reversal.

Martinez points out that the “W” pattern, also known as a double bottom, indicates a bullish trend towards a target of $174. The first bottom occurred on June 24, at around $122, followed by a peak in early July at $155, and the second bottom around July 5. The price has recently broken above the resistance formed by the peak between the two bottoms. 

Liquidation Potential at $176

However, in another analysis, Martinez highlighted the potential for substantial liquidations if Solana’s price reaches $176. The provided heatmap shows a significant concentration of $2.98 billion in short positions that will be forced to liquidate at this level. 

Solana Liquidations 16 7 24
Solana Liquidations

This liquidation event could create a short squeeze, driving the price higher as short sellers buy back the asset to cover their positions. The data from July 3 indicates that at a price of $175.989, the liquidation leverage was approximately $2.98 billion.

Raoul Pal’s Bullish Projections for Solana

In a previous analysis, Raoul Pal, CEO of Real Vision Group, shared Martinez’s optimistic outlook. Pal envisioned Solana’s price to rise significantly, projecting it to reach between $800 and $1,200 during a complete bubble cycle, potentially even surpassing $2,000. In a shorter market cycle, he estimates the price could hit around $750.

Pal’s confidence in Solana’s future is bolstered by its new validator, Fire Dancer, which can process one million transactions per second. 

Today, Solana’s price is $156, with a 24-hour trading volume of $3,389,390,159. This marks a 2.61% increase in the last 24 hours and an 11.21% increase over the past 7 days. Solana’s market cap stands at $72,441,249,341.

Stripe Now Allows Bitcoin Purchases for EU Customers

Global payment processor Stripe has broadened its crypto integration to the European market, enabling customers to purchase Bitcoin and other crypto assets using their cards.

As reported by the Irish Independent today, customers within the European Union can now use their Stripe cards to buy a range of cryptocurrencies, including Bitcoin, Ethereum, and Solana.

Stripe Supporting Bitcoin and Crypto Purchase for EU Merchants

Furthermore, the report noted that Stripe now allows online merchants to integrate a crypto-purchasing widget onto their websites. This will streamline the process by handling charges, disputes, and KYC requirements.

Moreover, the Irish Independent cited Stripe’s head of crypto, John Egan, who emphasized that this expansion enables crypto companies to provide European consumers with a fast and easy way to purchase Bitcoin. 

Egan explained that merchants can now tap into a broader global audience by leveraging Stripe’s onramp, which includes features like identity verification and fraud prevention. This allows them to focus on driving business growth and delivering exceptional customer experiences.

Notably, the expansion is initially targeted at vendors and crypto marketplaces. It builds on Stripe’s new support of stablecoin payments for conversion and transaction settlements.

Coinbase and Stripe joined forces in June to bring faster financial infrastructure to millions of businesses globally through the Base network. The partnership enabled Stripe to offer more affordable money transfers to over 150 countries using stablecoin USDC on Base.

Notably, Stripe boasts a vast customer base of major e-commerce companies worldwide. In its latest financial report, the company reported processing over $1 trillion in payment transactions in 2023. The figure marked a 25% increase from the previous year.

Yesterday, Stripe’s valuation reportedly surged to $70 billion after Sequoia Capital, one of Silicon Valley’s most prominent venture capital investors, consented to acquire $861 million in private shares from other investors.

Stripe’s Well-timed Crypto Expansion to Europe

Stripe’s latest crypto expansion to the European market comes amid the region emerging as a global leader in crypto adoption and growth. According to a recent report by CoinWire, Europe dominates the global crypto market, accounting for 37.32% of global transaction value.

The report predicts that Europe’s crypto trading volume will soar 270% to reach $40.5 trillion this year, compared to $15 trillion in 2022. Interestingly, the EU also recently implemented the first phase of its MiCA regulation, focusing on stablecoins.

SEC Pushes Ethereum Spot ETFs Forward Targeting July 23 Launch Date

0

SEC asks issuers to submit final S-1 forms by Wednesday, aiming for a July 23 launch of Ethereum spot ETFs from asset managers such as BlackRock and VanEck.

Eric Balchunas, Senior ETF Analyst for Bloomberg, disclosed on X that the SEC has asked issuers to submit their final S-1 forms by Wednesday. 

Provided there are no last-minute issues, the request for effectiveness will be made after Monday’s close, targeting a launch on Tuesday, July 23. This update coincides with earlier predictions from President of the ETF Store, Nate Geraci, who anticipated this week would see the approval of spot Ethereum ETFs.

Initial Approval and Industry Impact

Notably, the SEC has already given initial approval to spot-based Ethereum ETFs from BlackRock, Franklin Templeton, and VanEck. Additionally, Grayscale, Bitwise, ARK 21Shares, Invesco Galaxy, and Fidelity could be preparing to launch their products soon. 

The final approval would allow investors to gain exposure to Ethereum without directly owning the cryptocurrency, providing a regulated and potentially profitable investment avenue. As the second-largest cryptocurrency by market capitalization, Ethereum stands to benefit significantly from this development.

Analysts’ Predictions and Historical Context

In June, Consensys’ Jimmy Ragosa predicted that the SEC might soon approve the S-1 documents for Ethereum spot-based ETFs. His prediction followed Bitwise’s amended Ethereum ETF S-1 document submission on June 18, which included updated risk factors, legal statements, contact information, and distribution plans.

Ragosa suggested that if these updates were the only SEC comments, a final approval could be imminent, potentially sparking an Ethereum rally similar to the uptrend recorded after the approval of the 19b-4 filings in May.

It is crucial to note that market analyst Miles Deutscher earlier forecasted that Ethereum could surge to $6,446 by July 23 if a spot ETH ETF product is approved.

Drawing parallels with Bitcoin’s historical performance post-ETF approval, Deutscher noted that Bitcoin experienced a notable 75% rally over 63 days following its ETF approval. This historical trend suggests the possibility of a similar trajectory for Ethereum’s price, assuming spot ETH ETF approval goes through.

Currently, Ethereum is trading at $3,410, reflecting a 1.45% increase in the last 24 hours and a 23.37% increase over the past week.

Market Veteran Sees This Altcoin Surging 300% Amid Bull Flag Pattern

0

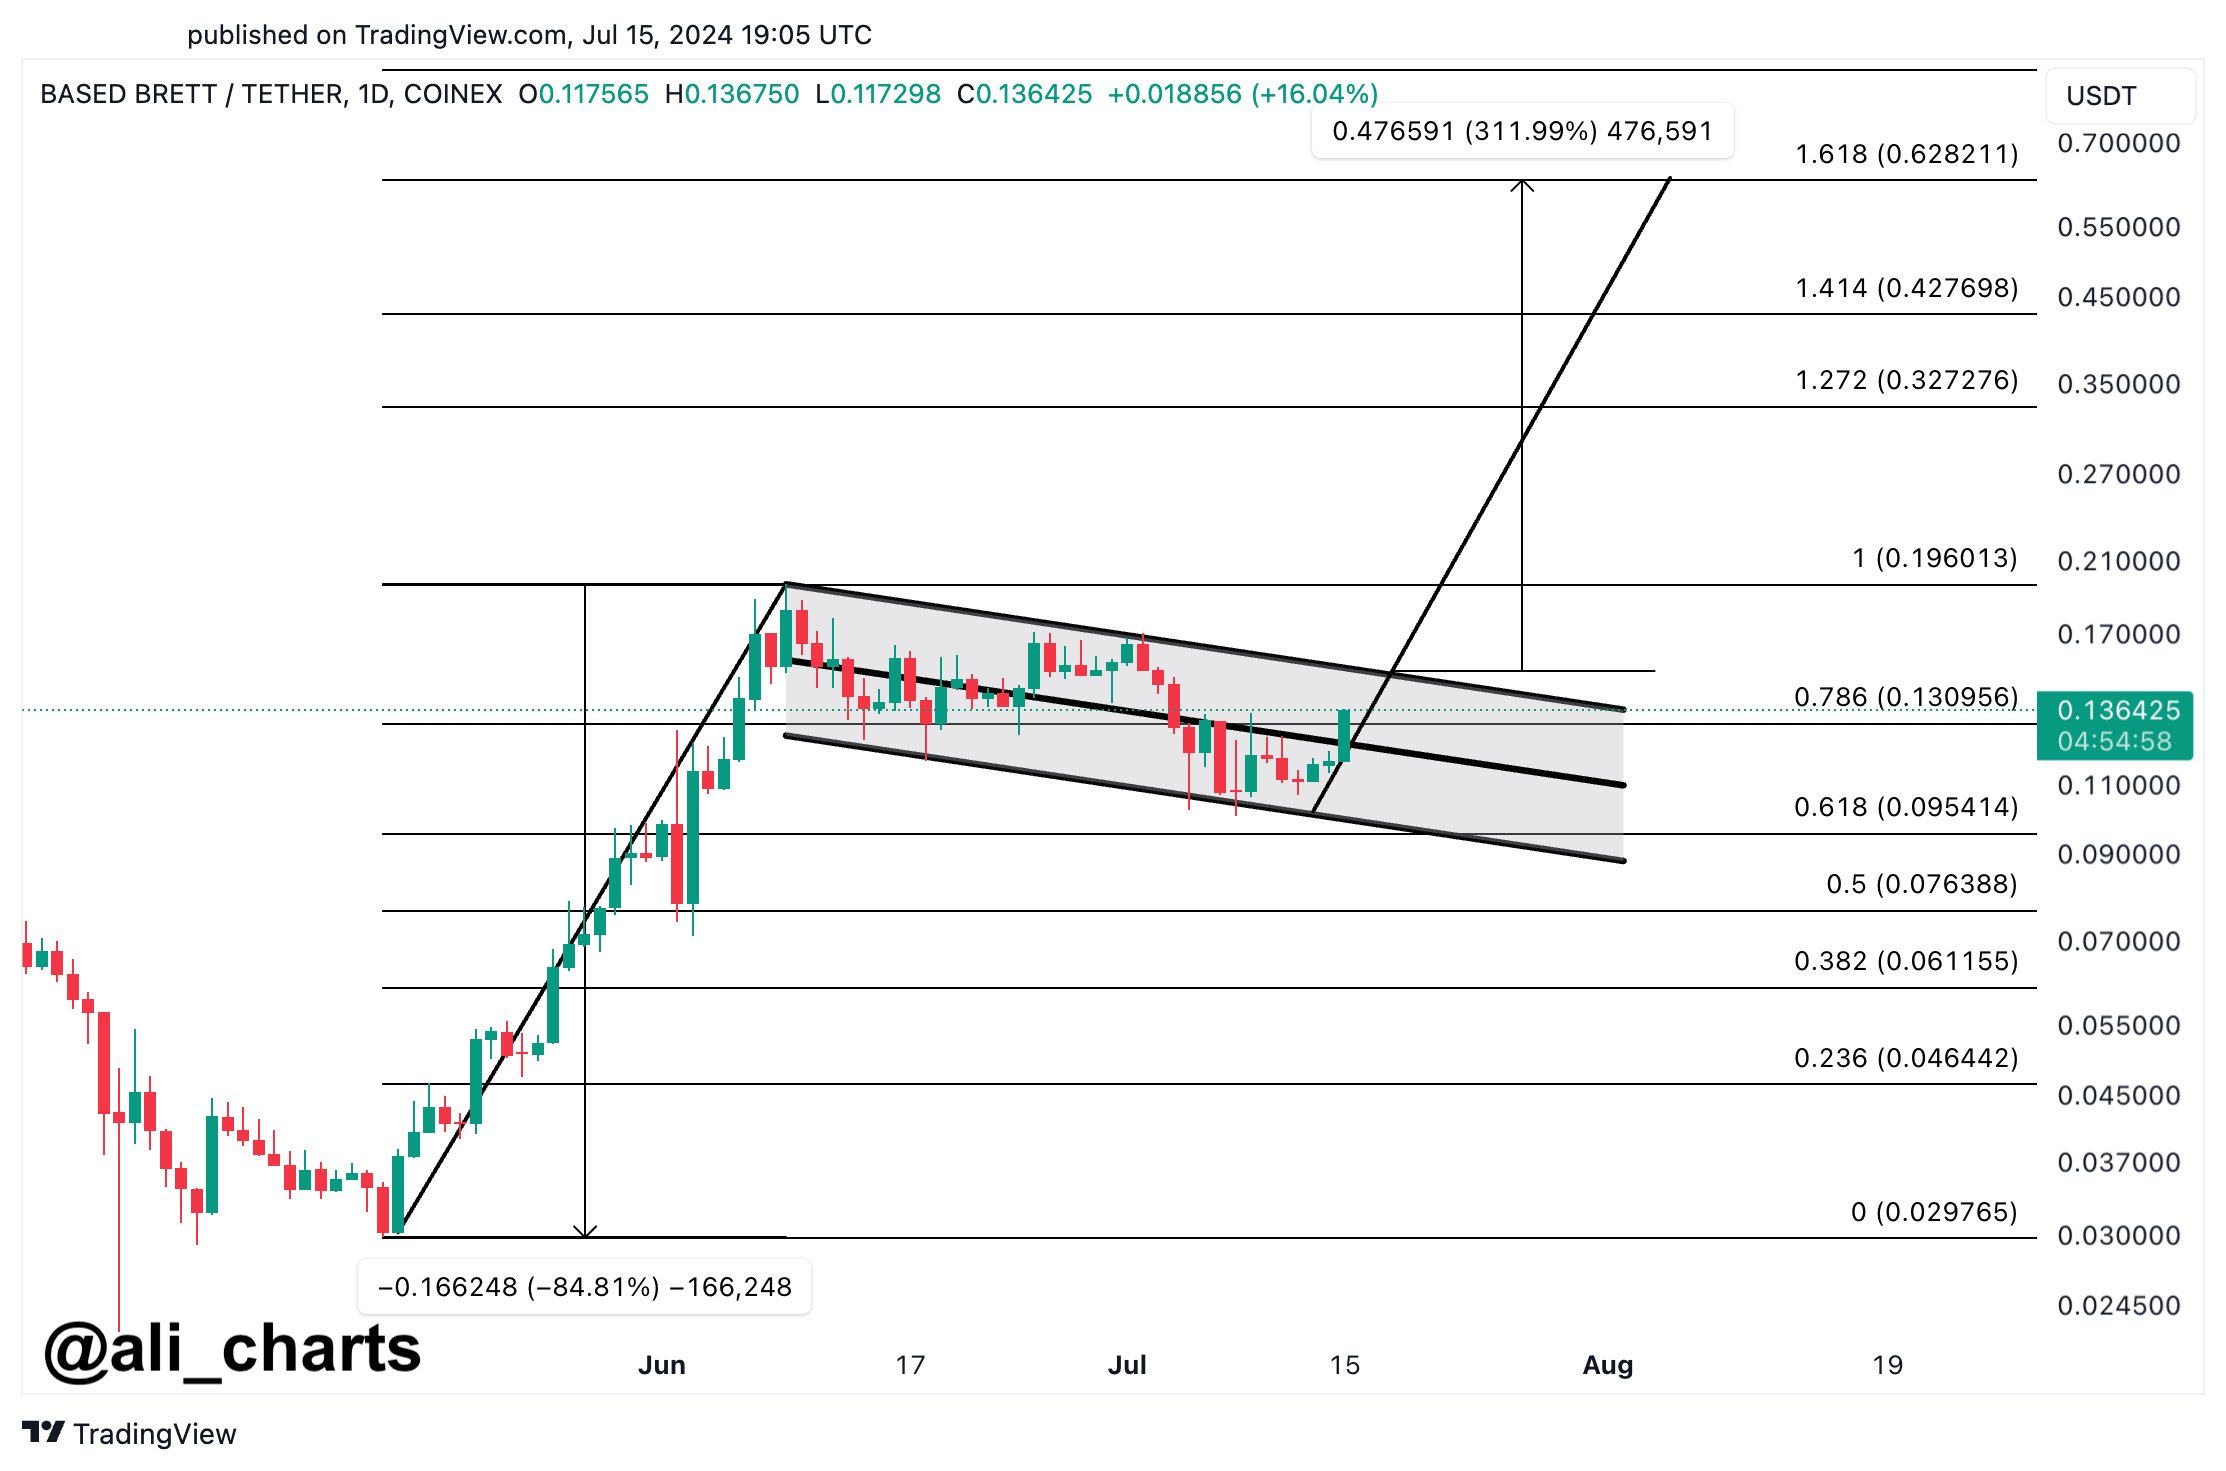
Veteran analyst Ali Martinez identifies a bull flag setup in the BRETT/USDT pair, predicting a potential surge of 300% that could push the price to a new all-time high. 

Martinez’s analysis comes as BRETT looks to ride on the ongoing market rebound to reclaim lost grounds. The meme coin has recouped some losses amid a 20.57% spike yesterday but remains 30% below its ATH. Martinez cited a bull flag pattern forming on the BRETT daily chart as the basis for his conviction.

Bull Flag Could Lead to New ATH at $0.63

The bull flag pattern is a strong bullish continuation signal. It consists of two parts: a sharp upward move (flagpole) and a consolidation period with downward-sloping trendlines (flag). 

In BRETT’s case, the flagpole formed during a steep rise from mid-May to early June. On the other hand, the flag comprises a downward-sloping channel formed from mid-June till now. This channel is due to a massive correction from the June highs.

BRETT Bull Flag Ali Martinez
BRETT Bull Flag | Ali Martinez

According to Martinez, BRETT could experience significant price movement if it sustains a close above $0.15. He suggests that this breakout could propel BRETT to a new all-time high of $0.63, representing a 300% increase from current prices.

Martinez’s chart shows several key Fibonacci retracement and extension levels, crucial for identifying potential support and resistance areas. Notably, these levels range from lower levels, such as $0.046442 and $0.061155, to higher critical points like $0.130956 and $0.196013. 

The potential price targets based on Fibonacci extensions suggest that if the bull flag pattern plays out, BRETT could reach levels around $0.327276. Other targets include $0.427698 and even $0.628211. Martinez believes a breakout above $0.15 would be a critical indicator of future price movement. Such a breakout would confirm the bull flag pattern.

BRETT Current Market Conditions

Meanwhile, BRETT currently trades for $0.13880 at the reporting time. The current price action is supported by various technical indicators, including the Ichimoku Cloud and the Aroon Indicator. 

The Ichimoku Cloud helps gauge momentum and trend direction. Key components for BRETT include the Conversion Line (Tenkan-sen) at $0.13576, the Base Line (Kijun-sen) at $0.13880, and the Leading Span A (Senkou Span A) and B (Senkou Span B) respectively at $0.13037 and $0.13006. 

BRETT Daily Chart
BRETT Daily Chart

BRETT is trading near the Base Line (Kijun-sen), indicating a neutral position within the Ichimoku Cloud. A break above the cloud could signal a bullish trend continuation, aligning with Martinez’s bullish outlook.

Also, the Aroon Indicator shows an Aroon Up reading of 0.00% and an Aroon Down reading of 42.86%. The Aroon Up indicates how many days since a 25-day high. Meanwhile, the Aroon Down measures days since a 25-day low. The current reading suggests a bearish trend, as the Aroon Down is significantly higher than the Aroon Up.

Mt. Gox Sends 48,641 Bitcoin to Kraken for Distribution: Details

0

U.S.-based crypto exchange Kraken confirms that it has successfully received funds in the form of Bitcoin (BTC) and Bitcoin Cash (BCH) from Mt. Gox Trustee. 

The leading exchange announced this in an email to users affected by the Mt. Gox debacle. Despite noting that it aims to distribute the funds to victims quickly, Kraken said it may take between 7 and 14 days for the funds to be credited to users’ accounts. 

According to the exchange, Mt. Gox Trustee determined how much BTC and BCH each user will receive. 

“We will distribute the funds according to their [Mt. Gox Trustee] instructions,” Kraken remarked. 

Kraken’s email, which went viral on X today, did not specify the total funds the exchange received from Mt. Gox Trustee. 

On-Chain Data Confirms Kraken Received 48,641 BTC 

Data from Arkham Intelligence revealed that the Trustee sent 48,641 BTC ($3.10 billion) to a wallet associated with Kraken today at 08:42 AM (UTC). 

The funds have remained untouched in the hours leading up to press time. It remains unknown Kraken received.

After the transaction, Mt. Gox Trustee shifted the remaining funds to two different wallets, totaling 43,114 BTC ($2.74 billion). According to Arkham Intelligence data, the first wallet, 18vjn…Dct9b, currently holds 42,587 BTC, while the other address, 1HRAp…Pv3b2, holds 526.952 BTC.

Over 13,000 Mt. Gox Creditors Receive Payments 

Besides Kraken, there are multiple exchanges supporting Mt. Gox repayments. Some of these platforms include SBI VC Trade and Bitbank. Earlier this month, Bitbank received 1,544.67 BTC in its hot wallet from Mt. Gox Trustee and immediately credited users’ accounts in hours.  

In a statement today, Mt. Gox Trustee confirmed that it made repayments in BTC and BCH to designated exchanges tasked with the responsibility of distributing funds to creditors. It emphasized that over 13,000 creditors have received funds so far. 

The Trustee noted that repayments to the remaining creditors will be processed upon the fulfillment of certain conditions, including finalizing repayment conditions and confirmation of account validity. 

Meanwhile, the recent repayment did not take a major toll on Bitcoin’s price as expected. The asset surged to a daily high of nearly $65,000 and plunged to around $62,900 shortly after the news broke out. Interestingly, Bitcoin has recovered some of its losses as it currently trades at $63,923, reflecting a 24-hour gain of 1.85%. 

Cardano (ADA) Price Surges 40% as $240M TVL and Ethereum ETFs Emerge Bullish Catalysts 

Cardano (ADA) has experienced a significant price surge, trading at $0.44, up 40% over the last ten days, fueled by several internal and external factors that are generating renewed investor interest and optimism.

Cardano Price Crosses $0.45 First Time in 10-Days 

After having dropped to historic lows on Friday July 5, a positive shift in the US macroeconomic environment has provided a favorable backdrop for ADA’s recent rebound phase.  Positive Non-Farm Payroll (NFP) and Consumer Price Index (CPI) data have bolstered investor confidence in the economic outlook, supporting the overall cryptocurrency market. 

Cardano Price Action ADA USD TradingView 16 7 24
Cardano Price Action (ADA/USD) | TradingView

Furthermore, the anticipation of Ethereum ETFs expected to launch soon has spilled over into the altcoin market, including Cardano, as investors look for promising opportunities beyond Bitcoin and Ethereum​​.

The chart above shows how ADA price had slid to a 2024 bottom of $0.32 on July 5. But following the recent dovish macroeconomic reports, bulls have returned to the ADA markets with intensity. 

On Tuesday July 16, ADA price briefly retested the $0.45 territory, marking 40% rebound over the last 10 days of trading. While Cardano price uptrend has mirrored the broader crypto market, on-chain data shows some internal bullish catalysts are also in play. 

Cardano TVL Hits $240 Million Amid Market Rally 

One of the key drivers of this price increase is the growing Total Value Locked (TVL) within Cardano’s decentralized finance (DeFi) ecosystem. According to DeFiLlama, TVL has risen dramatically, starting the year under 200 million ADA and now exceeding 682 million ADA. 

Projects like the collateralized debt protocol Indigo and the decentralized exchange Minswap have both surpassed $50 million in TVL, reflecting robust adoption and engagement​​.

Cardano Total Value Locked 16 7 24
Cardano Total Value Locked (TVL), July 2024 | DeFiLlama

Valued at the current prices, the total value of assets deposited on the Cardano blockchain network has now crossed $240 million for the first time in 3-weeks. Typically, an increase in TVL is often considered a major bullish signal for the native token for a few reasons. 

Firstly, Cardano’s TVL surge is a prime indicator that daily active addresses and transaction volumes have risen, indicating strong network engagement. Secondly, it also indicates cooling selling pressure as more tokens are being locked up. This declining market supply could further accelerate ADA price rally, if the bulls remain in the driving seat. 

Cardano Price Forecast: $0.50 Target in Sight

Cardano (ADA) has seen a notable bullish trend, trading at $0.43 after a 40% increase over the last 11 days. This upward momentum is reflected in the strong performance of key technical indicators, suggesting that the cryptocurrency could soon test the $0.50 resistance level.

The daily chart shows a robust uptrend as ADA has managed to climb from a recent low of $0.31 to its current price, supported by a positive Accumulation/Distribution Line (ADL).

This indicator suggests a steady inflow of capital into ADA, highlighting growing investor confidence. The Parabolic SAR (Stop and Reverse) dots are well below the current price, indicating a sustained upward trend and providing a near-term support level around $0.35.

Cardano Price Forecast q 16 7 24
Cardano Price Forecast (ADA/USD) | TradingView

The Relative Strength Index (RSI) is also in a favorable position, currently at 56.36, which is just below the overbought territory. This suggests that there is still room for further price appreciation before ADA becomes overextended. The recent price action has seen ADA consolidate its gains around the $0.43 mark, creating a strong base for a potential breakout.

If ADA manages to clear the immediate resistance at $0.45, the next target would be $0.50. Beyond this level, the Fibonacci extension tool points to a potential rally towards $0.55, which could be a significant milestone for Cardano. Conversely, if the price retraces, strong support is likely to be found at $0.40 and $0.35, ensuring that any pullbacks are quickly contained. 

Forbes Identifies Top 10 Best Performing Altcoins of 2024

Leading global magazine Forbes has identified ten crypto assets pulling the best performances in the crypto scene, defeating Bitcoin so far this year.

In a recent publication, Forbes explored the crypto market and discovered that meme-inspired crypto assets are top investment instruments delivering the best returns for investors in the first half of 2024.

Crypto Market Sees $661B in First Half

The report disclosed that the crypto market received fresh capital totaling $661 billion in the first half of 2024. Interestingly, Bitcoin alone attracted 61% of of that figure, amounting to over $409 billion.

Notably, the massive influx of $661 billion in the market was influenced by the launch of inaugural crypto spot ETFs in the U.S. Consequently, Bitcoin broke multiple records, setting a new all-time high above $73K several weeks before its 2024 halving event.

Presently, Bitcoin costs $63,220 per coin, reflecting a year-to-date gain of 49.53%. Its closest rival, Ethereum, boasts a similar percentage return. 

Meme Coins More Profitable Than Bitcoin

Meanwhile, Forbes confirmed that Bitcoin’s impressive surge was eclipsed by the performances of several meme tokens with minimal inherent value. These tokens fluctuated wildly in Q1 as social media-driven traders trooped into the market.

Among the billion-dollar-valued meme coins outperforming Bitcoin this year was the Solana-based Dogwifhat (WIF) token. Trading at $2.17, WIF posts an astonishing YTD yield of 1,322% despite its value crashing by over 16% in the last 90 days.

Another standout performer in the year’s first half is PEPE, a token inspired by the frog-themed internet meme of the same name. With a current trading price of $0.00001192, Pepe has seen its value skyrocket by over 820%, even reaching a new ATH.

The most prominent BNB Chain meme coin, Floki, followed closely with over 425% gain this year, similarly outperforming Bitcoin.

Best perfoming meme coins
Best performing meme coins

Seven Other Crypto Assets That Outperformed Bitcoin

Several other crypto assets within and outside the meme coin space have also outpaced Bitcoin’s gains. 

Notable examples include Artificial Superintelligence Alliance (FET), which has risen 101%; JasmyCoin, with a 343% increase; Toncoin, up 22%; Arweave (AR), which has surged 185%; Core, with a 152% gain; Bitget (BGB), up 85%; and Bonk, which has seen a 95% increase.

XRP Price Surges 35% Amid Increased Sentiments as Investors Show FOMO

0

XRP price witnesses a remarkable 35% spike in eight days, triggering increased weighted sentiments as investors give in to FOMO.

A recent market analysis by Santiment, a market intelligence platform, highlights significant developments in the crypto market, particularly around XRP.

As the market continues its upward trend, XRP exhibits notable sentiment and price movements, reflecting investor behavior and market dynamics.

Rising Sentiment vs Price Movements

According to the latest data, XRP has seen a substantial increase in weighted sentiment. Over the past eight days, this metric has seen a dramatic surge, indicating a strong positive outlook among investors. 

This rise in sentiment comes alongside an upward price trend. The correlation between rising sentiment and price suggests that investor enthusiasm is driving XRP’s recent performance.

The highlighted chart areas show significant spikes in both sentiment and price, pointing to potential FOMO (Fear of Missing Out) among investors.

Investors are becoming more optimistic, leading to higher trading activity. This euphoria can drive prices up further in the short term as more investors buy in, fearing they might miss out on potential gains.

However, such euphoric phases often carry risks. High levels of euphoria can lead to increased market volatility, and sudden shifts in sentiment can result in sharp price corrections. 

Euphoria Around Litecoin Too

According to Santiment, Litecoin is also experiencing a notable surge in both price and sentiment. Over the past 7 days, Litecoin’s price has increased by 8.6% from its recent bottom.

This surge is driven by positive sentiment and FOMO, similar to XRP’s trend. In addition, like XRP, the heightened euphoria around Litecoin suggests potential volatility. Investors should be prepared for sudden market shifts that could impact their positions.

Hypothetical Path to Double-Digit XRP Price

Meanwhile, XRP’s network growth shows fluctuations, with spikes indicating new address creations and an influx of new participants.

Trading volume for XRP has also increased, correlating with price movements and indicating high market activity. This upward trend in network growth, volume, and price suggests potential for further gains but also poses a risk of increased volatility.

Source Santiment
Santiment

Currently, XRP has set a new monthly high at $0.5682, with significant trading volume reflecting increased market participation.

Expert Predicts Bitcoin Surge to $100K Amid Trump’s Pro-Crypto Push

0

Todd Gordon predicts Bitcoin could hit $100K as Trump’s pro-crypto stance boosts Bitcoin and related stocks.

According to Todd Gordon, founder of Inside Edge Capital and CNBC contributor, former U.S. President Donald Trump is positioning himself as the pro-crypto candidate in the upcoming election.

This move has triggered multiple reactions in the crypto market, with Bitcoin leading the charge. As Trump rises in polls and prediction markets, crypto enthusiasts are noticing a correlation with Bitcoin’s upward trajectory.

Bitcoin’s price has seen a notable increase, reaching $63,217 today, up 0.66% in the last 24 hours and 9.86% over the past week. 

Source CoinGecko
CoinGecko

Alongside Bitcoin, crypto-related stocks like Coinbase, MicroStrategy, Riot Platforms, and Marathon Digital have also experienced gains. Investors and traders are capitalizing on these trends, viewing Bitcoin as potentially linked to Trump’s political fortunes.

Expert Insights on Bitcoin’s Chart

Todd Gordon shared his analysis on Bitcoin’s performance on CNBC’s Last Call. He highlighted that Bitcoin’s chart looks promising, despite past fluctuations. 

He says that Bitcoin had quite a round trip, reaching $70,000, dropping to $19,000, and then climbing back to $70,000. He attributes this resilience to regulatory factors, macroeconomic conditions, and the growth trade correlation.

Gordon emphasized the potential for Bitcoin to surpass $100,000, contingent on market conditions and regulatory support.

He also noted that Bitcoin is in a consolidation phase, with some seasonality working in its favor. According to him, if provided interest rates and the regulatory backdrop cooperate, enthusiasts should see significant movement this year.

Previous Predictions

Bitcoin’s price volatility has shown significant fluctuations since 2017, with major peaks in January 2018, December 2020, and November 2021.

Recent trends suggest a more stable market condition despite a recovery in early 2024. Analysts like Quinn Thompson, CEO of Lekker Capital, are optimistic, forecasting Bitcoin at $100,000 and Ethereum at $7,000 by November.

Thompson attributes his prediction to factors like the U.S. presidential election, increased Federal Reserve liquidity, and the launch of the Ethereum ETF.

In addition, other analysts, such as Jelle and financial educator Robert Kiyosaki, foresee substantial growth for Bitcoin. Jelle believes Bitcoin’s surge to $100,000 is imminent, citing the current market conditions. Meanwhile, Kiyosaki predicts Bitcoin will reach $150,000, emphasizing its potential as a key asset for financial freedom.