Home Blog Page 1364

Three Crucial XRP Technical Indicators Turn Positive as XRP Rises 35%

0

XRP rises 35% in two weeks as multiple technical indicators, including the SRSI, RSI, and MACD indicators turn positive.

XRP has surged over 35% in less than two weeks, capturing the attention of market participanhts. XRP’s price, which traded at $0.3911 on July 5, witnessed a dramatic spike to $0.5294 by July 14.

XRP 35
CoinGecko

This significant price increase has been attributed to several factors, including positive technical indicators and notable events in the crypto space. 

Key Technical Indicators Turn Positive

According to JD, a crypto analysis expert, the Stochastic RSI (SRSI), Relative Strength Index (RSI), and Moving Average Convergence Divergence (MACD) have all shown bullish signals for XRP. The SRSI crossed above 20 for the first time since 2023, indicating a shift from an oversold condition to a potential bullish trend.

Currently, the SRSI value is 54.30. The RSI has also crossed above its moving average for the first time since 2023, with a current value of 35.71, suggesting a positive momentum shift. Furthermore, the MACD histogram has turned green, indicating that the MACD line has crossed above the signal line, signaling upward momentum.

Historical data shows significant price points for XRP, such as $0.012 in 2014 and $3.31 in 2018. A downward trend line connects these historical price peaks, suggesting a long-term resistance level that XRP has struggled to break.

The chart shows a “possible target” area indicated by a green arrow, suggesting a potential future price target if XRP breaks the trend line resistance.

Recent Activity Suggest Positive Sentiment

Recently, XRP’s price increase has been mirrored by an uptick in daily active addresses, with noticeable peaks in late March, mid-April, and late June. 

sanbase
XRP Active Addresses | Santiment

A sharp rise in both price and active addresses since earlier this month suggests heightened interest and activity around XRP. The number of active addresses tends to correlate with price movements, with increased user activity often preceding significant price changes.

Factors Driving the Surge

Three major factors have driven XRP’s recent price surge. Firstly, the first anniversary of Judge Analisa Torres’ summary judgment in the SEC vs. Ripple case, fondly dubbed “XRP Freedom Day,” has been celebrated, contributing to positive sentiment. 

Secondly, speculation surrounding the SEC’s upcoming closed-door meeting on July 18 has fueled anticipation of a potential settlement in the ongoing legal tussle with Ripple. Lastly, the broader crypto market is experiencing a relief rally, partly due to speculation about a potential Fed rate reduction by September 2024. This overall positive sentiment in the crypto market has also supported XRP’s price increase.
Bitcoin Current Cycle Among Worst-Performing Despite New ATH: Glassnode

Glassnode’s latest report suggests that despite Bitcoin reaching a new all-time high this year, its current cycle is among the worst-performing compared to previous cycles.

Today, the crypto market is experiencing a notable rebound, led by Bitcoin’s rally as it reclaims the $63K range. Altcoins have followed suit, reaching new monthly highs. This development comes just two weeks after Bitcoin had dropped to a low of $53K.

Amid this bullish resurgence, analytics platform Glassnode conducted an in-depth analysis of Bitcoin’s price movements over the past 18 months. It compared the current cycle to previous ones and observed strange similarities.

Bitcoin Replicating History, Though Poorly in Uptrend

According to the report, the market enjoyed a steady 18-month price increase following the FTX collapse. However, after Bitcoin reached a high of $73,750, a three-month period of consolidating prices followed. 

During the bearish days between May and July, the Bitcoin market experienced its most significant correction in this bull cycle as it crashed by over 26% from its all-time high.

Meanwhile, Glassnode observed that this downturn has been relatively mild compared to previous cycles. For instance, in the 2020/2021 bull season, Bitcoin dropped 63% before the ultimate rally to the cycle’s peak. In the previous season, Bitcoin also retraced by 36%. 

Nonetheless, the analysis revealed that Bitcoin’s price performance shows a striking similarity to previous cycles when measured from each cycle’s low point, echoing patterns seen in 2018-2021 and 2015-2017.

Bitcoin Historical patter
Bitcoin Historical Patterns | Glassnode

Yet, a closer examination of the data reveals a stark contrast when performance is indexed to the Bitcoin halving date. Surprisingly, the current cycle ranks among the worst-performing despite the market achieving a new all-time high before the April halving event – a milestone never seen before.

Illustratively, three months after the fifth and most recent Bitcoin halving, the asset has declined by 13%. This contrasts with the 30% gain recorded during the same time frame after the fourth halving.

New Investors Underwater

The Glassnode report also highlighted a significant increase in the supply volume held by short-term Bitcoin holders. This surge coincided with the launch of Bitcoin spot ETFs, which triggered a rapid price increase driven by new solid demand.

Specifically, since January 2024, new investors have been buying in, but growth has plateaued in recent months, leading to a supply overhang. As a result, many new investors are now underwater. 

Currently, around 2.8 million BTC are held at a loss, similar to August 2023. The present situation has persisted for 20 days, but it is less severe compared to 2021, when a comparable trend lasted for 70 days and eventually contributed to a significant market downturn in 2022.

Overall, the analysis observed that after 18 months of steady growth following the FTX implosion, the market experienced three months of sideways trading before entering its deepest correction of the cycle. 

Despite this, the current drawdowns remain relatively mild compared to historical cycles, indicating a robust underlying market structure.

Here are Top 10 Cardano Play to Earn (P2E) Games

0

Cardano leads blockchain gaming with top 10 games, as Web3 gaming resource ranks Machiavellic first based on PlayToEarn ratings.

The blockchain gaming industry is witnessing significant visibility, with Cardano at the forefront. PlayToEarn, a leading data aggregator in the Web3 gaming space, recently revealed the top ten games on the Cardano blockchain, ranked by their PlayToEarn score. 

This disclosure came shortly after Cardano founder Charles Hoskinson celebrated a milestone for his gaming company, RFLXT, which launched its latest game, Chronoshot, on Epic Games. The integration of blockchain technology with mainstream gaming platforms signifies a new era for Cardano and its gaming ecosystem.

Top 10 Cardano Games Ranked

PlayToEarn’s latest ranking showcases the most popular games on the Cardano blockchain. Leading the list is Machiavellic, with an impressive score of 995. Disco Solaris follows with a score of 607, and Chains of War ranks third with a 550 rating.

Other notable mentions include Cardania Epoch Wars (520), Outlaws Brawl (361), and Cornucopias (300). The list also features Speed Throne (227), Cardano Warriors (215), Mocossi Planet (94), and Ada Quest (15). 

Cardano-based Games on Mainstream Platforms

As reported by The Crypto Basic days earlier, Chronoshot, RFLXT’s flagship game, is now available for wishlisting on Epic Games. This move marks a significant achievement for Cardano and Charles Hoskinson, who expressed excitement about bringing Cardano-based games to a mainstream platform. Notably, Chronoshot was launched in early access to maximize player engagement. 

It features two single-player modes, Time Attack and Survival, with leaderboards and limited character availability. The decision to launch in open beta is in sync with RFLXT’s strategy of building in public. This helps to enhance transparency and foster community involvement. Plans to introduce multiplayer modes soon after the early access launch are already underway.

Additionally, in May, Charles Hoskinson announced the onboarding of the classic 1990s FPS game, Doom, onto Hydra, Cardano’s layer-2 scaling solution. This announcement dispelled rumors that Cardano had abandoned Hydra.

While XRP Surges 20%, Expert Says Vitalik Buterin Neglects Ethereum Scaling Efforts

0

Crypto expert Crypto Bitlord criticizes Vitalik Buterin for neglecting Ethereum scaling efforts amid the 20% surge from XRP.

Market commentator Crypto Bitlord has gone to X to voice concerns regarding Ethereum’s progress. He criticized Ethereum co-founder Vitalik Buterin for not focusing enough on scaling the network, claiming Buterin is more concerned with personal matters. 

This statement comes amid a significant 20% increase in XRP’s value, highlighting a stark contrast in performance between the two cryptocurrencies. Bitlord’s comments have also sparked diverse reactions from the crypto community, reflecting varied perspectives on Ethereum’s future.

Crypto Bitlord accused Buterin of neglecting Ethereum’s scaling efforts, pointing out that Buterin is seen taking first-class flights and focusing on trivial issues like mask-wearing. The pundit asserts that these purported distractions have contributed to Ethereum’s sluggish movement in the market.

He highlighted that while XRP has surged by 20%, Ethereum’s growth remains minimal. Bitlord’s criticism underscores a sentiment of frustration among some Ethereum supporters, who believe Buterin’s current actions are insufficient for advancing the platform.

Divergent Views from the Crypto Community

The crypto community’s response to Bitlord’s critique reveals a spectrum of opinions. A pseudonymous veteran known as Yakuza defended Buterin, emphasizing his past contributions to Ethereum’s success.

Yakuza argued that Buterin’s efforts have brought Ethereum to its current status, suggesting that recent inactivity does not negate his historical impact. 

Conversely, another analyst dismissed the comparison between XRP and Ethereum, asserting that XRP will never surpass Ethereum. This analyst emphasized Ethereum’s potential and ongoing roadmap, suggesting that the platform’s long-term vision remains intact.

However, there are also voices of dissent within the community, with some analysts expressing skepticism about Ethereum’s ability to scale effectively. These critics argue that Ethereum’s current and future scalability issues make it an unviable option for mainstream adoption.

Comparing Ethereum and XRP

Over the past month, the price performance of Ethereum (ETH) and XRP has shown notable differences. Ethereum experienced a steady decline initially, followed by stabilization and a gradual recovery, ultimately trending upwards but remaining below its starting point for most of the period. 

In contrast, XRP displayed significantly higher volatility, with several sharp drops and quick recoveries. Notably, XRP surged dramatically towards the end of the period, resulting in a substantial positive gain that surpassed its initial value. 

Veteran Trader Brandt Sees Bitcoin Claiming $92,579 Amid Recent Bear Trap

0

Renowned veteran Trader Peter Brandt sets a $92,579 price target for Bitcoin (BTC) amid the ongoing recovery push, calling attention to a recent bear trap.

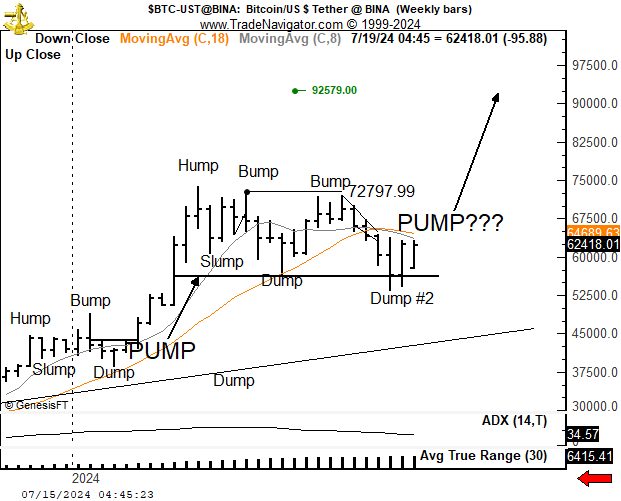
Brandt shared this analysis on X earlier today, suggesting Bitcoin could finally re-enter a price discovery phase. The analyst’s interpretation revolves around a pattern he calls “Hump…Slump…Bump…Dump…Pump.”

Brandt’s Interpretation of BTC’s Price Movements

According to the veteran trader, Bitcoin’s recent price movements have mirrored this pattern. Interestingly, this reality signals a potential bullish surge which aligns with an imminent “pump.”

In the analysis, Peter Brandt confirmed that Bitcoin experienced the “Hump” when it surged to the ATH of $73,794 in March. After this, the “Slump” occurred, leading to a low of $60,760 on March 20. The first “Bump” then resulted in a spike to $72,797 in April, but Bitcoin faced resistance at this level. 

This resistance triggered the subsequent “Dump.” The bears capitalized on this Dump to push Bitcoin to a 10-week low of $56,500 on May 1. Bitcoin recovered to trigger the second “Bump,” which allowed it to reclaim the $71,000 territory. However, another “Dump” occurred, which produced the latest market collapse.

A Bitcoin “Pump” to $92,579

With Bitcoin now looking to recover from this drop, Peter Brandt expects the “Pump” to occur in the near future. He set a target of $92,579 for this pump. This contrasts his earlier prediction that BTC might have already hit its top for the cycle.

Brandt highlighted a critical moment when Bitcoin attempted to form a double top on July 5. Such a pattern appeared bearish to the market. However, this bearish sentiment was quickly reversed, confirmed by a bullish close on July 13. Interestingly, the analyst stressed that this occurrence was a classic bear trap. 

With the bears trapped, Brandt’s analysis suggests an imminent upsurge. He presents a crucial support level around $56,000, pivotal for maintaining the bullish outlook. A close below this threshold would invalidate the bullish scenario and suggest a further bearish trend. 

Conversely, the resistance level stands at the previous peak of $72,797 in April. The chart also reveals that Bitcoin’s weekly ADX (Average Directional Index) sits at 34.57. This figure suggests a relatively strong trend. In addition, the ATR (Average True Range) currently at 6,415.41 points to high volatility.

Bitcoin Weekly Chart Peter Brandt
Bitcoin Weekly Chart | Peter Brandt

Bitcoin Sees Renewed Strength

Traders should monitor these key support and resistance levels closely, considering the high volatility. Meanwhile, Bitcoin currently trades for $62,959, up nearly 10% since July 12. This price surge is part of a recovery push following the German government’s exhaustion of its Bitcoin holdings. 

Bitcoin RSI and MACD

The Relative Strength Index (RSI) has recovered to 57.22 at press time, signaling renewed strength in the market. Additionally, the Moving Average Convergence Divergence (MACD) line has crossed above the Signal line for the first time in July, further supporting a bullish outlook. 

This combination of bullish technical indicators suggests that Bitcoin might be looking to sustain the upward momentum. The trend aligns with Brandt’s analysis of a potential bullish surge towards $92,579.

Australia Biggest Exchange Lists Cardano Memecoin SNEK 

0

Prominent Australia crypto exchange Swyftx announces listing of Cardano-based memecoin Snek (SNEK), as price surges 11.23% in 24 hours. 

According to an announcement today, Swyftx users can now buy and sell the memecoin under the spot trading pair SNEK/AUD. 

However, the exchange did not disclose when users can withdraw their SNEK tokens. It bears mentioning that SNEK trading commenced today on Swyftx at 05:00 AM (UTC). 

Top Cardano Ambassador Buys SNEK on Swyftx 

Notably, prominent Cardano community figure Pete confirmed that SNEK trading has already commenced on Swyftx, which he called ‘Australia’s biggest crypto exchange.’ Pete confirmed the information by sharing screenshots of his SNEK purchase. 

According to him, SNEK is one of the first Cardano-based tokens to secure a listing on the crypto trading platform. He envisions further listings involving other Cardano-based assets on the exchange. 

Swyftx is an Australia-licensed crypto exchange launched by two popular tech enthusiasts, Angus Goldman and Alex Harper, in 2018. 

Six years after its launch, Swyftx has become one of the leading exchanges in Australia and New Zealand, boasting more than 700,000 users in both regions. 

The exchange offers top-level security, quality customer service, a user-friendly interface, and significantly low fees. Information from its website claims that Swyftx supports over 350 digital currencies, including Bitcoin and Ethereum. 

SNEK Soars 11.23% in 24 Hours 

The significance of SNEK’s listing on a major exchange like Swyftx cannot be overstated. Notably, the move is expected to bolster the coin’s popularity and potentially drive its adoption. 

The announcement follows a double-digit surge in SNEK’s price. Data from CoinMarketCap shows that SNEK is up 11.23% in the daily charts to $0.001105. Similarly, the token’s price has increased 29.71% over the past seven days. At press time, SNEK boasts a 24-hour volume of $1.11 million and a market cap of $80.87 million. 

Besides Swyftx, SNEK has already attracted the attention of other popular crypto exchanges. Since its official debut in April 2023, the Cardano memecoin has been listed on MEXC, Gate.io, Bitrue, BingX, and CoinEx, among others. 

Last year, Binance triggered speculations of a potential SNEK listing after it published a trading guide relating to the memecoin. However, it has not listed the token yet. 

40 Altcoins That Can Transform $1,000 to $1M: Expert 

0

Veteran trader Altcoin Moe highlights 40 cryptos that could transform investors into millionaires with a small investment of $1,000.  

The recent relief rally across the broader crypto market has continued to reignite investors’ hopes of an imminent Altcoin Season. 

For context, the Altcoin Season is a period when the prices of alternative cryptocurrencies (crypto assets excluding Bitcoin) significantly increase. 

Top 40 Altcoins Poised for Massive Rallies 

In preparation for this cycle’s Altcoin Season, Altcoin Moe, a veteran trader with over a decade of experience, highlighted 40 cryptos capable of turning investors into millionaires with an initial investment of $1,000. 

Notably, the veteran trader specified the sectors of each asset, their current capitalization, and potential target price increase. The categories include Layer-1 blockchains, memecoins, gaming, privacy, and artificial Intelligence (AI). Interestingly, Moe expects the token to soar between 3x and 900x. 

Top 3 Assets in the List 

Topping the list is XRP, the seventh-largest cryptocurrency with a market cap of $30 billion. The trader speculated that XRP would surge between 6x and 10x in the upcoming altcoin season. 

The second asset on the list is Dione Protocol (DIONE), a Layer-1 crypto project. Moe expects DIONE’s price to surge by a minimum of 25x to a maximum target of 30x during the altcoin season. 

AI-focused crypto project Node AI (GPU) was ranked in the third position in the list, with Moe expecting the token’s price to hit a target of up to 60x. At the time of the tweet, GPU had a market cap of $59 million, making it the 459th-biggest cryptocurrency. 

The remaining digital assets in the top 10 position include Propchain (PROPC), Router Protocol (ROUTE), Vulcan Forged (PYR), Gains Network (GNS), Blendr Network (BLENDR), Oraichain (ORAI), and Gigachad (GIGA). 

Other Tokens with Massive Growth Potential   

Tokens ranked in the 11th – 20th position include Houdini Swap (LOCK), HashAI (HASHAI), WolfCoin (WOLF), ClearPool (CPOOL), TriasLab (TRIAS), Banana (BANANA), PeiPei (PEIPEI), PaLM AI (PALM), Mog Coin (MOG), and Destra Network (DSYNC). 

Additionally, tokens categorized between 21st and 30th list are Pepe (PEPE), Brett (BRETT), PAAL AI (PAAL), ANyONe Protocol (ANYONE), RocketX Exchange (RVF), Non-Playable Coin (NPC), HELLO (HELLO), Optimism (OP), Verasity (VRA), and LCX (LCX). 

The last 10 tokens in the list are Arbitrum (ARB), CSWAP (CSWAP), Popcat (POPCAT), Injective (INJ), Arcblock (ABT), Seedify.fund (SFUND), Root Network (ROOT), Dogwifhat (WIF), Ponke (PONKE), and Water Coin (WATER). 

Although crypto investing can potentially turn average income earners into overnight millionaires, it is imperative to conduct due diligence before committing funds to any of these assets. 

Moe also echoed a similar sentiment, urging investors to thoroughly research the 40 digital assets ahead of the anticipated altcoin season.  

Analyst Predicts Imminent Bitcoin Rally as BTC Trails Gold’s Price Action

0

Ali Martinez’s analysis highlights striking similarities between Bitcoin and gold’s price movements, supporting Bitcoin’s role as “digital gold.”

Ali Martinez has highlighted a striking similarity between Bitcoin and gold’s price movements. This comparison emphasizes Bitcoin’s role as “digital gold.” The analysis examines two charts, one for CFDs on Gold (US$ / OZ) from 2011 to 2024 and another for Bitcoin (BTC/USD) from early 2022 to mid-2024. The visual comparison showcases how Bitcoin’s price action mirrors that of gold, supporting the narrative of Bitcoin as a digital counterpart to gold.

Long-term Bitcoin Is Bullish

The gold chart indicates a long-term bullish trend punctuated by periods of consolidation and breakout. From 2011 to 2015, gold experienced a significant peak followed by a bearish trend. Between 2016 and 2019, gold prices consolidated within a range, oscillating without a clear direction. Post-2020, gold prices surged after breaking out of the consolidation range around 2019. Another consolidation phase occurred from 2021 to early 2023, with gold recently breaking out again, suggesting a potential continuation of the bullish trend.

Bitcoin’s chart reveals a clear bullish trend from early 2023 onwards, echoing gold’s historical price behavior. Early 2022 saw a significant bearish trend, leading to lower prices. From mid-2022 to early 2023, Bitcoin formed a bottom and began a gradual ascent. Since early 2023, Bitcoin has shown strong upward momentum, establishing a new consolidation range. This price action mirrors gold’s consolidation phase, hinting at a possible breakout to higher levels.

Comparative Insights

Both gold and Bitcoin exhibit a pattern of strong upward momentum followed by periods of consolidation. This similarity reinforces the narrative of Bitcoin as “digital gold.” Given gold’s recent breakout, Bitcoin might follow a similar trajectory, leading to a substantial price increase if it breaks out of its current consolidation range.

Bitcoin’s attributes as a store of value contribute to this comparison. Notably, Bitcoin’s durability, portability, fungibility, divisibility, scarcity, verifiability, and censorship resistance are key characteristics aligning it with gold as a store of value.

Bitcoin as a Store of Value

Bitcoin’s decentralization ensures its durability, as it is not subject to physical degradation. Its portability surpasses gold, allowing for quick and cost-effective global transactions. Bitcoin’s fungibility and divisibility enhance its usability, with each bitcoin interchangeable and divisible into 100 million satoshis. 

The capped supply of 21 million bitcoins ensures its scarcity. Transactions are verifiable on a transparent blockchain, and its decentralized nature provides resistance to censorship.

Bitcoin as a Hedge Against Inflation

When comparing Bitcoin and gold as inflation hedges, several factors come into play. Gold has a long-established history as a reliable store of value during periods of inflation. Its enduring presence as an inflation hedge spans thousands of years. In contrast, Bitcoin, with just over a decade of existence, is still proving its viability in this role.

Experts emphasize that while there is no historical data on Bitcoin as an inflation hedge due to its relatively recent introduction, its characteristics suggest potential. Bitcoin’s limited supply inherently creates scarcity, a crucial factor for an inflation hedge. The decentralized nature of Bitcoin, resistant to central bank policies and government interventions, adds to its appeal as an inflation-resistant asset.

Bitcoin’s Impressive ROI Surge in 2023

Bitcoin’s ROI shows a dramatic upward trend, particularly from mid-2023 onwards, ultimately surpassing 200% by March 2024. This significant increase underscores Bitcoin’s potential for substantial gains. 

Bitcoin vs Gold ROI
Bitcoin vs Gold ROI

In contrast, gold’s ROI exhibits a more stable and modest increase, remaining mostly below 50%. While gold provides consistent but lower returns, reflecting its status as a traditional safe-haven asset, Bitcoin’s higher volatility and rapid ROI growth make it a more speculative but potentially lucrative investment.

Shiba Inu Team Launches $2,000 Shibarium Giveaway Contest

0

The Shiba Inu team’s $2,000 Shibarium giveaway, running from July 15 to September 15, encourages bridging assets, using Shibaswap, and sharing on X with specific hashtags.

In a recent announcement, DaVinci, a Shibarium Discord Admin, revealed a $2,000 giveaway contest designed to boost user interaction on Shibarium. The contest, starting on July 15 and running until September 15, encourages participants to bridge assets on Shibarium and share their experiences on X (formerly Twitter) using specific hashtags.

Contest Participation and Prizes

To participate in the contest, users are advised to bridge a specified amount of crypto to Shibarium and use Shiba Inu’s DEX, Shibaswap. Participants should then share their expertise on X including the hashtags #Shibarium and #TreatYourSelf. 

Notably, the giveaway has a prize structure: $1,000 for first place, $500 for second place, $250 for third place, with $50 each for five additional winners. 

Insights from Shibarium’s Marketing Lead

Lucie, the marketing lead for the Shiba Inu ecosystem, provided further information into the contest during an exclusive interview with The Shib Daily, emphasizing the inclusivity of the promotion. 

To increase their chances of winning, Lucie recommended that participants interact more frequently on Shibarium and actively promote the project on social media. The giveaway, reportedly organized by Shibarium Discord admins with support from developers Shytoshi Kusama and Kaal Dhairya, is designed to foster community participation and engagement.

Shibarium Sees Growth

Meanwhile, Shibarium has seen significant activity, with key metrics reflecting its growth. The blockchain has created 5,775,622 total blocks, with an average block time of 5.0 seconds.

Total transactions on the network amount to 418,377,984. Additionally, Shibarium has 1,810,035 unique wallet addresses, a testament to its broad user base. The gas tracker reports transaction fees at less than $0.01, making it cost-effective for users.

Daily transactions on Shibarium average 3,190. This activity is further supported by recent partnerships with K9 Finance and Unification, aimed at enhancing Shibarium’s DeFi ecosystem. These collaborations seek to bolster decentralized finance within the Shiba Inu ecosystem, leveraging the Shibarium layer-2 solution and the security of the Ethereum network.

Shibarium’s focus on community and innovation is evident in its latest developments. The upcoming Shib Marketplace, powered by Shibarium, seeks to revolutionize digital commerce by providing transparent and secure transactions. This platform will eliminate intermediaries and mitigate fraud risks, leveraging Shibarium’s smart contract features.

Analysts Predict Shiba Inu Spike to $0.0001-$0.0002 Based on Elliott Wave Patterns

0

Prominent analysts expect Shiba Inu to spike to a price range of $0.0001 to $0.0002 based on a complex web of Elliott Wave patterns.

Shiba Inu (SHIB) has spiked 13% over the past week as it leverages the ongoing market recovery for a rebound. This upsurge has allowed SHIB reclaim the $0.000018 price territory. The canine-themed token is now looking to build on this recovery push to hit greater heights.

Amid the rebound, market analyst Michael and crypto analysis platform More Crypto Online have provided bullish forecasts, citing the Elliott Wave Theory. According to them, Shiba Inu is transitioning from corrective waves to impulsive waves, signaling a bullish trend.

Shiba Inu Targets $0.0001 on Wave 3

Michael’s chart, marked with various wave counts, indicates SHIB is in the final phase of a corrective wave labeled as ‘c’. He suggests that once SHIB completes wave c, it would engineer a shift into the impulsive wave 3. 

This shift is crucial as wave 3 is typically the strongest and longest in an Elliott Wave cycle, suggesting a significant upward movement. Michael also highlights multiple support and resistance levels. Key support levels sit at $0.00000800, with significant resistance levels at $0.00002300 and above.

The chart further shows a volume profile, indicating significant buying and selling interest at various price levels. Notably, there is considerable activity around the $0.00001000 to $0.00002300 range, which is worthy of note.

In anticipation of wave 3, Michael sets two key price targets for SHIB. The first target is at $0.00002345, aligning with a breakout from a prevailing bull flag pattern. Meanwhile, the more ambitious target is at $0.00010114, which aligns with the completion of wave 3. 

An Ambitious $0.00025 Target

Meanwhile, More Crypto Online, a prominent crypto analysis platform, further provides a bullish outlook for SHIB. They also based their analysis on the Elliott Wave Theory, highlighting the potential for SHIB to transition from a corrective wave (B) to an impulsive wave (C). 

The analysis suggests SHIB is nearing the end of wave (B) and is expected to move into wave (C). Data from the chart shows key support zones based on Fibonacci retracement levels, with the Fibonacci 0.5 located at $0.0000167. Notably, this level serves as a potential support zone. 

Another support level rests on the 0.618 Fibonacci retracement at $0.0000131. The 0.786 Fibonacci Retracement level is also pivotal, aligning with $0.0000094. 

According to the platform, SHIB could witness a potential reversal candle within the orange support zone. This suggests a bullish reversal may be imminent. However, the platform emphasizes the need for a clear 1-2 setup in wave C to confirm this reversal. 

Interestingly, should the bullish setup materialize, More Crypto Online identifies several ambitious price targets for SHIB. They base these targets on Fibonacci levels, specifically identifying $0.0000897, at $0.0001696, and $0.0002501.