Home Blog Page 193

XRP Defies Usual Market Trends as Prices Spike Alongside Exchange Inflows

0

XRP appears to be defying established market behaviors, as its price spikes alongside exchange inflows.

XRP is showing a pattern that goes against how most crypto assets behave, especially when looking at exchange flows. Notably, instead of rising when tokens leave exchanges, the XRP price seems to increase when more tokens move into exchanges. 

Key Points

  • XRP’s price seems to increase during exchange inflows and decrease when tokens flow out of exchanges.
  • Data shows the XRP price rose from $0.551 to $0.688 between January and March 2024, while exchange reserves increased from 2.65 billion to over 3 billion tokens.
  • In the ongoing downturn starting in October 2025, XRP has fallen from $2.8 to about $1.4, while reserves have dropped from 3 billion to 2.79 billion XRP.
  • Rising inflows alongside rising prices suggest the market is seeing strong activity, where demand absorbs supply despite more tokens entering exchanges.
  • When demand weakens after high inflows, earlier deposits begin to add selling pressure, leading to price slowdowns or reversals.

XRP Price Following Exchange Flows

XRP community analyst Xaif called attention to this data while citing a report from CryptoQuant. Notably, in most cases, when investors move assets off exchanges, it suggests they plan to hold for a longer time. This reduces selling pressure and often supports price growth. 

However, XRP does not seem to follow this pattern. Instead, its price often rises as more tokens flow into exchanges and falls when those tokens leave. This unusual behavior suggests that the usual supply and demand signals may not accurately track XRP’s price action.

The market pundit also pointed out that before XRP sees a massive price explosion, both inflows and outflows often surge in tandem with each other. “On paper, people are NET SELLING into the pump. So who’s buying?” He asked, suggesting that something else is behind these moves.

According to Xaif, many traders misunderstand XRP by applying the same approach they use for assets like Bitcoin (BTC). According to him, XRP does not behave the same way, and traders who rely on standard on-chain indicators could get the wrong read on the market.

Historical Data Supports the Pattern

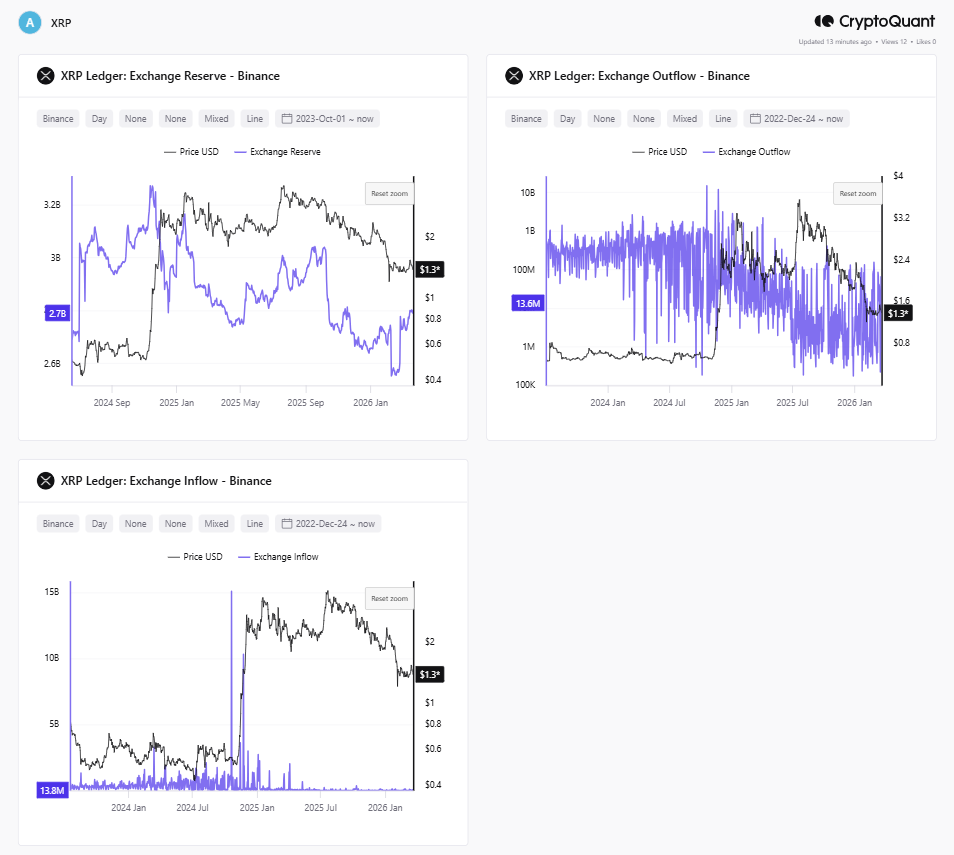
Historical data helps confirm this trend. Figures from Binance show that between Jan. 18, 2024, and March 10, 2024, XRP reserves on the exchange increased from 2.65 billion tokens to over 3 billion tokens. During the same period, the price rose from $0.551 to $0.688, moving in the same direction as the rising reserves.
XRP Binance Exchange Flows CryptoQuant
XRP Binance Exchange Flows | CryptoQuant

A similar pattern appeared during the rally between November 2024 and January 2025. Specifically, XRP’s price jumped from $0.5 to $3.4, while Binance’s reserves increased from 3 billion tokens to 3.2 billion tokens. While the rise in reserves was smaller compared to the price jump, both still moved upward together.

The trend has continued amid the decline that started in October 2025. Notably, XRP’s price has dropped from $2.8 to about $1.4, while Binance reserves have also fallen from 3 billion XRP to 2.79 billion XRP. 

What Could Be Driving This Behavior

This pattern suggests that XRP’s investors start locking profits whenever XRP spikes. Specifically, during price rallies, traders and large holders often move tokens onto exchanges to take profits as the prices rise. However, these inflows do not immediately push prices down because strong demand absorbs the supply.

As a result, both buying and selling can stay high at the same time. Essentially, prices continue to rise while more tokens enter exchanges because buyers are still active enough to match the selling. In this phase, the inflows show strong market activity, not immediate weakness.

However, once the initial demand begins to slow, the situation changes. The tokens that traders moved into exchanges earlier start to have a stronger effect. The selling pressure builds, and prices begin to stall or fall. This is when earlier inflows start to weigh on the market.

Shiba Inu Bullish Formation Targets 38% Surge to Key Moving Average

0

Shiba Inu is forming a bullish divergence on the daily timeframe, and this could result in a double-digit price expansion in the coming weeks.

The positive formation follows a string of upward price movement on the daily chart. Shiba Inu (SHIB) is now on course for the third consecutive green candlestick on the 1-day chart, during which it has bounced 9% from recent lows.

Key Points

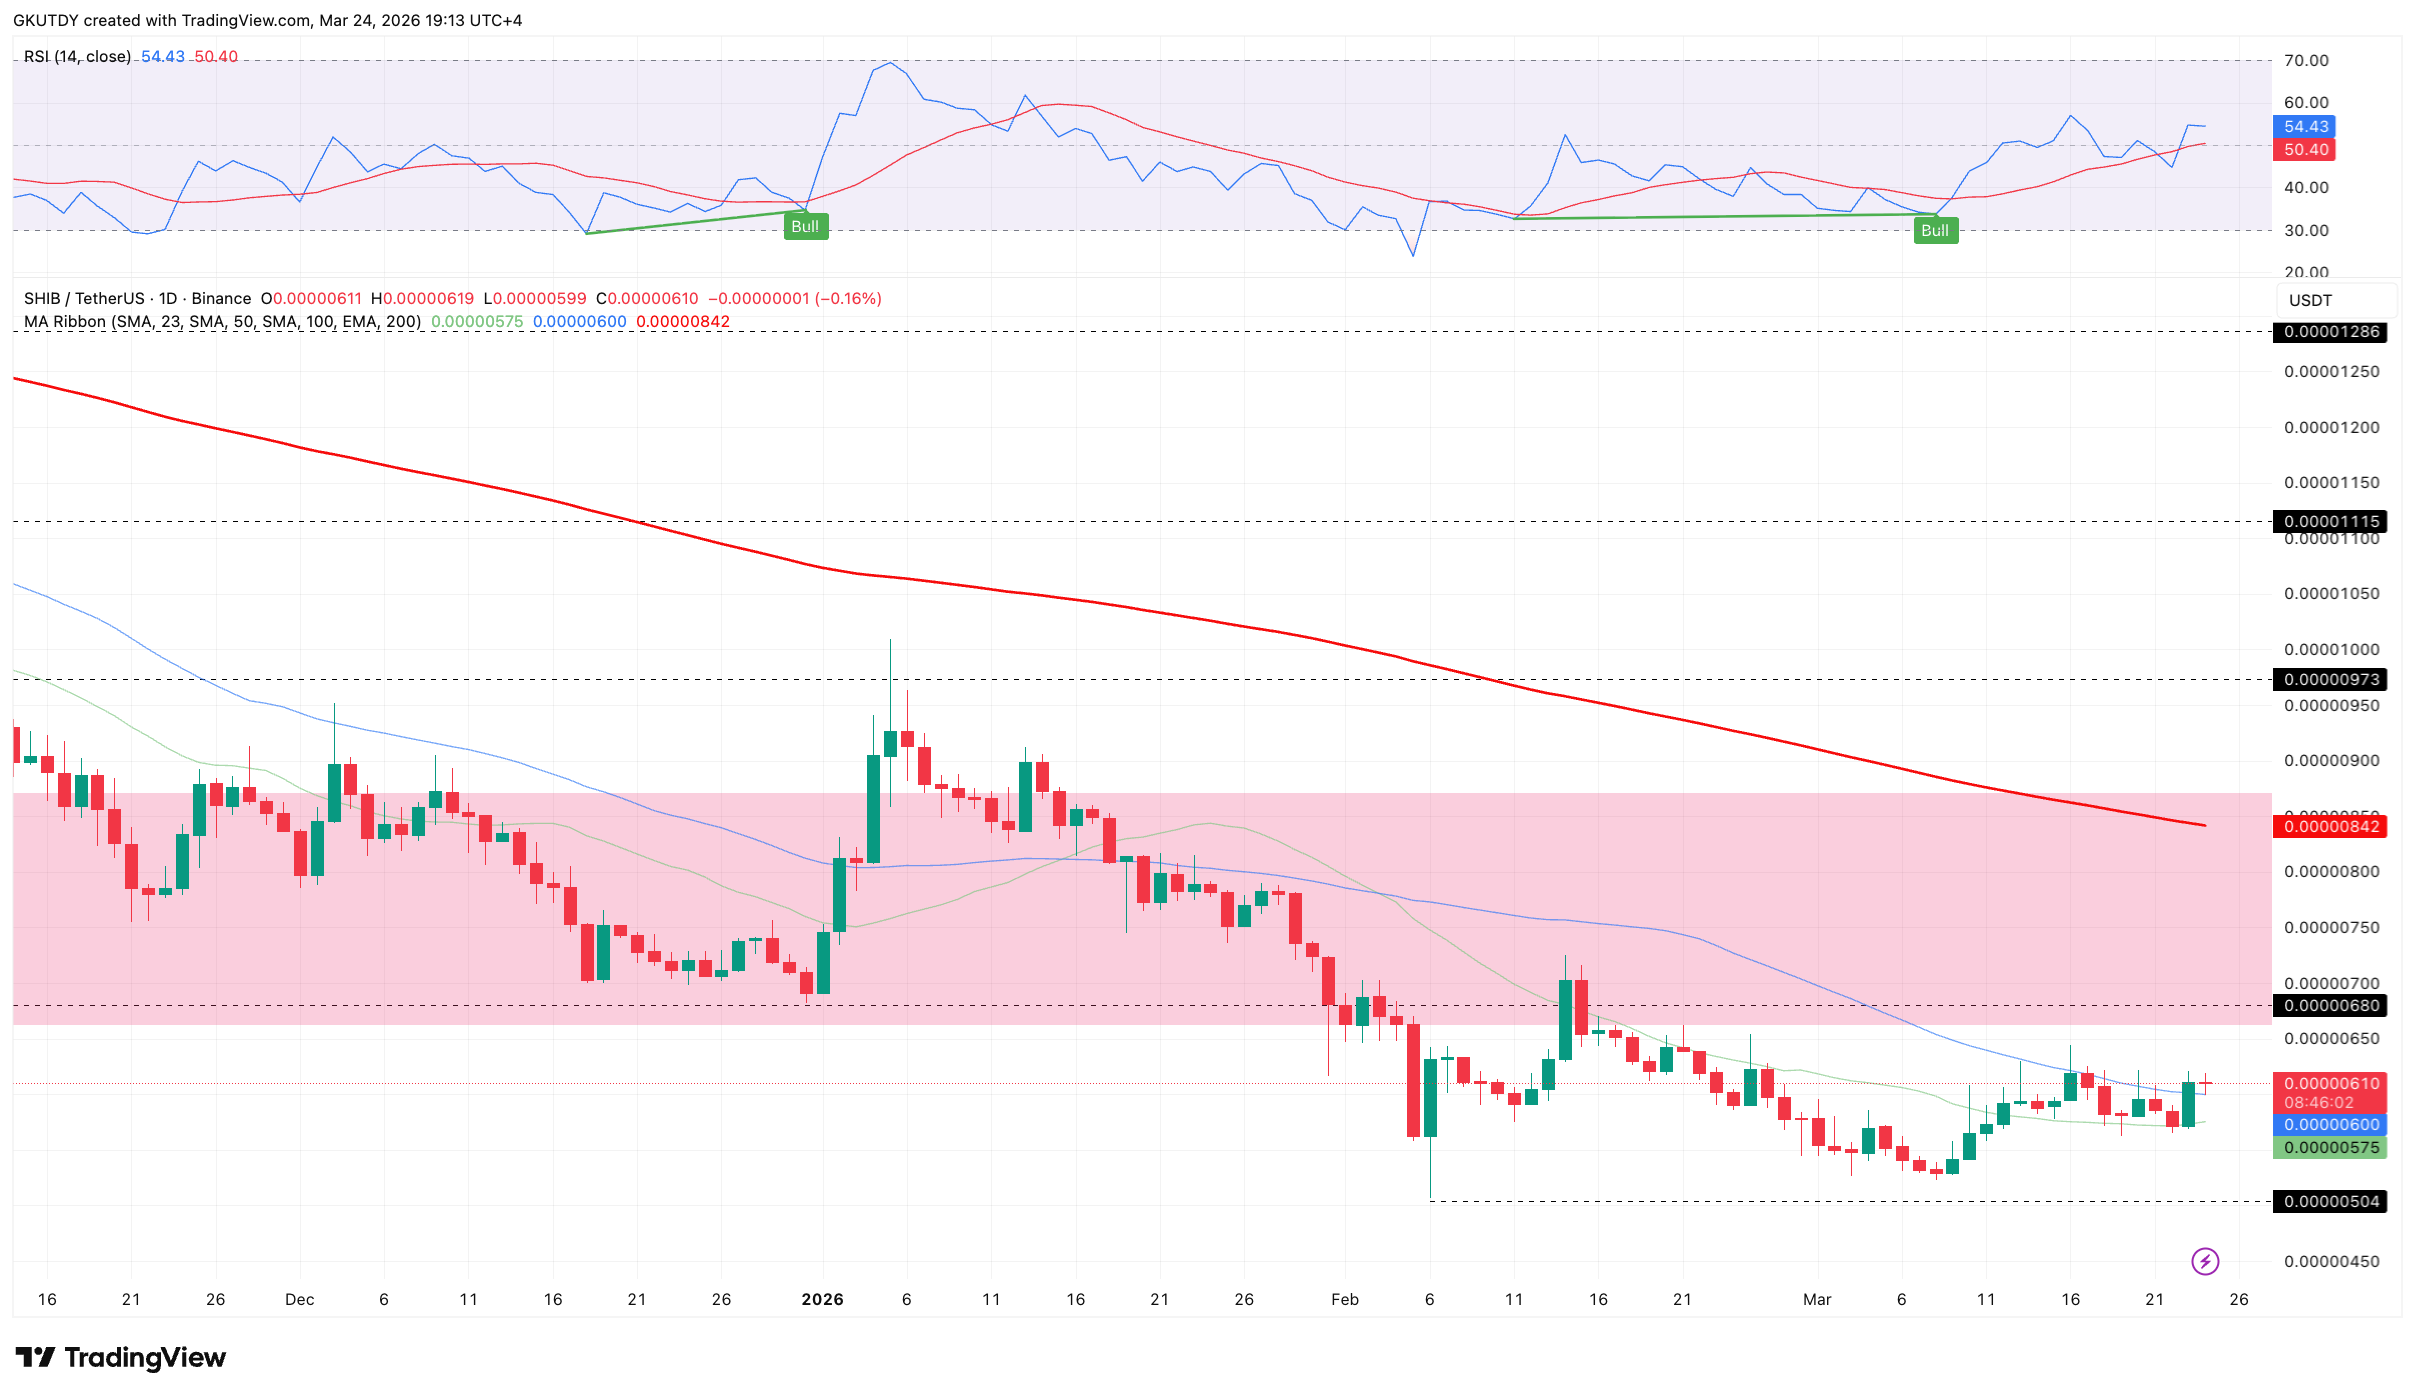
  • Shiba Inu is forming a divergence on the daily timeframe, with prices making lower lows while the RSI indicator made higher lows.
  • This divergence has occurred twice in recent months, with the first between December 18 and 31 and the most recent between February 5 and March 8.
  • The first target should bullish momentum return is the last lower high peak at $0.00000725, with the subsequent target being the 200 MA at $0.00000864.
  • Adding to this bullish outlook is Shiba Inu’s recent break above the 50-day exponential moving average.

Shiba Inu Bullish Divergence

A look at the daily chart shows a developing bullish divergence between the relative strength index (RSI) and SHIB’s price. While prices made lower lows, the indicator made higher lows, a divergence that usually signals market strength despite dwindling prices.

Interestingly, this divergence has occurred twice already in recent months. The first instance was between December 18 and 31, when the RSI made higher lows from 29 to 34, while SHIB dropped from $0.00000753 to $0.00000682. This sparked a strong price surge, with Shiba Inu rallying over 22% in days to January’s high of $0.00001009.

The most recent occurrence happened between February 5 and March 8. The RSI trended upwards from oversold levels of 23.7 to 33.7, but prices diverged, dropping from the opening of $0.00000663 to $0.00000523.

Shiba Inu Bullish Divergence

Moreover, SHIB has held above the key support level around $0.00000504. It reached the zone on February 6, and a drop near the area at $0.00000523 earlier in the month was met with a strong rebound. A combination of this divergence and momentum from holding support could push SHIB much higher.

Specifically, the first target would be the last lower high peak at $0.00000725, representing a 16% increase. Subsequently, SHIB could rally to the key 200-day simple moving average. Currently, this indicator is at $0.00000864, culminating in a 38% rise from here.

Potential 50-Day EMA Breakout Adds to Bullish Prospect

Adding to this bullish outlook is Shiba Inu’s recent break above the 50-day exponential moving average. With minimal noise, the token defied this resistance following its two-day bullish haul.

The 50 EMA is key to price trends, as it serves as a major boundary between downtrends and uptrends. Holding above it paves the way for further price rallies.

Currently at $0.00000619, the 50 EMA trends below the current price of $0.00000624. It all boils down to maintaining the trend above this trendline, as doing so would set the pace for higher prices.

Shiba Inu also remains above key moving MAs, which is a positive sign. The token’s price is above the 50 MA and 23 MA, providing strong support for further price trends.

CME Group Lists XRP Alongside Bitcoin in Official SEC Filing

A recent disclosure from CME Group has placed XRP alongside major digital assets like Bitcoin in its official filings.

According to the 10-K filing submitted to the U.S. SEC, XRP now sits alongside Bitcoin and Ethereum within CME’s listed crypto product offerings.

Key Points

  • CME Group lists XRP alongside Bitcoin and Ethereum in official SEC filings.
  • XRP futures hit $1B open interest fastest in CME history, boosting institutional appeal.
  • U.S. XRP ETF launched in Nov 2025 with $1B+ inflows, signaling growing adoption.
  • Missouri proposes including XRP in a state crypto reserve and Strategic Reserve Fund.

CME Filing Puts XRP Alongside Top-Tier Assets

The filing highlights XRP as part of the exchange’s derivatives offering, which includes futures and options products used by institutions for hedging, speculation, and portfolio allocation.

CME Group’s platform serves financial institutions, corporations, and even central banks, emphasizing its role in providing liquidity, price discovery, and risk management tools across global markets.

This move suggests XRP is becoming more widely accepted by large institutions. Since CME’s trading platforms are widely used by professional investors, XRP’s inclusion makes it easier for them to invest in the asset.

CME SEC Filing
CME SEC Filing

XRP Futures See Explosive Growth

The SEC filing follows strong performance from XRP futures since their launch in May 2025. Within just five months, XRP futures on CME recorded:

  • Over 567,000 contracts traded
  • Nearly $26.9 billion in notional volume
  • Around $213 million in average daily volume

The contracts, offered in both standard (50,000 XRP) and micro (2,500 XRP) sizes, quickly gained traction, reflecting rising demand for regulated XRP exposure.

Notably, XRP became the fastest cryptocurrency in CME history to reach $1 billion in open interest, achieving the milestone in just over three months. The move outpaced other major assets such as Bitcoin, Ethereum, and Solana.

Institutional Momentum Builds Around XRP

The rapid growth of XRP derivatives points to improving liquidity and tighter spreads, which are key conditions that typically attract institutional participation. Market observers believe this momentum strengthened the case for a U.S.-based XRP exchange-traded fund (ETF). Ultimately, XRP ETFs launched in November 2025 and have already seen over $1 billion in inflows.

Essentially, after years of regulatory uncertainty, XRP is now integrating into mainstream financial infrastructure. With CME Group formally recognizing it in its core filings, the asset enters a new phase of institutional acceptance.

Missouri Moves to Add XRP to State Crypto Reserve

At the same time, XRP is making inroads at the government level in the United States. A new proposal in Missouri aims to include XRP in a state crypto reserve. The bill would create a Strategic Reserve Fund that allows the state to hold, buy, and manage digital assets like XRP, Bitcoin, Ethereum, Solana, and USDC.

The fund could also receive crypto through donations or grants, positioning XRP as part of a long-term financial plan rather than a short-term investment.

Meanwhile, the proposal allows state agencies to accept stablecoins like USDC for fees, taxes, and fines, while including rules to prevent illegal activity, require third-party custodians, and ensure transparency.

With institutional support and state-level adoption, XRP is moving beyond speculation and into mainstream financial use.

Cardano Price Prediction: ADA Eyeing Further Gains After Climbing Above Key EMA

0

Cardano climbed above a key moving average as buying strength improved. Can ADA surge further?

Cardano (ADA) changed hands at $0.2709 at the time of this writing, posting a 1.27% gain over 24 hours after recovering from an intraday low near the $0.258-$0.260 area. The one-day chart shows ADA spending much of the earlier session under pressure before reversing higher and reclaiming the $0.2666 level.

From there, the price extended gains and moved toward the $0.271 area, showing stronger buyer control into the latest part of the session.

The broader performance panel shows a mixed trend. Notably, Cardano was up 0.89% over 4 hours and 1.27% over 24 hours, but it remained down 6.28% over 7 days. 

Cardano Price Analysis

Cardano’s 4-hour chart shows improving bullish momentum, with ADA climbing above $0.27 after rebounding from the $0.249-$0.251 zone. A key signal on the chart is the 9-period EMA, which sat near $0.2658 at the time of this press. 

Cardano Price Prediction

ADA was trading clearly above the EMA, while the moving average itself had turned higher. That usually suggests momentum has shifted in favor of buyers, with the EMA now acting as a near-term dynamic support level rather than resistance.

The price action also shows that Cardano has pushed through the $0.270 area and is now testing the upper end of the recent move. If buyers hold control, the next immediate zone to watch sits around $0.272-$0.276. On the downside, initial support appears near $0.268, followed by the EMA at $0.2658, while a deeper pullback could bring $0.260 back into focus.

The Average Truth Range printed around 0.00512, which shows volatility remains elevated but is not accelerating. In practical terms, that means Cardano is still moving with enough range to support trend continuation.

However, the slightly softer ATR profile suggests the rally is becoming more controlled rather than overly explosive.

Cardano Liquidation Data

Cardano’s liquidation data shows very limited stress in the past hour, with just $2.18K wiped out, all of it from long positions, while short liquidations were zero. Over the 4-hour window, total liquidations rose to $48.25K, and most of that came from shorts at $45.42K, compared with only $2.83K in long liquidations.

Cardano Rekt Data
Cardano Rekt Data

That points to a near-term move higher that likely caught bearish traders offside. The imbalance becomes even clearer on the 12-hour view, where total liquidations reached $201.85K, including $197.12K in shorts and just $4.74K in longs.

On the 24-hour timeframe, liquidations were more mixed at $458.39K, with $250.88K in longs and $207.51K in shorts.

Shiba Inu Rally Gains Steam Amid $49M Open Interest Spike and Bullish Setup

0

Shiba Inu delivered its strongest price performance in weeks as improving macro sentiment triggered a broad relief rally across global markets. 

Notably, Shiba Inu ranks among the key beneficiaries of the renewed risk appetite, supported by a notable surge in derivatives activity that signaled fresh trader interest. 

Key Points 

  • Shiba Inu surged nearly 8% on Monday, rising from $0.0000057 to $0.0000062. 
  • Open interest has surged tremendously, increasing 9.27% to $49.14 million. 
  • Market volatility triggered $62,490 in liquidations over 24 hours, with long positions accounting for $37,380. 
  • Analysts suggest SHIB is nearing a breakout from a descending triangle pattern. 

Shiba Inu Recent Performance 

On Monday, SHIB climbed sharply from approximately $0.0000057 to $0.0000062, marking a gain of nearly 8%. This rally represented its most significant daily performance since mid-February. 

Additionally, open interest in SHIB derivatives jumped by as much as 18%, confirming that traders were actively repositioning. Although the token briefly retraced to around $0.000006047, it quickly regained momentum and moved back above $0.0000062. At press time, SHIB traded at $0.000006247, reflecting a 2.09% increase over the past 24 hours.

Meanwhile, derivatives data show that open interest remains elevated, rising 9.27% to $49.14 million within a day. 

Shiba Inu Open Interestt
Shiba Inu Open Interest

SHIB Liquidation Hits $62K in 24 Hours; Analyst Eyes Potential Triangle Breakout 

However, this volatility has also triggered liquidations across the market. In the past 24 hours alone, total liquidations reached $62,490, with long traders accounting for the majority at $37,380, while short positions made up roughly $25,120. 

SHIB Liquidation
SHIB Liquidation

Despite these fluctuations, bulls have continued to defend the critical $0.0000060 support level since the start of the Monday rally. This resilience has strengthened the case for a potential breakout.

Notably, analyst Leeron Shim noted that SHIB is approaching a breakout from a descending triangle pattern formed in mid-February. Previous attempts to break this structure on March 16 failed, leading to price declines. However, Shim suggested that current support from the 100-day moving average could provide the strength needed for a successful breakout. 

Factors Required for Breakout 

For confirmation, he noted that SHIB must close above the descending resistance trendline and attract fresh capital. If achieved, the token could retest its January peak near $0.00001009. 

In the meantime, accumulation trends support this outlook. Recent data shows that investors have been withdrawing significant amounts of SHIB from exchanges, signaling a preference for holding. 

Specifically, about $6.75 million in SHIB has been withdrawn, compared with $5.98 million in inflows over the past day. This results in net outflows of roughly $746,910, equivalent to over 119 billion SHIB leaving exchanges. 

XRP Realized Volatility Hits Lowest Level in 2026

0

The XRP Realized Volatility indicator on Binance has reached its lowest level this year, suggesting that a sharp move may be imminent.

Following the downward push that has resulted in a 20% decline for XRP this year, bulls have started defending XRP around the $1.4 level, cushioning steeper declines. 

However, new data suggests that a major move could be approaching, as the Realized Volatility on Binance over the past 30 days has dropped to its lowest reading since the start of 2026.

Key Points

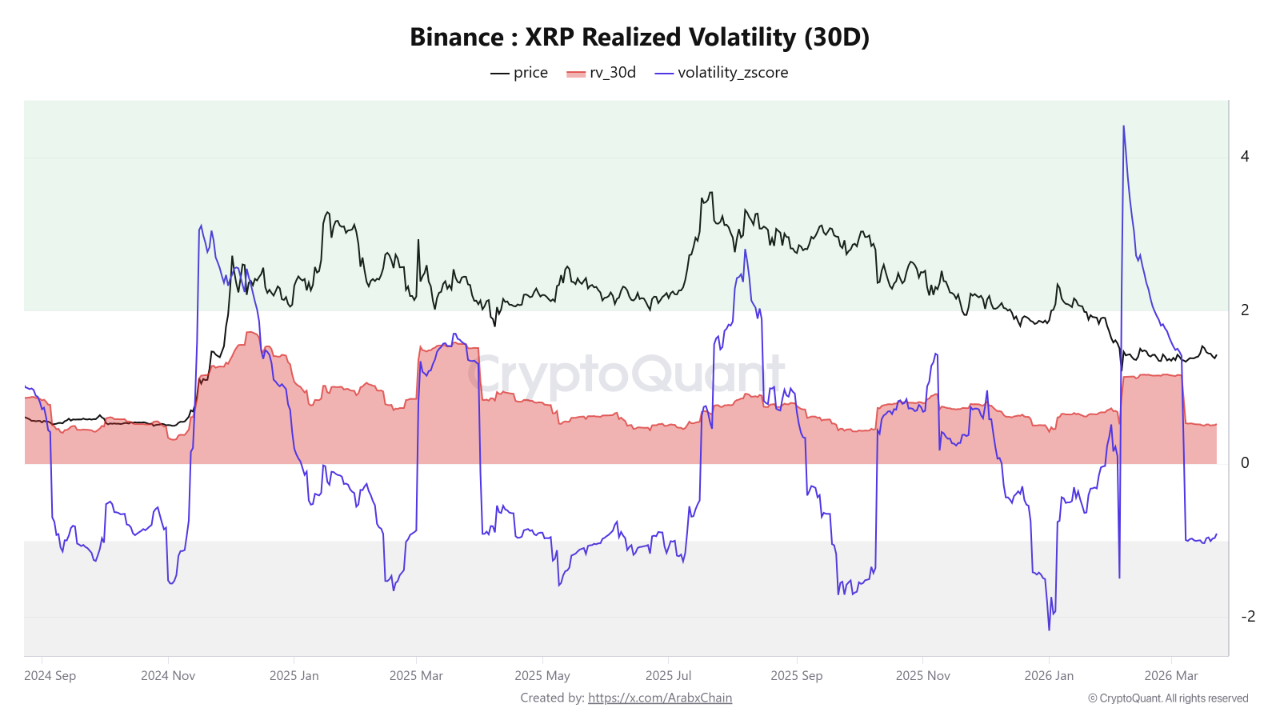
  • XRP’s 30-day realized volatility on Binance has dropped to around 0.52, marking the lowest level in 2026.
  • Data shows that a similar drop in volatility in January 2026 led to a 31% rally from $1.84 to $2.41 in five days.
  • In contrast, another low-volatility period in October 2025 preceded a decline from $2.88 to $2.19, showing that moves can occur in either direction.
  • XRP’s Bollinger Bands and Historical Volatility metrics have begun recovering after similar declines.
  • XRP has formed higher lows from $1.1 in early February to $1.36 in late March, suggesting growing buyer support despite the uncertain outlook.

XRP Volatility Compression Points to a Coming Move

Arab Chain, a verified analyst on CryptoQuant, revealed these findings in a recent market commentary. According to him, the Binance XRP Realized Volatility (30D) has declined sharply, indicating that the price has moved less over the past month. 

For the uninitiated, this indicator tracks how much the price of XRP changes on Binance over a 30-day period, and its current level shows that the market is currently calm in comparison to other periods. At 0.5266, the 30-day realized volatility sits lower than the levels seen earlier in 2026 when prices were more active.

Moreover, Arab Chain also highlighted the Volatility Z-Score, which now stands at -0.9048. This negative value further confirms that current volatility is well below its usual range. Essentially, the market has slowed down, and prices are moving within a tight range.

The analyst called this concept “volatility compression,” where the market pauses before making a bigger move. The current XRP price of around $1.4 suggests that buyers and sellers have reached a balance. 

However, such a balance usually does not last long. Arab Chain noted that once volatility starts to rise again, especially if the Z-Score turns positive, the chances of a strong move increase. That move could go either upward or downward, depending on which side takes control.

Historical Data

Historical data confirms this trend. Arab Chain’s chart shows that when realized volatility dropped to similar levels as before, XRP often made strong moves soon after. For instance, at the start of January 2026, a drop in volatility came before a quick rally. Specifically, XRP rose from $1.84 on Jan. 1 to $2.41 by Jan. 6, gaining 31%.

XRP Realized Volatility CryptoQuant
XRP Realized Volatility | CryptoQuant

A different outcome appeared in early October 2025. After a similar drop in volatility, XRP moved lower, falling from $2.88 on Oct. 9, 2025, to $2.19 by Oct. 17, 2025. This decline marked the beginning of the ongoing downtrend and confirmed that a drop in volatility could lead to a sharp move in either direction.

Meanwhile, another case occurred in early July 2025, when low volatility came before a strong rally. Notably, XRP jumped from $2.17 on July 2, 2025, to its all-time high of $3.6 on July 18, 2025. Now that volatility has fallen again, XRP could soon see a sharp rise or drop.

Bollinger Bands Show Volatility May Be Returning

Elsewhere, on the daily chart, Bollinger Bands recently tightened to levels last seen before the January 2026 rally. This tightening usually means the market is quiet, but it often comes before stronger price action. Recently, the bands have started to widen slightly, suggesting that volatility may be picking up again.

XRP Bollinger Bands and Historical Volatility

The Historical Volatility indicator also supports this. Specifically, it recently dropped to 27.57, its lowest level this year, before rising to 53.62. This increase shows that price movement is starting to return, but the direction of the sharp movement remains unclear.

However, data shows that since dropping to $1.1 on Feb. 6, XRP has been forming higher lows. From that level, it dropped to a floor of $1.27 on Feb. 28, then to $1.36 on March 23. This pattern shows that buyers are stepping in earlier each time the price dips. This gradual rise in support levels suggests growing interest from buyers.

Morgan Stanley Says Bitcoin Moves Result from Long-Term Planning, Not FOMO

0

Morgan Stanley says its expansion into crypto is not a reaction to market hype but the result of years of deliberate planning, with tokenization and infrastructure upgrades at the core of its long-term vision.

Key Points

  • Morgan Stanley’s crypto push is part of a long-term strategy, not a reaction to market hype.
  • The bank is expanding from limited exposure to full participation across trading and asset management.
  • It plans to introduce tokenized equities trading by late 2026.
  • Legacy financial infrastructure remains a major barrier to rapid adoption.
  • Stablecoins are emerging as a key real-world use case for blockchain in finance.

Gradual Entry, Not a FOMO-Driven Shift

Traditional finance is not diving into crypto out of fear of missing out, according to Amy Oldenburg of Morgan Stanley.

Speaking at the Digital Asset Summit, Oldenburg emphasized that major banks have been laying the groundwork for digital assets for years. Rather than reacting to recent market momentum, institutions are engaged in a steady effort to modernize financial systems.

Her remarks challenge the notion that Wall Street is only now catching up to crypto’s rise, instead framing the shift as a continuation of long-term strategic development.

From Limited Exposure to Broader Offerings

Morgan Stanley’s own trajectory reflects this measured approach. Initially, the bank limited its crypto exposure to indirect avenues, such as Bitcoin funds offered to select clients.

Over time, that cautious stance has evolved into broader participation. The firm now provides access to spot Bitcoin exchange-traded funds through its E*Trade platform and has taken a further step by filing plans to launch its own spot Bitcoin ETF.

As Oldenburg noted, these moves are part of a wider strategy that now includes trading, asset management, and infrastructure expansion.

Tokenized Equities Targeted for 2026

Building on this momentum, Morgan Stanley is preparing for the next phase of digital asset integration. Oldenburg said the bank aims to support tokenized equities trading in the second half of 2026.

This initiative will build on existing systems that already support equities, ETFs, and American depositary receipts. Consequently, the transition toward tokenized assets appears more practical and achievable.

The plan underscores how major financial institutions are approaching blockchain-based instruments in a structured, incremental way.

Legacy Infrastructure Still a Major Hurdle

Even as these plans take shape, significant technical challenges remain. Oldenburg emphasized the difficulty of upgrading long-standing financial infrastructure.

To move forward, banks must rethink how their systems operate, especially to enable faster settlement and continuous trading. This process requires revisiting core frameworks that have been in place for decades.

At the same time, she pointed to a disconnect between crypto startups and traditional institutions, noting that founders often underestimate the complexity and interconnected nature of banking systems.

Stablecoins Emerge as a Practical Use Case

Within this evolving landscape, stablecoins are gaining attention as a practical application of blockchain technology. Oldenburg highlighted their potential to enable faster, lower-cost transactions than traditional systems.

However, she stressed that widespread adoption will depend on coordination across the broader financial ecosystem. Given how deeply interconnected the system is, progress cannot occur in isolation.

Taken together, these developments suggest a long-term transformation rather than a rapid shift. Even though crypto prices remain under pressure, institutional activity continues to build.

Oldenburg described the current moment as an early stage in a much larger cycle. Her comments indicate that deeper integration between Wall Street and crypto will unfold gradually, supported by ongoing infrastructure and strategy development.

Ethereum Price Outlook for Mar 25: ETH Eyes $2,200 After Rebound and Surge in Buyer Activity

0

Ethereum rebounded from recent weakness as buyer demand returned, lifting bullish momentum and keeping the market focused on key resistance.

Ethereum (ETH) traded near $2,166 on the snapshot, up 0.5% over 24 hours, after rebounding from a sharp drop toward $2,105. The recovery pushed ETH back near the top of its daily range at $2,173, showing buyers defended lower levels effectively.

Short-term support appeared around $2,100-$2,110, while resistance stood near $2,170-$2,174. Although weekly performance remained negative at -6.6%, the 14-day and 30-day gains suggested broader recovery momentum was still intact.

Where’s Ethereum Headed?

Notably, Ethereum traded around $2,169 on the 4-hour chart, with price action showing a clear recovery from the recent low near the $2,025-$2,040 zone. The chart suggests ETH rebounded strongly from the lower end of the descending pitchfork structure.

Ethereum 4H Analysis

It then pushed back above the channel’s mid-range, signaling that buyers regained near-term control. A key technical takeaway is that ETH has now breached the upper boundary of the descending pitchfork.

The pitchfork had guided the recent corrective trend lower. As a result, a firm hold above this upper boundary would strengthen the case for a bullish breakout. It could also shift short-term momentum in favor of a move toward the $2,175-$2,200 area.

The Awesome Oscillator also supports the improving setup. Notably, the histogram has flipped back into positive territory, printing a reading near 18.72, which shows that bearish momentum has faded and bullish momentum is building.

The steady shift from deep red bars to rising green bars usually points to strengthening upside pressure. However, the smaller recent green bars suggest momentum should still confirm with follow-through.

Ethereum Buyers Are Back

Elsewhere, in his X commentary, CryptoJack said Ethereum buyers are returning to the market, pointing to a sharp rise in ETH net taker volume. According to the analyst, the metric reached $133 million, which marks its highest level since July 2022.

Ethereum Net Taker Volume

That reading suggests aggressive buyers are stepping in and lifting price momentum after a long period in which sell-side pressure dominated.

The chart shared alongside the comment shows green positive spikes in net taker volume reappearing after extended stretches of red negative readings. That means market buy orders are starting to outweigh market sales, a shift viewed as a bullish sign for Ethereum.

Cardano Founder Hails Midnight as NIGHT Cracks Top 10 With Over $1B Volume

0

IOG founder Charles Hoskinson has signaled accelerating momentum behind NIGHT, the native token of Midnight, as activity intensifies ahead of its anticipated mainnet launch.

Since its debut, NIGHT has consistently delivered strong market performances. This week, a sharp spike in trading volume drew Hoskinson’s attention, prompting him to frame the token as an emerging force within the crypto landscape. 

Key Points 

  • NIGHT surged into the top 10 cryptocurrencies by global trading volume, surpassing the $1 billion mark.
  • The asset outpaced major tokens such as Chainlink and even Cardano on this metric.
  • Charles Hoskinson marked the achievement as a sign of NIGHT’s growing influence, positioning it as an emerging force in the crypto space.
  • The crypto community is watching the anticipated mainnet launch of Midnight, expected to debut this week as a partner chain on Cardano.  

NIGHT Ranks Among Top 10 Tokens By Trading Volume 

Notably, Midnight recorded a major milestone this week. According to data shared by the Ssebi stakepool, NIGHT surged into the top 10 cryptocurrencies by 24-hour trading volume, surpassing $1 billion. 

As a result, NIGHT outperformed several leading assets, including Bittensor (TAO), Chainlink (LINK), Sui (SUI), and even Cardano (ADA). This surge reflects strong early demand and growing trader interest ahead of the network’s full launch. 

Top crypto assets by 24 hours Volume | CoinMarketCap
Top crypto assets by 24-hour Volume | CoinMarketCap

Cardano Founder Reacts

In response, Hoskinson amplified the moment using a cinematic metaphor. He shared a clip from “The Lord of the Rings: The Two Towers” in which Saruman declares the rise of a new power. Paired with the caption “Midnight Rises,” the message underscores the token’s rapid ascent and symbolic emergence. 

Notably, this is not NIGHT’s first breakout moment. Shortly after its December launch, the token surpassed a $1 billion market cap and remained among the top trending assets for several days. It also became the first Cardano-native token to secure a listing on Binance.

Meanwhile, recent data shows that NIGHT’s trading volume has climbed by over 20% in the past 24 hours to approximately $1.2 billion. Despite this surge in activity, price movement remains relatively modest, with a slight daily gain of 0.47%.

Imminent Launch of Midnight Mainnet 

For context, this momentum comes just days before Midnight’s expected rollout as a partner chain on Cardano. Notably, Hoskinson has branded the period as “Midnight Week,” actively preparing the community and building anticipation for the launch.

At its core, Midnight aims to introduce privacy-focused capabilities into the Cardano ecosystem. By leveraging advanced cryptographic techniques, the network aims to enable secure, confidential transactions, thereby expanding Cardano’s functional scope.

Nonetheless, while trading volume signals strong market attention, long-term success will ultimately depend on sustained adoption and real-world utility after launch. 

Swiss Banking Family Rift Erupts Over Bitcoin Strategy, Triggers Leadership Exodus

0

A dispute over digital asset strategy has split a prominent Swiss banking family and triggered senior leadership departures, according to Bloomberg. 

The disagreement focuses on how aggressively the group should pursue crypto integration and its long-term direction.

Key Points

  • Marc Syz left Syz Group, the Geneva-based private bank controlled by his father, Eric Syz, following disagreements about crypto expansion.
  • Longtime associate Richard Byworth also stepped down, signaling a significant leadership shakeup in alternative investments.
  • Syz Group, managing around $32 billion in assets, confirmed departures but emphasized alternative investments remain a strategic priority.
  • Marc Syz plans to list Future Holdings AG on both the Swedish and Swiss stock exchanges, aiming to build Europe’s largest Bitcoin platform.
  • He intends to acquire up to 3,500 BTC and launch a new asset management firm to compete with Syz Capital.

Leadership Split Over Crypto Strategy

At the center of the rift is Marc Syz, who has exited Syz Group, the Geneva-based private banking firm controlled by his father, Eric Syz. Tensions reportedly escalated over the pace and scale of expansion into digital assets.

Marc Syz departed alongside longtime associate Richard Byworth, marking a leadership shakeup across the firm’s alternative investment operations.

The dispute stemmed from a proposal to integrate crypto treasury firm Future Holdings AG into Syz Capital’s alternative assets division. However, board members cautioned that the plan involved considerable risk, and approval was ultimately withdrawn.

That reversal deepened internal strains. Following the decision, Marc Syz and Byworth also resigned from Syz Capital’s board, Bloomberg reported, citing conversations with the younger Syz.

New Bitcoin Platform and Listing Plans

After stepping away from the family group, Marc Syz redirected his efforts toward expanding Future Holdings independently. His immediate priority is preparing a dual listing of the company in Sweden and Switzerland.

To support the process, he is working with Stifel Financial Corp. as part of a broader scale-expansion strategy.

Marc Syz aims to build Europe’s largest Bitcoin-focused platform. As part of that vision, the company plans to accumulate up to 3,500 BTC.

Competing Asset Management Venture in the Works

In parallel, Marc Syz and Byworth are preparing another move. They intend to establish a new asset management firm operating independently of the family business. This venture will specialize in alternative investment strategies. It is also expected to compete directly with Syz Capital in the same segment, the report added.

Company Response and Business Background

Meanwhile, Eric Syz and Syz Group have offered limited public comment. The firm confirmed the leadership departures at Syz Capital but declined to address internal disagreements, emphasizing that alternative investments remain a core strategic priority.

Syz Capital itself was founded in 2018 under Marc Syz’s leadership. By the time of his exit, the unit managed about 2 billion Swiss francs, or roughly $2.5 billion.

The parent organization has a longer history. Established in 1996, Syz Group oversees approximately $32 billion in assets.