Home Blog Page 205

Bitcoin Open Interest Has Not Spiked Alongside the Latest Price Rebound: What Now?

0

The Bitcoin Open Interest has failed to recover at the same pace despite Bitcoin’s price recording a notable rebound push this month.

Bitcoin has now gained 23% from its February lows of around $59,900 amid an impressive recovery effort. However, market data shows that the Bitcoin Open Interest has not surged alongside price at the pace it should have, leading to concerns about the sustainability of the ongoing campaign.

Key Points

  • Since dropping to a floor of $59,930, the Bitcoin price has recovered 23%, as it currently attempts to establish dominance above $74,000.
  • However, while the price recovery has led to impressive gains in price, the Bitcoin Open Interest has failed to keep up.
  • Recently, the Bitcoin price spiked to a higher high of $74,800, but Open Interest only rose modestly to a lower high of $23.3 billion, confirming a concerning divergence.
  • Such divergence indicates that the ongoing recovery is not receiving any backing from the derivatives market, making it fragile.
  • Historically, periods of sustained price recoveries have often coincided with corresponding spikes in the Bitcoin Open Interest.

Bitcoin’s Recovery Eyes $74K

Verified CryptoQuant analyst Mac_D was first to point out this concerning divergence between price and OI as BTC attempts to recover some of the losses of the year. Specifically, Bitcoin has been staging a notable comeback since the Israel-Iran conflict broke out, and the effort recently picked up momentum. 

The rally first touched a high of $74,000 earlier this month before sliding back to $65,000 on March 8. Since this low, Bitcoin has put together eight straight intraday gains, working its way back above $73,000. 

The uptrend continues to run into strong resistance around the $74,000 level. However, despite the $74,000 ceiling holding firm, Bitcoin has gained 10% in March alone, putting it on track for its first positive monthly close since October 2025. 

Divergence Between Bitcoin Open Interest and Price

While the ongoing campaign looks strong on the surface, Mac_D warned that it may turn out to be a bull trap. He called attention to a divergence forming on the one-hour timeframe between the Bitcoin Open Interest and price, as futures traders appear unwilling to take on added risk despite spot prices climbing higher.

According to Mac_D, on-chain data also shows that long-standing investors are currently moving their holdings out while newer participants step in, pointing to a clear transfer of ownership. 

However, on a brighter note, accumulation addresses, representing wallets that have never sold their tokens, have continued growing in balance, which could mark a healthy sign for Bitcoin’s long-term direction. Nonetheless, the analyst insists that, overall, the short-term picture does not look very encouraging.

Why the Bitcoin Futures Market Carries Weight

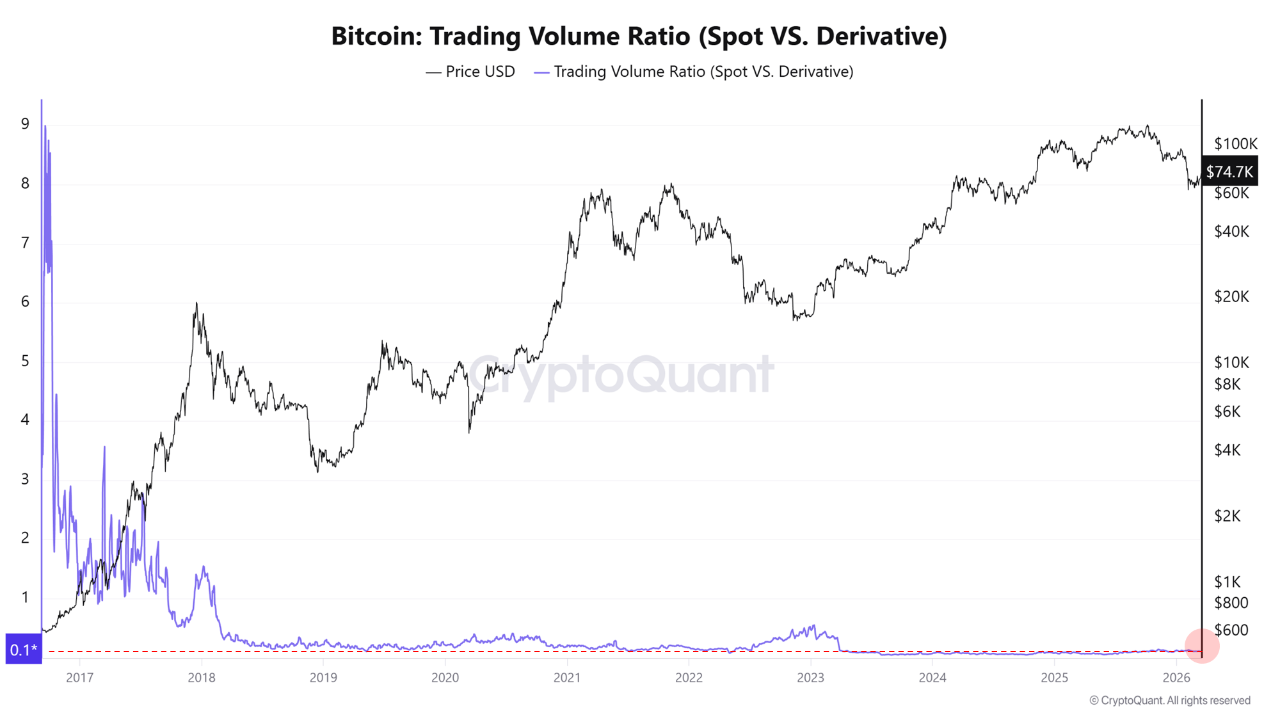
Speaking further, Mac_D highlighted a market reality that many observers have often overlooked. Specifically, since stablecoins began seeing broad adoption starting in 2018, the Bitcoin futures market has grown to roughly ten times the size of the spot market. 
Bitcoin Trading Volume Ratio CryptoQuant
Bitcoin Trading Volume Ratio | CryptoQuant

He argued that this gap is important because historically, a true bull market only takes hold when both the spot and futures markets show strength at the same time. The current setup, where spot buying leads while futures activity trails behind, does not meet that standard.

This makes the present divergence more concerning. Given the sheer size of the futures market, it can either give a price move legs or quietly pull the rug from under it. Essentially, when futures traders hang back, the market loses one of its biggest sources of upward fuel.

Historical Data Around Bitcoin Open Interest and Price Action 

Data from the accompanying chart confirms the relationship between the Bitcoin Open Interest and price recoveries. Specifically, when Bitcoin climbed from $39,500 in January 2024 to a high of $71,382 by mid-March 2024, Open Interest moved up alongside it, rising from $9.68 billion to $18.28 billion over that same period. 

Bitcoin Open Interest CryptoQuant
Bitcoin Open Interest | CryptoQuant

In addition, when prices then fell from that peak to $54,000 in early September 2024, OI dropped as well, pulling back to $15.1 billion during the same window. The same pattern of OI played out again in later cycles. Notably, Bitcoin’s push above $106,000 by late January 2025 came alongside Open Interest climbing to $36.75 billion. 

When Bitcoin then reached its all-time high of $126,000 in October 2025, OI hit its own peak of $47.583 billion at the same time. Since the October 2025 ATH price, Bitcoin’s price has trended lower, and OI has followed with steady declines.

Bitcoin Open Interest Seeing Lower Highs

The current recovery does not follow this historical pattern. Specifically, on March 4, Bitcoin price hit a peak of $72,600 while Open Interest topped out at $24.29 billion. 

More recently, the price climbed to a higher high of $74,800, yet OI only reached $23.3 billion, representing a lower high. Bitcoin’s price is printing higher highs while OI is printing lower highs, a setup that usually means the rally is being carried by spot buying with no meaningful support from the derivatives market.

When price rises, but OI lags, it generally means traders are not rushing to open new futures positions to ride the move. The rally may be coming from real demand or short covering rather than speculative leverage, which can point to a steadier early recovery. However, it also means the move has limited fuel behind it to keep going.

Two Paths Forward for Bitcoin

From here, Bitcoin faces two possible outcomes depending on how Open Interest behaves. In the first path, OI catches up to price, new leverage flows into the market, momentum builds, and price has the backing it needs to push higher, though with greater volatility risk. 

In the second scenario, the Bitcoin Open Interest stays weak, Bitcoin’s rally loses energy, and Bitcoin faces a slowdown or pullback as the move runs short of the leveraged demand it needs to keep it going. At press time, the available data does not yet lean toward either outcome.
PayPal Expands PYUSD Stablecoin to 70 Markets for Faster Global Payments and Lower Fees

Global payments giant PayPal is pushing deeper into crypto assets, announcing a major expansion of its stablecoin, PYUSD, to users across 70 markets worldwide. 

The move significantly broadens the reach of the company’s crypto offering beyond its initial U.S. launch in 2023.

Key Points

  • PayPal expands PYUSD to 70 markets, boosting global access to its stablecoin beyond its 2023 U.S. launch.

  • Users can send, receive, and spend PYUSD globally, with near-instant transfers and lower fees.

  • Expansion targets slow, costly cross-border payments, giving businesses faster access to funds.

  • Move signals digital dollars are entering mainstream finance and everyday global transactions.

PYUSD Goes Global

With the rollout, millions of users and merchants can now access PYUSD directly within their PayPal accounts. The stablecoin enables users to buy, hold, send, and receive funds globally. At the same time, it allows transfers to third-party crypto wallets or conversion into local currencies for spending.

The expansion spans regions including Europe, Asia-Pacific, North America, and Latin America. Countries such as Peru, Singapore, and the United Kingdom are among those gaining access.

However, availability varies by region. In Singapore, for example, PYUSD is currently limited to business accounts, while consumer access remains restricted.

Targeting Cross-Border Payment Inefficiencies

The expansion seeks to address long-standing inefficiencies in global payments. Traditional cross-border systems are often slow and costly, with settlement times stretching into days.

By contrast, PYUSD allows near-instant transfers and significantly lower fees. Users can also retain funds in a digital dollar format instead of being forced to convert into local currencies. 

For businesses, the benefits are equally clear. Merchants accepting PYUSD can access funds within minutes, improving liquidity and reducing reliance on outdated settlement cycles.

Stablecoins Gain Ground in Global Finance

Indeed, stablecoins have become one of the fastest-growing sectors in digital assets, with $321 billion in capitalization. 

Market leaders such as USDT and USDC dominate the space, with valuations of $184 billion and $79.5 billion, respectively. Meanwhile, PYUSD has also grown to a multi-billion-dollar market cap. At press time, it boasts a valuation of $4.089 billion.

The sector’s rapid expansion has drawn increasing interest from traditional finance players like Visa and Mastercard. Both are exploring stablecoin integrations to modernize their payment infrastructure.

PayPal’s latest move aims to make PYUSD a key part of global payments. By adding the stablecoin to its network of hundreds of millions of users, it’s turning its platform into a major hub for digital dollars.

Overall, this move highlights that digital dollars are moving beyond crypto platforms and into everyday transactions worldwide.

Shiba Inu Targets a 50+% Rally If It Breaks This Descending Trendline

0

Shiba Inu could target at least a 50% rally next if it can break above a key resistance neckline trendline on the daily timeframe.

Analysis shows that breaking out of this trendline is crucial for Shiba Inu (SHIB), as it represents a turnaround after earlier failed attempts. Furthermore, the resistance serves as a major barrier hindering the prominent meme coin from revisiting higher prices.

Key Points

  • SHIB broke cleanly above a “counter trendline” on March 13, after a push to an intraday high of $0.00000630, signaling bullish momentum is on its side.
  • With this initial barrier cleared, Shiba Inu can advance toward the next major resistance level around $0.0000070, which aligns with a longer trendline on the daily chart.
  • If this does happen, Shiba Inu could rally by at least 50% from that point, potentially reclaiming the $0.000010 psychological level.
  • On the weekly timeframe, SHIB is showing strength around the lower boundary of a falling wedge.

Shiba Inu Breaks First Barrier

World of Charts, a top market analyst, highlighted this Shiba Inu price trend in his recent X post. According to the commentator, SHIB just broke cleanly above what he described as a “counter trendline,” signaling bullish momentum is on its side.

A shared chart shows this happened on March 13, following a push to an intraday high of $0.00000630. Notably, this downward-facing line had suppressed SHIB’s price since the January 5 high of $0.00001009, before last week’s breakout.

Shiba Inu "Counter Trendline" Breakout/World of Charts
Shiba Inu “Counter Trendline” Breakout/World of Charts

Following the breach, the token appeared to retest the resistance, dipping to $0.00000578 on Sunday before rebounding to higher prices. The breakout momentum has sparked further upside, with the meme coin rising to $0.00000644 on Monday before stalling around the area.

With this initial barrier cleared, the analyst now expects Shiba Inu to advance toward the next major resistance level.

Major Resistance as Next Target

Specifically, this resistance aligns with a longer trendline on the daily chart, which first formed around the September 13 high of $0.00001484. After facing resistance near this peak, SHIB retraced and closed at $0.00001428. 

The resistance line formed from that price point and has since kept recovery attempts by the token at bay. For context, an upsurge to $0.00001009 in January halted at this neckline resistance, with bears taking over from there.

After defying the immediate “counter trendline,” the next target is now showing similar strength at this major resistance zone, around $0.0000070. If this does happen, the analyst expects a significant price impact. 

Specifically, he believes Shiba Inu could rally at least 50% from the breakout point to higher prices. From around $0.0000070, a 50% rally would take SHIB past the psychological $0.000010 level.

Shiba Inu Price On the Weekly Chart

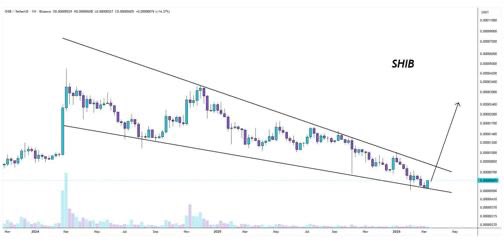
Meanwhile, a separate analysis by Leeron Shim offered a different perspective on the SHIB price through the lens of the weekly chart. On this timeframe, the token is showing strength around the lower boundary of a falling wedge.

Shiba Inu Weekly Chart Analysis/Leeron Shim

This development followed bullish price action last week, during which Shiba Inu recorded its first green candlestick on the timeframe since early January. The 12.3% bounce saw it find support around the structure’s lower support line, with bulls stepping in aggressively to defend this zone.

Nonetheless, the market watcher believes the price trajectory in the next two weeks will confirm this. If it keeps holding above this support by then, a fresh wave of bullish price action could ensue, marking the start of a full-blown market recovery.

Ripple Goes All-In on Brazil With Full-Stack Financial Expansion

0

Ripple is significantly expanding its footprint in Brazil, positioning itself as a one-stop provider of blockchain-based financial infrastructure in the country. 

According to a blog post, the company now delivers a complete institutional stack, covering payments, custody, stablecoins, prime brokerage, and treasury management, tailored to one of the world’s fastest-growing financial ecosystems. 

Key Points 

  • Ripple is accelerating its expansion in Brazil, positioning itself as a one-stop provider of blockchain-based financial infrastructure.
  • The company now delivers a full institutional stack, spanning payments, custody, stablecoins, prime brokerage, and treasury management.
  • It also plans to seek a VASP license from the Central Bank of Brazil. 
  • XRPL dUNL validator Vet emphasizes that stablecoins complement XRP, highlighting how Braza Bank’s BBRL uses XRP as a bridge currency on the ledger.

Ripple Deepens Commitment in Brazil 

This expansion marks a turning point in Brazil’s institutional finance landscape, as demand for efficient cross-border payments, digital asset infrastructure, and compliant financial tools continues to rise. 

Notably, Ripple confirms that it now provides a seamless, end-to-end financial stack by integrating its core offerings into a unified platform that supports the full lifecycle of institutional operations. 

Ripple Payments 

At the core of this ecosystem is Ripple Payments, which enables fast and transparent global transactions across more than 60 markets. Consequently, Brazilian institutions, including Braza Bank, Banco Genial, Azify, and Nomad, are already leveraging the network to streamline USD flows, enhance liquidity, and integrate stablecoins like RLUSD into settlement processes.

Ripple Custody 

Building on this foundation, Ripple confirmed that it had already introduced its enterprise-grade custody solution, Ripple Custody, to the region. This platform combines robust security with integrated compliance tools and tokenization, enabling institutions such as Justoken and CRX to manage and scale digital asset operations securely. 

Treasury and Brokerage Platforms 

In addition, Ripple strengthens its presence through prime brokerage services via Hidden Road, now rebranded as Ripple Prime. This offering gives institutions access to deep liquidity, multi-asset trading, and efficient clearing. At the same time, Ripple Treasury enables firms to optimize capital, manage risk, and execute real-time global payments more effectively.

RLUSD Stablecoin Gains Traction in Brazil 

Meanwhile, Ripple’s stablecoin, RLUSD, continues to gain traction across Brazil. The company notes that RLUSD has already surpassed a $1.5 billion market cap and is regulated under dual oversight from the Office of the Comptroller of the Currency (OCC) and the New York Department of Financial Services (NYDFS). Consequently, the stablecoin has become deeply integrated into the Brazilian market.

Currently, platforms such as Foxbit, Mercado Bitcoin, Attrus, Banco Genial, and Braza Bank support RLUSD, providing millions of users across Latin America with access to a regulated, enterprise-grade digital dollar.

It’s worth mentioning that these offerings form a fully integrated financial ecosystem. Therefore, Ripple claims to be the only provider in Brazil capable of delivering end-to-end institutional solutions, ranging from payments and custody to trading and treasury management. 

Stablecoin Complements XRP Role 

Although the blog post highlights RLUSD’s role in Brazil, it does not mention XRP, which has fueled concerns that the stablecoin could threaten the token. 

However, XRPL dUNL validator Vet rejects this narrative, stressing that the Brazilian real-backed BBRL, issued by Braza Bank, actively uses XRP as a bridge currency on the network’s decentralized exchange.

At first glance, the rise of stablecoins like BBRL may appear competitive. However, the mechanics of the XRP Ledger show otherwise, as stablecoins and XRP function in a complementary, not conflicting, role, according to Vet.

Ripple Seeks to Obtain VASP License in Brazil 

In the meantime, Ripple plans to apply for a Virtual Asset Service Provider (VASP) license with the Central Bank of Brazil (BCB). This move reinforces its compliance-first approach and signals a long-term commitment to the region, one that could further accelerate Brazil’s emergence as a global leader in the digital asset economy. 

XRP Chart Shows How Many Cycles Must Pass Before Rally Above $100

0

XRP chart data projects that the crypto asset could pass through five cycles before eventually surpassing the $100 price milestone.

While XRP still trades below the $2 level, sitting more than 57% under its all-time high of $3.6 reached in July 2025, some market watchers remain confident that the crypto asset can eventually reach $100, representing a potential 6,478% increase from the current price of $1.57.

Interestingly, a recent analysis suggested that, although this target is achievable in the long run, XRP may have to pass through five different market cycles before it can claim the milestone, potentially reaching a peak value of $153 by Cycle 5.

Key Points

  • XRP continues to trade below the $2 psychological mark, down 57% from its July 2025 all-time high of $3.6.
  • Despite the current price struggles, market commentators insist that XRP has the potential to reach $100, marking a 6,478% rise from current levels.
  • Recent chart data indicates that XRP may have to pass through five different cycles before reaching the $100 milestone, possibly hitting $153 in Cycle 5.
  • Some market watchers believe factors such as XRP ETFs, institutional interest, and utility in payments make XRP to $100 feasible in the long run.
  • For the short term, XRP could first drop below the $1 mark before eventually recovering from the ongoing downtrend to new heights.

Five XRP Cycles Toward $153

Market analyst Tara recently discussed these ideas during her latest XRP analysis. Notably, she presented a long-term projection, but stressed that it focuses on price targets, not timelines. The market analyst insisted that her estimates were actually simple and conservative, but that they would be adjusted over time as new data comes in. 

Based on her model, XRP may need up to five major cycles before it can move above $100. Each cycle would include its own rise, pullback, and consolidation phase, possibly stretching over several years. 

According to her breakdown, Cycle 1 peaked at $3.65, which XRP already reached in July 2025. Cycle 2 is projected to be around $8.68, followed by $22.5 in Cycle 3. Cycle 4 points to about $59, while Cycle 5 could take the price to roughly $153, marking the first move above $100.

XRP 12M Chart Tara
XRP 12M Chart | Tara

Other Analysts Eyeing XRP to $100 Target

Besides Tara, other analysts have recently spotlighted the $100 target. Last month, EGRAG Crypto discussed the possibility of XRP reaching $100, but through a different technical analysis. Specifically, he called attention to a long-term “Nike Swoosh” pattern that began forming after the 2017/2018 market peak and has continued to develop over the years.

According to him, XRP could first climb to a range between $11 and $13, then move toward $23 to $27, before eventually reaching $100. 

While critics have expressed doubt, other market commentators continue to defend the idea. For instance, Ghost, a pseudonymous analyst, highlighted XRP’s long period of consolidation, the approval of spot XRP ETFs, its use in cross-border payments, and growing institutional interest following regulatory clarity as factors that could trigger a run to $100.

Speaking further, he also mentioned XRP’s history of delivering large gains that once seemed unlikely, insisting that a move toward $100 is still possible under the right conditions.

XRP Short-Term Outlook Still Points Lower Before a Rally

Despite the bullish long-term outlook, near-term expectations remain cautious. Tara noted that XRP could still drop before making a move to new highs. She explained that if the price breaks above $1.47 while Bitcoin trades in the $75,400 to $79,000 range, XRP might rise to around $1.88 before turning lower again and falling toward $0.87.

EGRAG shares a similar short-term view. He suggested that XRP could decline to around $0.91 as part of a final corrective move in an ABC pattern. This drop would complete a broader triple bottom setup before the asset is ready for a stronger upward move.

XRP Triple Bottom Nears Completion: Top Analyst Shares What Comes Next

0

XRP is quietly approaching a critical moment in its long-term structure, as recent price behavior suggests a rare formation may be nearing completion. 

Notably, XRP has shown bullish momentum over the past few days, rallying considerably to reach an over-one-month high of $1.60. While short-term volatility continues to dominate proceedings, a broader view of the chart reveals a pattern that has been developing over several months.

Key Points

  • XRP is quietly approaching a critical moment in its long-term structure, as recent price behavior suggests a rare formation may be nearing completion
  • The current structure resembles a triple-bottom pattern spanning multiple phases within a broader ABC formation.
  • The current phase is a corrective sequence, with prices gradually moving through what could be the final leg of this structure.
  • A key area to watch sits near the $0.91 region, as it aligns with previous demand, a major Fibonacci retracement level, and the lower boundary of the broader structure.
  • While the lower range defines potential support, the first sign of structural strength sits at the $1.65 price level.
  • Reclaiming this level on a higher timeframe would suggest that XRP has broken the descending structure.

XRP Shapes Within Rare Multi-Cycle Structure

Market technician EGRAG Crypto highlighted that from a macro perspective, XRP appears to be forming a multi-cycle base, with price repeatedly stabilizing at a similar price level before attempting to move higher. These types of formations tend to emerge over extended periods and often signal a transition phase.

When zoomed out, the current structure resembles a triple-bottom pattern spanning multiple phases. Each base reflects a period where selling pressure weakened and demand began to stabilize price action. Over time, this creates a foundation that can support a larger directional move if confirmed.

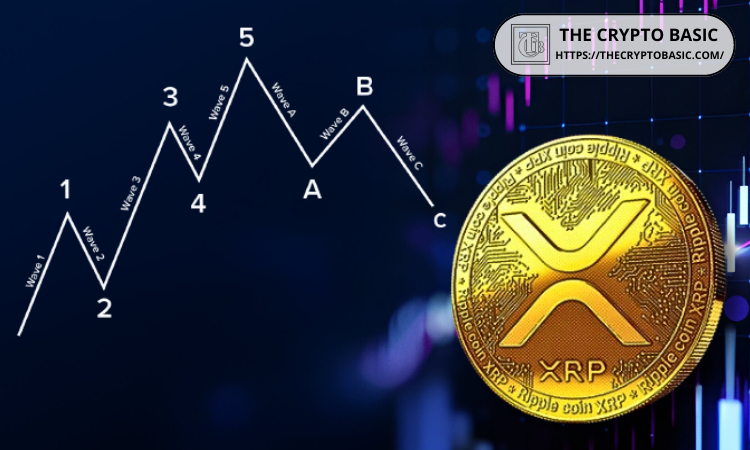
Meanwhile, EGRAG noted that XRP appears to be nearing the final phase of this formation. The current phase is a corrective sequence, with price gradually moving through what could be the final leg of this structure. This has seen XRP trade within a descending wedge in a broader ABC pattern.

For context, wave A formed when XRP dropped from its January 2025 peak of $3.39 in January 2025 to $1.61 in April 2025. The B wave followed, pushing the coin back to its current ATH of $3.6 in July 2025. The final C wave is currently in play within the descending channel.

XRP Rare Multi-Cycle Formation/EGRAG Crypto

Key Levels to Watch

According to EGRAG, a key area to watch sits near the $0.91 region. This zone aligns with previous demand, a major Fibonacci retracement level, and the lower boundary of the broader structure, making it a crucial level for prices. If the XRP price revisits this area, it could act as a final bottom before a shift in momentum.

While the lower range defines potential support, the first sign of structural strength sits much higher. The market technician noted that moving above $1.65 is the first macro signal that a bullish reversal is on course.

Reclaiming this level on a higher timeframe would suggest that XRP has broken the descending structure, indicating that the prolonged corrective phase may be ending. In many cases, this type of shift marks the transition from consolidation into a new upward phase.

If that transition unfolds, the broader structure begins to open toward higher targets, guided by long-term cycle dynamics. EGRAG’s chart shows a possible breach of the major resistance at $3.53 before a sustained move towards the 1.618 Fibonacci level at $0.64.

XRP Risk for $0.70 Crash Still Remains Until This Happens

XRP is showing renewed short-term strength, but analysts warn that a deeper correction remains possible.

At the time of writing, XRP trades around $1.50, posting a 2.5% gain in the last 24 hours and nearly 6.85% over the past week. Notably, XRP touched $1.60 today for the first time since February before slightly retracing.

This momentum has pushed XRP’s market cap back above $90 billion, allowing it to overtake BNB and reclaim its position as the fourth-largest cryptocurrency globally.

The move comes after a strong recovery from February lows, when its valuation dipped to around $73 billion. However, despite this bullish resurgence, technical risks persist.

Key Points

  • XRP shows short-term strength but risks a drop to $0.70–$0.80 remain.

  • Key resistance at $1.80–$2.40 must break for bullish momentum to continue.

  • Analysts argue that a relief rally is possible, but a deeper correction remains a risk.

  • Bulls eye $6–$10 targets, yet bearish market may cap near-term gains.

Major Resistance Still Unbroken

According to analyst ChartNerd, XRP still faces the possibility of dropping toward the $0.70–$0.80 range if it fails to break above major resistance zones at $1.80, $2.00, and $2.40. XRP last traded in this range in January and subsequently touched lows at $1.11 before the ongoing recovery.

ChartNerd’s analysis highlights a rejection zone around $1.80, where XRP has repeatedly failed to sustain upward momentum. Until XRP reclaims this level and the higher-resistance bands, its structure remains vulnerable.

In the near term, XRP is forming a consolidation pattern after its recent pullback, with price action hovering just above $1.50. While this could lead to a breakout attempt, failure to hold current levels may trigger further downside.

Image

Mixed Signals From Analysts

Other market watchers share a similar near-term outlook for XRP. Analyst Doctor Profit recently disclosed taking short-term long positions, expecting a temporary relief rally.

He previously entered an XRP position around $1.34, citing oversold conditions based on the Relative Strength Index (RSI). The rebound he projected seems to have already unfolded, as XRP has touched $1.60 today.

At the same time, he cautioned that this upside may not last, warning of a potential massive market correction. His outlook aligns with ChartNerd’s view that downside risks remain until XRP breaks through critical resistance.

Technically, XRP’s current structure places it at a crossroads. A successful reclaim of the $1.80–$2.00 region could shift momentum in favor of bulls and open the path toward higher targets.

Conversely, continued rejection below these levels may confirm a deeper retracement toward the $0.80 support zone. Meanwhile, analysts consider this potential outcome a major buying opportunity.

$6 XRP Next “At Least”

Last week, analyst Casi Trades disclosed setting a buy order for XRP between $0.80 and $0.90, arguing that a rebound to its all-time high could follow, with $6 considered a conservative target.

Separately, analyst Crypto Bull has called for $10 XRP, even suggesting that prices could rise to $28 and beyond. However, these bullish outlooks face challenges amid the ongoing bearish market, with XRP experiencing more dips than pumps.

Bernstein: Long-Term Ownership Trend Makes Bitcoin Less Vulnerable to Sell-Offs

0

Bitcoin recent price recovery is supported by a growing base of long-term investors and steady institutional inflows, according to a new research note from Bernstein.

This evolving ownership pattern is gradually reinforcing the asset’s stability, even as global uncertainty continues to weigh on traditional markets.

Key Points

  • Bernstein reports nearly 60% of Bitcoin’s supply has remained inactive for over a year, signaling growing dominance of long-term holders.
  • Bitcoin gained ~6% last week, and Ethereum rose ~14%, outperforming gold and major equity indices amid global tensions.
  • U.S. Bitcoin ETFs saw three consecutive weeks of inflows of over $2.1 billion, reflecting rising institutional interest.
  • Bernstein notes corporate accumulation is significant, with Strategy acquiring over 66,000 BTC year-to-date, investing $5.6 billion at an average price near $85,000.
  • Large holders, including ETFs, exchanges, and public companies, now control more than 3.75 million BTC, worth over $201 billion, reinforcing market stability.

Bitcoin Outperforms Traditional Assets Amid Global Tensions

Against this backdrop, Bitcoin delivered a weekly gain of about 6%, while Ethereum climbed roughly 14%. Bernstein noted that both cryptocurrencies outperformed gold and major equity indices during the same period.

Notably, these gains came despite escalating geopolitical tensions in the Middle East. This contrast has drawn attention to Bitcoin’s unique characteristics.

According to Bernstein analysts, its borderless nature and high liquidity make it attractive in uncertain times. They also highlighted its lack of counterparty risk, which can further strengthen investor confidence during global disruptions.

Shift Toward Long-Term Ownership Reshapes Market Dynamics

While price performance has improved, underlying ownership trends are also undergoing a meaningful shift. Bernstein highlighted that nearly 60% of Bitcoin’s total supply has remained inactive for more than a year, signaling the growing dominance of long-term holders.

Percentage of BTC Supply Last Active Over an Year Ago
Percentage of BTC Supply Last Active Over a Year Ago

Consequently, the market is becoming less reliant on short-term trading activity. With more Bitcoin held in long-duration positions, sudden sell-offs may have a reduced impact on prices. 

At the same time, increasing allocations into ETFs, corporate treasuries, and low-activity wallets are reinforcing this shift. Together, these factors are contributing to a more stable and resilient market structure.

ETF Inflows and Institutional Capital Drive Stability

Building on this trend, institutional participation continues to expand. According to data from SoSoValue, U.S. spot Bitcoin ETFs have seen inflows for the third week in a row, with the cumulative amount exceeding $2.1 billion.

Bernstein attributed these inflows to rising allocations from wealth managers and large institutional investors, including pension and sovereign funds. This steady capital movement suggests growing long-term confidence in the asset.

At the same time, earlier ETF outflows have begun to reverse. Net withdrawals have narrowed to around $460 million, compared with roughly $92 billion in total assets under management.

Supporting this trend, CoinGecko’s pricing data shows Bitcoin trading near $74,210, reflecting a weekly gain of over 5%.

Corporate Accumulation Adds to Long-Term Confidence

In parallel with ETF demand, corporate accumulation is emerging as another key pillar of support. 

Strategy has continued to expand its Bitcoin holdings throughout the year. According to Bernstein, the company has acquired 66,231 BTC year-to-date, investing approximately $5.6 billion at an average price near $85,000.

More recently, between March 9 and 13, the firm purchased an additional 22,337 BTC for $1.57 billion, bringing its total holdings to over 761,000 BTC.

At current market prices, these reserves are valued at approximately $57.61 billion, underscoring strong corporate conviction in Bitcoin’s long-term potential.

Large Holders Dominate Bitcoin Supply Distribution

Taken together, these developments point to a concentration of Bitcoin ownership among large, long-term holders.

Data from Bitcoin Treasuries indicates that ETFs and exchanges collectively hold around 1.6 million BTC, worth more than $118 billion. Meanwhile, public companies control approximately 1.18 million BTC, valued at about $87 billion.

This growing institutional footprint reflects a structural shift in the market. As more supply moves into long-term hands, the influence of short-term trading continues to diminish, further reinforcing Bitcoin’s evolving role as a more stable asset.

XRP Latest Rally Fuels $618K Gains for Major Trader With $7.73M Long Position

0

A large crypto trader known as Auros has captured the attention of the XRP community after opening a sizable leveraged long position in the token. 

The position, valued at $7.73 million, is already in significant profit. Despite these gains, the trader remains confident.

Key Points

  • A major trader, Auros, holds a $7.73 million long position in XRP.
  • The trader entered the position at around $1.39 and has already realized gains exceeding $618,000.
  • The transaction suggests roughly 2x leverage, avoiding an overleveraged position.
  • XRP trades at $1.53, with total liquidations reaching $12.79 million over the past 24 hours.

Trader with Massive XRP Long Bets Faces $618,000 in Unrealized Profit

The XRP position held by the pseudonymous trader Auros continues to draw interest across the community, not only for its size but also for its structured approach. The trader opened the trade at $1.39, and the position has already generated over $618,000 in unrealized profit.

Notably, the trade has no defined liquidation price, highlighting relatively low leverage exposure. With a total account value of $15.93 million and a notional position size of $7.73 million, it suggests the trader may be using roughly 2x leverage, avoiding an overleveraged position.

Image

“Smart Money Don’t Panic”

The move has sparked discussion among XRP proponents. A community figure, Xaif, described the strategy as a “smart money” approach, in which traders enter at favorable levels and let trades develop without reacting emotionally to short-term volatility.

Moreover, the lack of a visible liquidation level suggests the trader managed the position conservatively. This reduces the risk of forced liquidation during market swings and may further reflect confidence in XRP’s upside potential.

XRP Revisits $1.5 as Liquidation Tops $12.79M

Meanwhile, this development aligns with a recent rebound in XRP’s recent price rebound. After facing sustained pressure, the token recovered and climbed to $1.60 earlier today before retracing to $1.53.

Despite the slight pullback, short traders were dealt a heavy blow, accounting for $9.06 million of the $12.79 million in leveraged liquidations recorded over the past 24 hours.

Nonetheless, analysts still expect the uptrend to continue, potentially driven by increasing adoption. This momentum is evident as the XRP Ledger reaches a 13-year high of 7.7 million non-empty wallets.

Moreover, active addresses have surged to a five-week high of 46,767, further signaling rising user participation and strengthening network activity.

Image

Coinbase XRP Orderbook Shows It Is Now 9x Easier to Push XRP to $2.25 Than $0.75

0

The XRP orderbook on Coinbase shows it is now about nine times easier to push XRP to $2.25 from the current price than to take it to $0.75. 

The current XRP orderbook structure shows an imbalance that favors upward movement. Data reveals that buy-side liquidity massively outweighs sell-side liquidity within a 50% price range, making it relatively easier to push XRP from the current price of $1.5 to $2.25 than it is to take it to $0.75.

Key Points

  • The XRP orderbook on Coinbase shows a 9:1 bid-to-ask ratio within a 50% price range at $1.5, marking the strongest buy-side skew in nearly one year.
  • Sell-side liquidity above $1.50 up to $2 remains thin, leaving a relatively open path toward higher price levels.
  • Meanwhile, XRP sees strong and layered buy walls below $1.5, especially between $1.4 and $1.2, that could cushion any price declines.
  • As a result, driving the XRP price from $1.5 to $2.25 is currently 9x easier than pushing it to $0.75.

XRP Faces Weak Resistance and Strong Support

This is according to recent data shared by order book expert Dom. Notably, his accompanying Coinbase chart covers the period from March 13 to March 17, showing four days of price movement and liquidity activity, as XRP initially dropped toward $1.45 before recovering to trade above the $1.53 level.

Data from the orderbook heatmap indicates that above the current price, the area between $1.5 and $2 shows few sell orders. The lack of resistance suggests that the price can move upward more easily, as there are fewer barriers to slow it down. 

However, below the current price, the situation is very different. Specifically, the heatmap indicates that the area from $1.4 down to $1.2 features strong buy-side liquidity. Some of the most important support zones appear around $1.38 to $1.4, which also held as support during the earlier consolidation phase. 

Extreme 9:1 Bid Skew Shows Strong Bullish Setup for XRP

In his recent analysis, Dom focused on the orderbook structure within a 50% price range around the current level. This range covers about $0.75 on the downside and $2.25 on the upside, based on the $1.50 price level. 

XRP Orderbook Suite on Coinbase Dom
XRP Orderbook Suite on Coinbase | Dom

Within this range, the data shows the strongest bid skew seen in nearly one year on Coinbase’s XRP spot market. Specifically, the current bid-to-ask ratio stands at around 9:1. This means that for every $1 of sell orders above the price, there are about $9 of buy orders below it. 

For context, in a balanced market, this ratio would be near 1:1, while even a slightly bullish market might show 1.5:1 or 2:1. Essentially, a 9:1 ratio shows a very strong advantage for buyers.

Now, for XRP to drop to $0.75, sellers would need to push through large buy walls at $1.40, $1.35, $1.30, $1.25, $1.20, and lower levels. Each of these levels represents strong demand. On the other hand, a move toward $2.25 would require breaking through a much thinner layer of sell orders, making the upward move easier.

What Does This Mean for XRP?

The recent price recovery and strong bid skew confirm that XRP currently witnesses a bullish setup. Notably, there is limited resistance above the current price and strong support below, which gives the market a better chance of moving higher, possibly toward $2.25.

However, it is important to stay cautious. Orderbook data only shows current limit orders, and traders can manipulate these orders at any time. Even with the strong 9:1 imbalance, the conditions can change quickly. Despite this