Home Blog Page 223

XRP Currently Offers a Strong Risk:Reward Setup as Downside Fuel Nearly Gone

0

The current XRP position could offer one of the strongest risk:reward setups as downside fuel continues to deplete.

XRP has witnessed one of its longest stretches of downward price action, having recorded five consecutive monthly red candlesticks, a bearish development that last played out in late 2016 to early 2017.

Within the past five months, XRP has collapsed more than 52% to the current price of $1.36. However, market data shows the current XRP price position could present a strong risk-to-reward ratio, as the downside fuel that has pushed prices lower over the past few months may be close to exhaustion.

Key Points

  • XRP has recorded five consecutive red monthly candles for the first time in nine years, down 52% within this period, as downward pressure intensifies.
  • During the downtrend, XRP filled all its previous wicks, including the one recorded in the Oct. 10 crash.
  • Market data shows that the downside fuel may now be close to exhaustion if the XRP market is really in a HTF bullish setup.
  • As a result, the current position could offer one of the best risk-to-reward setups for investors, but a drop below $1.2 could invalidate it.
  • The XRP price would have to reclaim the $1.61 price level and breach its diagonal resistance trendline for the bullish case to strengthen.

XRP’s Lower Wicks from Feb to Oct 2025

This current position was recently highlighted by TraderJB, a crypto market watcher, as the XRP price struggles to recover from the persistent downward pressure. 

JB confirmed that amid the downtrend, XRP has filled all the previous wicks it made after the November 2024 upsurge that pushed prices above $1 and $2. For context, following the rally to $3.4 in January 2025 and the subsequent push to $3.6 by July of that year, XRP recorded multiple wicks as prices quickly dropped to lower levels.

Notably, on the 3-day timeframe, these wicks appeared during the drops to $1.90 in December 2024, $1.77 in February 2025, $1.61 in April 2025, and then $1.25 during the Oct. 10, 2025, crash. 

For the uninitiated, these lower wicks often appear when sellers drive a sharp price drop, but buyers quickly push it back up. They specifically indicate areas where the market briefly explored a price level but did not stay there for long.

XRP Has Filled All Previous Lower Wicks.

When an asset fills a wick, this means the price later returns to that same range and trades through it again. This is important because wick zones can contain liquidity, stop-loss orders, or untested support and resistance levels. 

As a result, prices often revisit these areas to complete unfinished trading activity, which can help confirm stronger support if the wick was lower and then provide clearer signals for future market direction.

According to JB, XRP has now filled all the previous lower wicks formed from February to October 2025. This happened as the price continuously dropped to levels around $1.9, $1.7, $1.6 and $1.1 during the ongoing downtrend. XRP revisited these levels to complete the unfinished trading activity.

XRP 3D Chart TraderJB
XRP 3D Chart | TraderJB

XRP Offers Favorable R:R Ratio

Speaking further, JB then stressed that he does not expect much additional downward price action from here, as the downside fuel may be thinning out if XRP really maintains a high-timeframe bullish environment.

Notably, he confirmed that XRP made an initial attempt to flip the trend bullish when it rose to $1.61 last month, but faced resistance at this level. The market analyst stressed that he expected this. Now, he believes it remains possible that XRP could again retest the $1.25 low and a downward gray demand zone before building strength for another upward push.

JB emphasized that XRP must breach the $1.61 resistance and push above a descending trendline that has persisted since the drop from $3.6 in July 2025. He noted that doing this would strengthen the bullish case for XRP, potentially flipping the trend to a favorable position.

However, despite the current situation, JB insists that XRP currently offers one of the strongest risk-to-reward ratios for investors looking at a long-term opportunity. Nonetheless, if the price drops below the gray demand zone around $1.2 when XRP pushes to retest it, this would invalidate the bullish outlook.

BitMEX Activates Bitcoin UTXO Containing 13,280 BTC Worth $930M—What Is Happening?

0

A large on-chain Bitcoin (BTC) movement involving crypto exchange BitMEX has drawn attention across the cryptocurrency market. 

The transaction saw a wallet linked to BitMEX activate a UTXO containing 13,280 BTC. At the current price of $70,000 per coin, the on-chain activity represents nearly $930 million in value moving across the blockchain.

Key Points

  • A recent transaction saw a wallet linked to BitMEX activate a UTXO containing 13,280 BTC earlier today.
  • This pattern frequently appears when exchanges adjust internal wallet balances, shift funds between cold and hot storage, or settle operational liquidity needs.
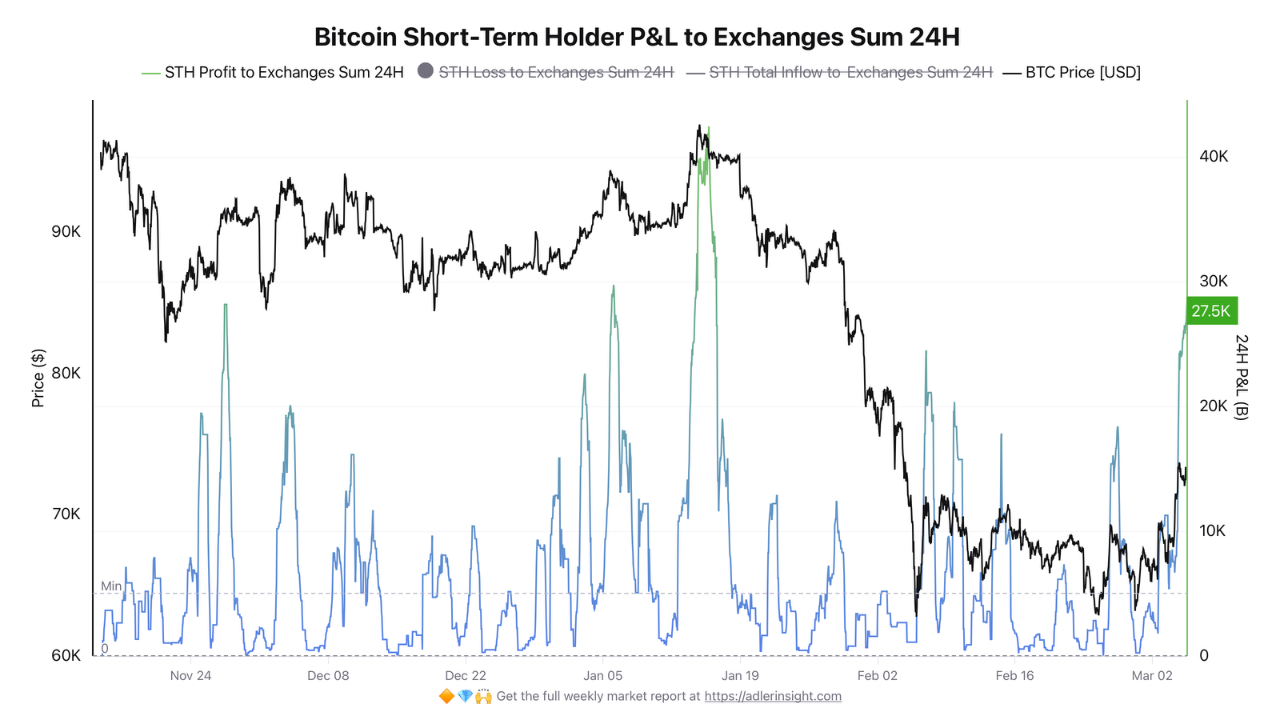
  • Data shows an increased selling pressure among Bitcoin short-term holders (STHs), with 27,000 BTC moved in the past 24 hours.

What Happened

CryptoQuant verified author J.A. Maartunn highlighted the transfer in a March 6 X post using the Bitcoin Spent Output Age Band. He identified a sharp spike in the “1 day to 1 week” spent output age band, showing that the crypto exchange activated a UTXO containing thousands of BTC earlier today.

For context, Bitcoin stores balances as unspent transaction outputs (UTXOs), each created by a previous transaction. As such, a created UTXO remains idle until the wallet uses it in a new transaction.

Here, BitMEX activated a UTXO containing 13,280 BTC, raising eyebrows among market observers. At the time of writing, the reason for this move remains unclear, but it is notable because it comes as Bitcoin struggles to defend the $70,000 price level.

Additional Context from the Bitcoin UTXO Band

A shared chart highlights a noticeable increase in the 1-day-to-1-week age band of unspent UTXO by a wallet tied to BitMEX. Notably, this band measures how long coins remained inactive before being spent.

Bitcoin Spent Output Age Band/CryptoQuant

In this case, the data indicate that the Bitcoin involved had only been idle for a short period, roughly between one and seven days, before being used again in a new transaction. As a result, it shows that it was not long-dormant coins that suddenly entered the market. Instead, it is a recently created UTXO from an earlier BitMEX transaction that was quickly reused. 

Notably, this pattern frequently appears when exchanges adjust internal wallet balances, shift funds between cold and hot storage, or settle operational liquidity needs. While the possibility remains, it is not a direct indication of selling activity on BitMEX.

STH Selling Pressure Emerges

A separate market metric indicates that, other than BitMEX, other market participants have also been making notable moves. Another CryptoQuant disclosure shows increased selling pressure among Bitcoin short-term holders (STHs)

The Friday tweet cited the STH P&L to Exchange Sum to show that short-term holders have sent over 27,000 BTC to exchanges over the past 24 hours at a profit. According to the analysis, this move is one of the largest recorded in recent months.

Bitcoin STHs P&L to Exchanges/CryptoQuant

Meanwhile, the heavy sales come as Bitcoin briefly touched $74,000 this week before giving back some of the gains. The pump placed holders who bought between one week and one month ago in profit. With a realized price of $68,000, these STHs sold at higher prices, reflecting their sentiment that the rally might be temporary.

Vancouver Staff Say Bitcoin Reserve Plan Violates Law, Urge Council to Drop Proposal

A proposal to add Bitcoin to Vancouver’s municipal reserves has hit a legal wall, with city staff advising council to abandon the initiative entirely.

The recommendation comes ahead of a March 10 council meeting, where officials will consider closing a 2024 motion that explored turning Vancouver into a “Bitcoin-friendly city.”

The plan was championed by Mayor Ken Sim, who had pushed for the city to study allocating part of its financial reserves into the digital asset. However, a legal review concluded that the city cannot legally hold Bitcoin as a reserve asset under existing municipal laws.

Key Points

  • Vancouver staff say the Bitcoin reserve plan violates the law, urging council to drop the proposal.

  • Mayor Sim’s 2024 plan to diversify city funds with Bitcoin faces legal barriers.

  • Current rules allow only safe assets, such as bonds and deposits, but not crypto.

  • Bitcoin could still serve payment use, but not for holding it in reserves.

Legal Framework Blocks Bitcoin Investment

According to the staff report, the city’s governing legislation strictly limits the types of assets municipal funds can invest in.

Under the Vancouver Charter, the city can only invest idle funds in a small range of traditional options, like government securities, municipal bonds, bank-guaranteed investments, credit-union deposits, and certain pooled funds.

The Municipal Finance Authority Act of British Columbia also limits municipal investment pools to safe assets, such as government bonds, highly rated commercial paper, and bank deposits.

Since cryptocurrencies, stocks, and commodities aren’t included, staff concluded that Bitcoin cannot legally be part of the city’s reserve funds. The report says officials “conclusively determined” that Bitcoin is not an allowed investment under current rules.

Bitcoin-Friendly Vision Faces Structural Limits

Mayor Sim’s proposal, first introduced in late 2024, aimed to diversify the city’s financial reserves and protect purchasing power by adding exposure to Bitcoin. He had previously described the cryptocurrency as one of the most important inventions in modern finance and even pledged to donate $10,000 worth of Bitcoin to the city.

The proposal’s failure shows the challenge for public institutions. Municipal treasuries focus on preserving capital, using low-risk, stable investments. Until laws change, cryptocurrencies like Bitcoin can’t be included in city reserves.

Bitcoin Payments Still a Possible Option

While holding Bitcoin in reserve appears legally impossible for now, the city might still accept it for payments. The Vancouver Charter regulates investments, not how payments are made. Residents could eventually pay taxes or fees in Bitcoin, as long as it’s quickly converted to Canadian dollars.

Notably, the plan to create a Bitcoin reserve will likely end when the council votes on the staff recommendation next week.

Bitcoin Loses 1,000 Pivot Against Silver: What Followed the Last Time This Occurred in 2022

0

Bitcoin has lost a major support level against silver, and this has raised concerns about its relative strength compared to the precious metal. 

After reaching a peak of $126,000 in October 2025, Bitcoin (BTC) began trending downward, while silver (XAG) continued to gain ground. As a result, the Bitcoin-to-silver ratio has dropped significantly since August 2025, breaking below the long-standing pivot of 1,000 ounces of silver per Bitcoin.

Market data shows that this level previously played a major role in Bitcoin’s past market cycles. The last time the ratio fell below the 1,000 pivot was during the 2022 bear market, when the crypto sector faced heavy pressure. 

Key Points

  • Market data shows the BTC/XAG ratio fell from 3,152 in August 2025 to 829 today, marking a 73.7% decline as silver outperformed Bitcoin.
  • Bitcoin dropped below the 1,000 ounces of silver pivot in January, and repeated attempts to reclaim the level between Jan. 30 and Feb. 8 failed as the level turned into resistance.
  • BTC previously broke below the same pivot in November 2022 during the bear market that followed the FTX collapse, when prices fell to $15,479.
  • After the breakdown, Bitcoin briefly dropped to 688 ounces of silver in December 2022 before recovering strongly in early 2023.
  • The crypto asset later surged from 1,107 XAG in February 2023 to 2,973 XAG by March 2024, and a similar rebound this time could push prices higher.

Bitcoin’s Weak Run Against Silver Since August 2025

Bloomberg Strategist Mike McGlone recently discussed this divergence in performance between Bitcoin and silver. He confirmed that Bitcoin has now fallen below its most important pivot level against silver, which sits at around 1,000 ounces of silver per Bitcoin. According to him, the market may now treat this level as resistance.

Speaking further, McGlone explained that large pullbacks often happen in volatile assets like silver and Bitcoin after strong rallies, especially when market momentum slows.

Bitcoin Against Silver Bloomberg Intelligence
Bitcoin Against Silver | Bloomberg Intelligence

 He noted that as of March 5, one Bitcoin equaled about 880 XAG, which puts the ratio below the 1,000-ounce pivot that has been important since 2017. However, he also pointed out that one major element usually seen during such downturns has not appeared this time: a similar fall in the stock market.

Chart Data Shows a Sharp Drop in BTC/XAG

Data from the BTC/XAG chart also shows how much Bitcoin has struggled against silver over the past several months. The chart indicates that the BTC/XAG pair stood at 3,152 at the start of August 2025, but it has since dropped to 829 at press time. This move represents a steep 73.7% decline during that period.

The last time Bitcoin slipped below the 1,000-ounce pivot was in November 2022, during a tough period for the crypto market. The downturn grew worse after the collapse of FTX, which triggered panic across the industry. At that time, Bitcoin fell to a low of $15,479.

After losing the pivot in November 2022, Bitcoin weakened even more against silver and dropped to 688 ounces of silver in December 2022. This marked the lowest point before the market finally began to recover in early 2023.

Bitcoin’s Struggle to Reclaim the Key Level

When the recovery began in 2023, Bitcoin gained strength against silver. The crypto firstborn rose 41% against silver in January 2023, then added another 21% across February and March 2023. These gains helped Bitcoin climb back above the 1,000-ounce pivot, turning the level back into support.

BTCXAG 1M Chart
BTCXAG 1M Chart

From that point, Bitcoin managed to stay above the 1,000 XAG level for a long stretch. The ratio remained above the pivot from early 2023 until the recent breakdown in January 2026.

The latest decline pushed Bitcoin below the 1,000 XAG pivot on Jan. 19, and the market has not been able to move back above it since then. Instead, the level now acts as resistance. Market data shows that Bitcoin tried to retest 1,000 XAG several times between Jan. 30 and Feb. 8, but each attempt met strong resistance.

Early Signs of a Bounce

Even with the recent weakness, Bitcoin has started showing some signs of recovery against silver. The crypto asset fell to a five-year low of 669 ounces of silver in February 2026, marking the weakest point in years. After hitting that level, Bitcoin began to bounce.

That rebound also ended a long stretch of losses. Specifically, BTC had recorded six straight monthly declines against silver from August 2025 to January 2026, but the trend changed in February 2026. During that month, Bitcoin climbed 22.6% against silver, marking its first monthly gain after the long losing streak.

The recovery has continued into this month as well. In March, Bitcoin has already gained 16.48% against silver, extending the upward move as traders watch to see if the market can reclaim the key pivot.

What Happened After the 2022 Bitcoin Breakdown

Past data reveals an interesting comparison for what could happen next. Since Bitcoin first established the 1,000 XAG pivot in December 2020, the cryptocurrency had only fallen below the level once before the current drop. This break occurred during the November 2022 bear market.

After falling below the pivot, Bitcoin needed roughly three months to recover the level. Once it climbed back above 1,000 XAG, the market entered a strong upward run against silver.

Notably, the move that followed was significant. Specifically, Bitcoin rose from 1,107 XAG in February 2023 to 2,973 XAG in March 2024, which marked a 168% increase against silver during that period.

At current levels, Bitcoin would need to climb about 20% against silver to move back above the 1,000 XAG mark. It remains unclear at this point if the cryptocurrency can repeat the pattern from the 2022 breakdown and start another upward push once it reclaims that level.

Is Ripple Preparing a Major Operational Move After a 200M XRP Transfer?

0

XRP community pundit Xaif has drawn attention to a large transaction involving Ripple, suggesting the company may be preparing for a major operational move.

Specifically, Xaif highlighted a transfer showing that Ripple moved 200 million XRP from one of its wallets recently in a single transaction. He argued that the timing and structure of the transaction could signal a significant operational development, linked to settlement activity, new partnerships, or other institutional actions. 

Key Points 

  • XRP community commentator Xaif suggests Ripple may be preparing for a major operational move after transferring 200 million XRP from one of its wallets.
  • Blockchain data indicates that the transaction was an internal transfer between two Ripple-owned wallets.
  • Such movements are routine and typically occur after the company completes its monthly escrow operations.
  • Ripple unlocked 1 billion XRP on March 1 and subsequently re-locked 700 million XRP in escrow.

Ripple Moves 200M XRP 

According to screenshots attached to the post, Ripple transferred 200 million XRP, worth about $280.8 million, to an unlabeled address. The transaction occurred at 11:33 PM on March 5, 2026, and validators confirmed it in ledger #102673499. 

Furthermore, Xaif described the move as potentially significant, stating that the timing appeared “too suspicious to be nothing.” He suggested the transfer might relate to settlement activity, a partnership arrangement, or the repositioning of funds for an acquisition.

Meanwhile, his commentary also referenced an earlier remark noting that the U.S. Treasury announced a $2 billion debt buyback for bonds maturing between 2037 and 2046. This indicates that Xaif believes both developments are related. 

Internal Transfer 

Although the commentary has drawn significant attention from XRP enthusiasts, a quick analysis on XRPScan indicates that the transaction was an internal transfer. Specifically, Ripple moved the 200 million XRP from its Ripple (1) wallet to Ripple (50). 

Ripple XRP transfer
Ripple XRP transfer

This type of transfer is not unusual. Notably, Ripple frequently reallocates funds across its wallets for operational purposes, including liquidity management for institutional clients and exchange-related operations. 

Funds Remain Untouched 

Meanwhile, the exact reason behind the latest transfer remains unclear as of press time. However, blockchain data shows that the entire 200 million XRP remains untouched in the Ripple (50) destination wallet. At the same time, the sending wallet currently holds about 103.74 million XRP.

Notably, the transaction occurred just days after Ripple completed its March 2026 escrow operation. Following its standard monthly routine, the company unlocked 1 billion XRP on March 1 and subsequently re-locked 700 million XRP into escrow on March 3. As a result, Ripple has released roughly 900 million XRP into circulation so far this month. 

Shiba Inu at Major Decision Point—This Crucial Support Would Decide the Next Direction

0

Amid a broader bearish trend, Shiba Inu lies at a crucial support area, and how it reacts will determine its next price direction.

Shiba Inu sits at a critical price level, following a failed attempt to move higher. A push to higher prices on Wednesday faced a severe sell-off, dragging prices to the current zone, which represents a make-or-break point for the meme coin.

Key Points

  • Shiba Inu has continued to follow a prolonged downward structure on the weekly chart, a trend that began after the asset reached its historic peak of $0.00008854 in 2021.
  • Recently, SHIB declined into a crucial historical support region between $0.00000626 and $0.00000535, a decisive area for the token.
  • If Shiba Inu holds above the lower boundary near $0.00000535, the support region could still trigger a recovery to $0.00000800, $0.00001100, and potentially $0.00001400.
  • A price closing below $0.00000535 on the weekly timeframe with strong volume would spark a move to the historical support band between $0.00000350 and $0.00000280.

Shiba Inu at the Edge

TradingView analysis from CryptoNuclear shows that Shiba Inu has continued to follow a prolonged downward structure on the weekly chart, a trend that began after the asset reached its historic peak of $0.00008854 in 2021. 

Since then, price behavior has repeatedly produced lower highs and lower lows, reflecting persistent selling pressure across the broader market cycle. From 2022 to now, every upward attempt has struggled to overcome key resistance areas, resulting in a series of short-lived rebounds that preceded lower levels. 

Due to this pattern, the broader structure continues to reflect a market controlled largely by sellers. Instead of forming a new upward trend, rallies have repeatedly stalled before reaching previous highs.

Recently, Shiba Inu declined into a crucial historical support region between $0.00000626 and $0.00000535, an area that previously triggered strong reactions during previous market phases.

Although this zone has served as a key demand level in the past, recent bearish price trends have repeatedly tested it, weakening its strength. Consequently, the market now sits at a decisive point where the next direction could shape the midterm outlook for Shiba Inu.

This Critical Support Zone Could Decide the Next Direction

The analysis highlighted that if Shiba Inu holds above the lower boundary near $0.00000535, the support region could still trigger a recovery. In that scenario, a strong weekly close above $0.00000626, accompanied by visible buying activity and long lower wicks, would suggest that buyers are effectively defending the zone.

Such a reaction could allow the price to revisit nearby resistance levels around $0.00000800, then the $0.00001100 region, and potentially the $0.00001400 area where previous breakdowns occurred. SHIB would have to increase by 44%, 98%, and an impressive 152% to reach these price marks, respectively.

The analyst views any upward movement while the broader lower-high structure remains intact as likely a temporary recovery. For a stronger structural shift to occur, Shiba Inu would eventually need to break above those resistance levels and form higher highs.

Bearish Scenario if Shiba Inu Breaks Down

On the other hand, if the price closes below $0.00000535 on the weekly timeframe and the move is accompanied by strong volume, the current support would effectively fail.

Shiba Inu Key Support/CryptoNuclear

In that case, the market could move quickly toward the next historical support band between $0.00000350 and $0.00000280, representing a 37% and 49.5% correction.

For now, Shiba Inu remains positioned at a critical decision point. Increased buying activity and broader market stability would aid bulls in defending the decisive support level.

Crypto Educator Shares Why Now May Be a Good Time to Start Accumulating XRP

0

The XRP price has suffered devastating declines over the last six months, but a crypto educator explains why this could be a good time to accumulate more.

Notably, the broader crypto market has experienced sustained downturns since the fourth quarter of 2025, losing $1.9 trillion in valuation within this period despite the recent recovery effort. Amid the onslaught, XRP has recorded steep declines, with $131 billion lost from its market value since the July 2025 peak.

However, while panic has dominated the scene, an XRP community figure and crypto educator has suggested that the downturn may be presenting a good buy opportunity. According to him, declines amounting to 70% have historically marked profitable accumulation positions for XRP.

Key Points

  • The global crypto market cap has lost $1.9 trillion since Q4 2025, and XRP has not escaped the downturn, down by $131 billion since its July 2025 peak valuation.
  • XRP’s price has dropped from $3.6 in July 2025 to the current position of $1.39, but a recent commentary suggests that this could be a golden opportunity.
  • A known crypto educator stressed that each 70% crash for XRP, which occurred during the drop from $3.6 to $1.1, has proven to be a profitable accumulation position.
  • XRP would have to rise 163% from the current level to reclaim its $3.6 all-time high and become a profitable investment for holders who bought at that price.

XRP’s 70% Crash

This recent suggestion came from Sir Rob Art, an XRP community figure, as he maintains a bullish stance despite the current market turbulence. For context, after reaching the $3.6 peak in July 2025, XRP recorded a pullback and fluctuated between $2.8 and $3.1 by October.

However, after the Oct. 10 crash that pushed prices below $2.5, the broader crypto market entered a downtrend phase, and XRP collapsed further. Since then, XRP has recorded six consecutive monthly losing candles, down nearly 62% from its peak of $3.6 in July 2025.

Notably, XRP had collapsed to a multi-month low of $1.1 on Feb. 6 in the aftermath of the Feb. 5 market crash. This bottom represented a near 70% crash from the $3.6 high. It is from this level that Rob believes XRP has the potential to recover.

Good Buy Opportunity?

In his commentary, Rob called attention to the 70% decline from $3.6 to $1.1 by Feb. 6. Citing this drop, he stressed that it marked a good time to start accumulating more XRP tokens. Notably, at the $1.1 price, investing $10,000 in XRP would have bought 9,090 tokens, much more than 2,777 tokens at the $3.6 peak.

At such low prices, investors have the opportunity to procure more tokens for less before the market eventually recovers. Notably, XRP has already recovered slightly from the $1.1 low, up 26% from this level. Nonetheless, pundits like Rob still believe the current position presents a good opportunity.

XRP Historical Data

According to Rob, XRP’s historical data shows that crashes of up to 70% have mostly been profitable, as XRP has always recovered from these declines. He stressed that he has already begun a dollar-cost averaging (DCA) plan.

Notably, data confirms his thesis. Specifically, after XRP collapsed 68.42% from $0.0095 in October 2016 to $0.003 by January 2017, the recovery that followed pushed prices from $0.0056 in March 2017 to $0.3989 by May of that year.

XRP Historical Downturns

Meanwhile, XRP again dropped 69.92% from the $0.3989 peak to a low of $0.1270 the next month. What followed was another rebound four months later, pushing prices from $0.2350 in December 2017 to $3.31 in January 2018, a massive 1,308% rise within a month. 

XRP also saw a sharp 68% drop from $0.91 to $0.29 on the back of the Terra ecosystem collapse in 2022. The recovery for this drop took longer, about 2 years. However, when it eventually arrived in November 2024, XRP rose from $0.5 to $3.6 by July 2025. 

Now, a 70% crash has occurred from the $3.6 peak. While historical data indicates that XRP has the potential to stage a recovery campaign, it is important to note that past successes do not guarantee future results. As a result, investors should not take this commentary as investment advice.

“I’d Rather Hold $100K in FTX Refund Claims Than $100K XRP,” Bitcoin Author Says

The long-running rivalry between XRP supporters and Bitcoin maximalists has resurfaced after a controversial remark from crypto author Adam Livingston.

Livingston, a renowned Bitcoin maxi, said on X that he would prefer exposure to the collapsed exchange FTX to holding XRP. “I’d rather have $100,000 in FTX refund claims than $100,000 in XRP,” Livingston wrote.

Key Points

  • Adam Livingston says he’d rather hold $100K in FTX refund claims than $100K in XRP.

  • Livingston has repeatedly criticized XRP, claiming it lags far behind Bitcoin in long-term returns.

  • XRP supporters argue the asset offers unique payment and liquidity use cases beyond Bitcoin’s scope.

  • The rivalry between Bitcoin maximalists and XRP advocates highlights differing visions for crypto’s future.

History of XRP Criticism

Meanwhile, Livingston’s latest post follows a series of earlier statements in which he criticized XRP’s long-term performance relative to Bitcoin.

In August 2025, he wrote that he would “rather have $100 in Kohl’s Cash than $100 in XRP,” referring to Kohl’s store reward program.

A month later, he doubled down on the criticism. Specifically, he declared that XRP would eventually fall to zero against Bitcoin and repeated the well-known Bitcoin maximalist phrase: “There is no second best.”

By October 2025, Livingston compared the two assets using historical price data. He pointed out that XRP had returned to roughly $3.02, the same level it traded at in January 2018. Over that same period, he noted that Bitcoin had climbed from roughly $17,000 to around $120,000, representing a gain of more than 600%.

Given the disparity in return, he concluded that “everything goes to zero against Bitcoin.”

His commentary continued into 2026. In February, Livingston highlighted that XRP had fallen dramatically from its peak, noting that the asset had dipped by more than 70%. To him, it has no chance of recovery.

Community Questions the Hostility Toward XRP

Expectedly, Livingston’s latest attracted significant attention. One commenter asked why XRP often provokes such strong negative sentiments from Bitcoin maximalists.

“Why does XRP threaten Bitcoin maxis to such an extreme?” asked X user @inked_investing.

The question draws on the well-known ideological clash between the XRP and Bitcoin communities over technology, decentralization, and investment narratives.

While Bitcoin maximalists frequently argue that Bitcoin remains the only truly decentralized digital asset, XRP supporters often counter that the asset serves a different purpose as infrastructure for global payments and liquidity.

XRP Supporters Highlight Different Investment Thesis

Despite heavy criticism, XRP advocates continue to argue that the asset offers a different risk-reward profile than Bitcoin.

For example, crypto educator Edoardo Farina previously argued that XRP could offer stronger upside potential due to its lower price and expanding use cases in payments and liquidity infrastructure.

According to that perspective, smaller market capitalization assets can generate larger percentage gains during bull cycles than Bitcoin.

Long-Running Crypto Rivalry

The debate between Bitcoin and XRP supporters remains one of the longest-running rivalries in the digital asset industry.

Bitcoin advocates view the asset as the ultimate store of value and the foundation of decentralized finance. XRP proponents, on the other hand, see the asset as a tool for global liquidity and financial infrastructure.

As a result, disagreements often emerge not only over price performance but also over the role each asset should play in the evolving crypto economy.

British HODL Forecasts $340K Bitcoin Rally Could Unfold This Year

0

Bitcoin advocate Minesh Bhindi, aka British HODL, believes the leading cryptocurrency could surge to around $340,000 during the current market cycle.

Key Points

  • Bitcoin could hit $340,000 during this market cycle. If conditions align, the rally might even kick off later this year.
  • Bitcoin’s market cap of $1.2–$1.3 trillion suggests room for growth compared with traditional financial markets.
  • Recent gold and silver rallies demonstrate that even large assets can see rapid price surges, supporting Bitcoin’s potential.
  • Bitcoin has fallen 44% from its October 2025 peak, underperforming precious metals.

Analyst Predicts Major Bitcoin Rally

In a recent interview, British HODL said Bitcoin could reach around $340,000, with a possible deviation of about 15% above or below that level.

According to him, such a move could occur sometime between the most recent Bitcoin halving and the next scheduled halving event. He also indicated that the rally might unfold within this year if market conditions align.

Bhindi supported his projection by highlighting Bitcoin’s current market size. He estimates the cryptocurrency’s total market capitalization at around $1.2 trillion to $1.3 trillion, which he believes is still relatively small compared with traditional financial markets. Because of this, he argues that the asset still has substantial room for expansion.

Precious Metals Rally Provides Context

To illustrate his outlook, Bhindi compared Bitcoin’s potential with the recent performance of precious metals. In his view, the strong gains seen in those markets demonstrate that even large assets can experience rapid price appreciation.

For context, Gold recorded a 46% surge over the past year, climbing from $3,819 per troy ounce in October 2025 to a record $5,597 in January 2026. Although prices have since pulled back slightly, gold remained elevated at about $5,088 per ounce at the time of writing, reflecting a 3.65% weekly decline.

Meanwhile, Silver posted an even more dramatic rally earlier in the cycle. Prices surged from $45.55 per ounce to $121.67, nearly tripling in value before retreating from those highs. The metal was recently trading at $82.90 per ounce, down 11.57% over the past week.

Against this backdrop, Bhindi argued that if precious metals can deliver such strong rallies, a comparable move in Bitcoin should not be ruled out.

Bitcoin Has Lagged Since Late 2025

Despite such optimistic projections, Bitcoin has faced a difficult period since late 2025.

The cryptocurrency reached an all-time high of $126,080 in October 2025, but momentum faded soon afterward as investor sentiment weakened. Prices gradually declined in the months that followed.

At press time, Bitcoin was trading at roughly $70,484. This represents a 44% decline from its peak value.

Consequently, Bitcoin has underperformed gold and silver during this stretch, even though both metals also experienced recent pullbacks.

Market Uncertainty and Policy Factors

Beyond price movements, Bhindi pointed to broader economic factors that may have weighed on Bitcoin’s performance.

He argued that a strong liquidity cycle failed to materialize last year, limiting the capital flow into risk assets such as cryptocurrencies. Investor confidence also remained fragile during that time.

Political developments added further uncertainty, according to the analyst. He referred to policy shifts surrounding the Donald Trump administration, including tariffs and geopolitical tensions, which he believes created confusion in financial markets.

Such uncertainty, he argued, can slow investment activity because traders struggle to interpret rapidly changing policies.

However, British HODL believes that once these uncertainties begin to fade, market conditions could stabilize. If that happens, he expects a clearer environment for investors, one that could potentially support a stronger Bitcoin rally in the current cycle.

How $10,000 in XRP Could Transform Into $1 Million

0

A recent market assessment presents a pathway through which $10,000 in XRP investments could transform into $1 million.

Notably, the recent decline across the crypto market has weakened investor confidence, but some market commentators believe the downturn could create an opportunity to accumulate assets at lower prices. 

Among the assets analysts believe could deliver impressive gains is XRP, with an analysis highlighting how modest investments of around $10,000 made during the dip could transform to $1 million following a rebound push.

Key Points

  • While XRP has declined 62% from its all-time high, some market commentators believe the dip presents an opportunity to buy XRP at lower prices.
  • As investors evaluate the possibility of turning modest investments into fortunes, a recent assessment shows how $10,000 could transform into $1 million.
  • The assessment shows that a $10,000 investment in XRP at around $1.33 would purchase roughly 7,520 tokens.
  • If XRP reaches $16, its market cap would approach $1 trillion, increasing the value of that holding to about $120,000.
  • A price of $133 would imply an $8 trillion market cap and push the value of 7,520 XRP to roughly $1 million.

A $10,000 Investment in XRP

Market commentator XFinanceBull shared this assessment in a recent post, explaining how a $10,000 investment in XRP could eventually reach $1 million under certain conditions. However, he stressed that this was not a price prediction, but an evaluation.

According to the analysis, an investor who spends $10,000 on XRP when the price sits around $1.33 would receive roughly 7,520 XRP tokens. From here, XFinanceBull presented how the value of this holding could change if XRP reaches much higher prices in the future.

Specifically, if XRP climbs to $16, its overall market cap would rise to around $1 trillion. At this price level, the 7,520 XRP from the original $10,000 purchase would grow to roughly $120,000. The analyst said such a move would likely depend on inflows from XRP ETFs and stronger XRP institutional use for settlement.

What It Would Take to Reach $1 Million

He then explored a much more ambitious scenario. Notably, if XRP eventually reaches $133, the token’s total market cap would expand to about $8 trillion. At this valuation, the 7,520 XRP obtained from the $10,000 investment would be worth $1,000,000. This would mark a 100x ROI.

While an $8 trillion valuation may sound unrealistic at first, XFinanceBull highlighted the massive scale of the global financial systems that XRP seeks to support. For context, XRP focuses on improving international payments and settlement, an industry that already moves huge volumes of money every day.

For perspective, global foreign exchange markets handle around $7.5 trillion in trading volume each day. Meanwhile, cross-border payment flows exceed $150 trillion every year. XRP proponents often argue that capturing even a small slice of this activity could raise the asset’s value.

Infrastructure Developments Around XRP

XFinanceBull believes multiple developments and upcoming events in the XRP and Ripple ecosystems could support XRP’s price ambitions. One such development is the expected creation of a Ripple bank.

Another development involves RLUSD, which could help boost liquidity and support payment activity that works alongside XRP. The analyst also pointed out that XRP ETFs have gathered around $1.25 billion so far.