Home Blog Page 248

XRP Price That Could Retire Holders With $1000 To $2000 in XRP

0

If a crypto investor committed $1,000 to $2000 in XRP, could such an individual attain financial freedom, considering XRP’s growth potential?

XRP remains one of the most successful crypto assets in the market today, having increased by more than 24,000% since launch. With this growth, XRP has already made millions out of early investments. However, does the asset still have the potential to do the same for late entrants?

Key Points

  • XRP has gained over 24,079% since launch, turning a $15,000 early investment into about $3.6 million at today’s price of $1.42.
  • While XRP has already made early investors millionaires, it remains unclear if late entrants could see similar returns, possibly retiring on XRP.
  • Retirement targets vary widely, with the U.S. often requiring around $1.5 million, the UK about $1.3 million, Canada up to CAD 1.5 million, and India roughly $360,000 to $600,000.
  • A $1,000 investment today buys about 704 XRP tokens at current prices, while $2000 in XRP today could get 1408 coins.
  • If XRP reached $100, that holding would be worth $70,422, and at $500, it would rise to $352,112, still below retirement needs in most developed countries.
  • At $1,000 per XRP, the investment would grow to $704,245, while a $2,000 price would push it to $1.4 million, hitting retirement targets in most regions.

XRP’s Earlier Growth

XRP has delivered extraordinary returns since it began trading in 2013, transforming early investors’ modest stakes into substantial wealth. Specifically, data from CoinMarketCap shows that XRP boasts an all-time gain exceeding 24,079% from its opening price to the current value of $1.42. For perspective, this run turned a $15,000 investment into $3.6 million.

Today, many recent investors commit to XRP with similar optimism, hoping for comparable explosive growth to attain financial freedom from modest investments like $1,000. However, while XRP’s utility in cross-border payments through Ripple’s network and its price position have bolstered this belief, future performance remains highly uncertain. 

What Does Financial Freedom Mean to You?

Moreover, the concept of financial freedom changes with individual circumstances and location. Specifically, for some investors, it means covering basic living expenses without employment. Meanwhile, for others, it requires a larger nest egg to maintain a more comfortable lifestyle, including travel, healthcare, and legacy planning. 

In the United States, retirees may need around $1.5 million or more in savings, factoring in Social Security limitations and rising costs for healthcare and inflation. This also depends on age, as younger individuals would require more to retire comfortably.

Meanwhile, in the United Kingdom, a comfortable retirement typically demands around £1 million (roughly $1.3 million), depending on lifestyle and state pension support. Canada features similar figures, with most individuals targeting CAD 1 million to CAD 1.5 million to sustain independence. 

However, in India, expectations are lower due to reduced living costs. Notably, a comfortable retirement here could require INR 3 crore to INR 5 crore (approximately $360,000 to $600,000), though urban areas with higher expenses would push needs upward. 

Bullish XRP Price Predictions

Considering these benchmarks, $1,000 invested today would need to grow exceptionally to lead to true independence anywhere. Notably, XRP’s ability to deliver such transformative wealth would depend on its future price performance as influenced by institutional adoption, ETF inflows, and Ripple’s ecosystem growth. 

Interestingly, multiple market commentators have presented ambitious price targets for XRP, which could help modest investments like a $1,000 commitment reach substantial heights. For one, YoungHoon Kim, who claims to hold the highest IQ in the world, predicted last month that XRP could rise to a price of $100 over the next five years. 

Meanwhile, Edoardo Farina, the Alpha Lions Academy CEO, is more optimistic about XRP’s future. Specifically, in June 2024, Farina argued that purchasing XRP for $500 per token could become a bargain deal by 2029. In September 2025, market watcher Armando Pantoja argued that XRP could inevitably reach $1,000, but admitted that this would not happen anytime soon. Further, First Ledger teased the possibility of XRP hitting $2,000 last May. 

Could You Retire with $1,000 in XRP?

However, if XRP claims any of these targets, could the modest $1,000 investment help investors retire? For context, $1,000 invested in XRP today would procure 704 tokens. If XRP hits $100, the 704 tokens would amount to $70,422, barely enough to retire even in low-cost countries. Meanwhile, if the crypto asset claims a $500 price, the investment would rise to $352,112, still not enough for some countries.

Nonetheless, if XRP hit the $1,000 mark, the 704 tokens would grow to $704,225, which could be sufficient for retirement in a few low-cost countries. For the $2,000 price, the investment would reach $1.4 million, which would hit the retirement threshold for countries like the UK and Canada, and more than sufficient for low-cost nations.

However, while the prospect of an XRP surge to these levels seems enticing, it is important to note that there’s no guarantee the crypto asset could attain these prices. As a result, investors should not see this as investment advice.

Bitcoin and Broader Crypto Market Shed $730B in 100-Day Price Contraction

0

Bitcoin and the broader crypto market have quietly endured one of their sharpest drawdowns in recent memory, spurred by cyclical and fundamental factors. 

Over the past 100 days, hundreds of billions of dollars have vanished from the crypto market, leaving sentiment fearful and liquidity thinner across the board. What initially looked like a routine pullback amid claims of an extended bull cycle has evolved into something deeper, with capital steadily flowing out of Bitcoin and altcoins.

Key Points

  • Bitcoin and the broader crypto market have quietly endured one of their sharpest drawdowns in recent memory, spurred by cyclical and fundamental factors.
  • The total crypto market has shed roughly $730 billion in its 100-day-long correction.
  • The premier asset has dropped 47% from its October 2025 all-time high of $126,200 to its current market price of $66,900.
  • Following the sell-off, BTC’s valuation has fallen 21.6% from $1.69 trillion to near $1.35 trillion.
  • While that accounts for a considerable share of the valuation decline, the selling pressure has also spread to other market segments.

Bitcoin Leads as Crypto Sheds Billions in 100-Day Capitulation

Analysis from CryptoQuant’s verified author GugaOnChain shows the total crypto market shedding roughly $730 billion in its 100-day-long correction. Slowly but steadily, Bitcoin has declined considerably, reflecting a prolonged weak price phase where participants typically reduce exposure and move to the sidelines.

The shift has weighed heavily on Bitcoin, which typically acts as the ecosystem’s anchor. The premier asset has dropped 47% from its October 2025 all-time high of $126,200 to its current market price of $66,900.

This has seen its valuation fall by 21.6% from $1.69 trillion to nearly $1.35 trillion at the time of the report, a drop of more than $340 billion. At press time, BTC’s market cap has slid further to $1.33 trillion.

Altcoins Slip as Liquidity Thins Across the Board

While that accounts for a considerable share of the valuation decline, the selling pressure has also extended to other segments of the market. For context, the top 20 cryptocurrencies by market cap, excluding BTC and stablecoins, have fallen from $1.07 trillion on December 2 to $810.65 billion, reflecting a 15.17% drop of $259.8 billion.

Meanwhile, mid- and small-cap altcoins were hit the hardest by proportion. Their collective market cap declined from $390.3 billion on December 11 to $263.63 billion, reflecting a 20% correction of $122.75 billion.

Market Cap Comparison/CryptoQuant

Notably, this shows that top-tier altcoins, often considered relatively resilient during corrections, have not escaped the bloodbath. As confidence faded, these assets moved in step with Bitcoin, suggesting that crypto market enthusiasts are reducing exposure rather than rotating within the market.

Again, when capital exits the entire crypto sector at once, it often reflects broader macro uncertainty. The result is severe market corrections and lesser market activity, weighing on the prospects of a recovery.

What to Observe 

Despite the severity of the contraction, the CryptoQuant analysis urged long-term observers to look ahead. Historically, such phases have preceded periods of stabilization and price recovery.

Some recommended indicators to keep an eye on include Bitcoin’s cost basis, capital flows, and on-chain behavior, which may offer clearer signals than emotion-driven reactions. Interestingly, some indicators are already suggesting that BTC is nearing its bottom.

Bitcoin Whale Flows into Binance Hit 2-Year Peak: How Could Price React?

0

Bitcoin whale inflows to the Binance exchange recently spiked to their highest level since 2024, with potential impact on prices.

The crypto market has stayed under pressure since Q4 2025, and the weakness has wiped out $2 trillion in value. The total market cap has fallen from $4.27 trillion in October 2025 to $2.27 trillion today, with Bitcoin accounting for $1.18 trillion of the total, or about 59%.

As prices slide, large holders have started moving funds to exchanges. On-chain data shows that whales have increased transfers to Binance.

  • The total crypto market cap has dropped from $4.27 trillion in October 2025 to $2.27 trillion, erasing $2 trillion in value.
  • Bitcoin accounts for $1.18 trillion of that loss, or about 59%, and trades around $67,000.
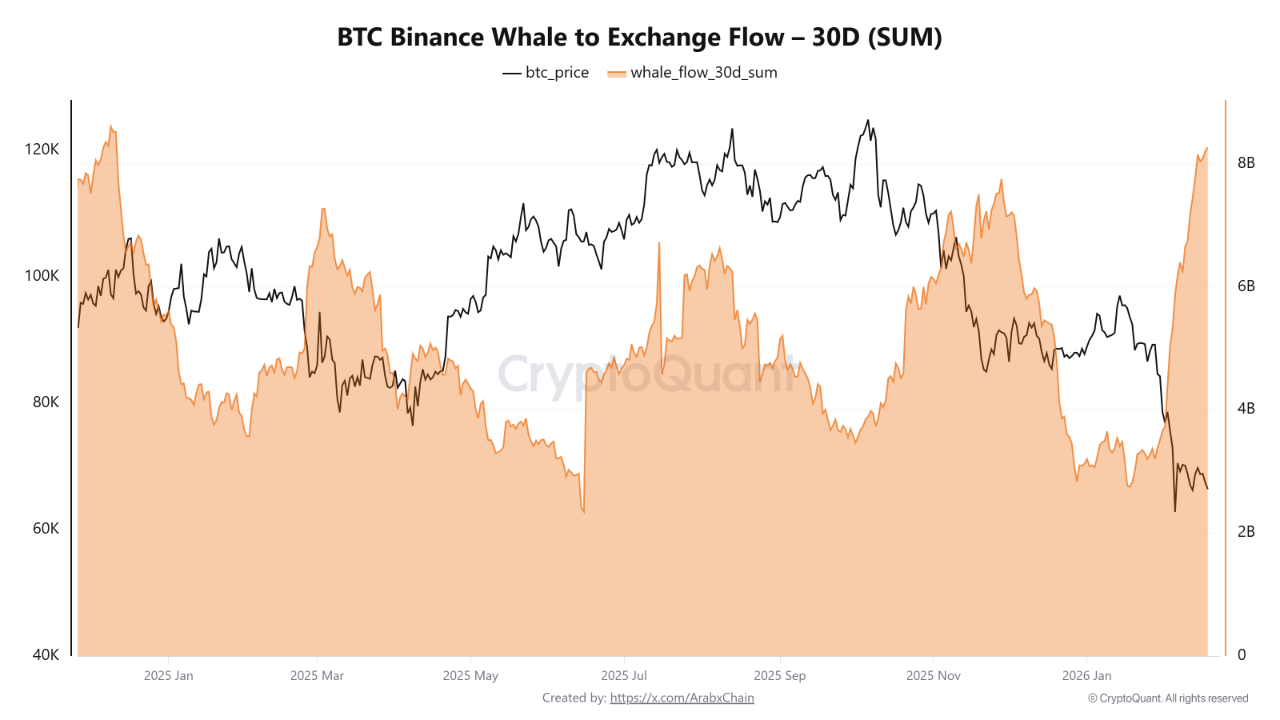
  • Amid the decline, whale inflows to Binance pushed the 30-day average to approximately $8.3 billion, the highest level since 2024.
  • The market has recorded such spikes in inflows three times since 2025, and Bitcoin’s price dropped two out of those three times.
  • Most recently, in October 2025, inflows rose from roughly $3 billion to $7.7 billion, coinciding with a Bitcoin price drop from $126,000 to $80,000.

Bitcoin Whale Flows to Binance Hit $8.3 Billion

Arab Chain, a verified analyst at CryptoQuant, pointed out this trend and explained why it matters for the market’s next move. He reported that the 30-day average of whale inflows to Binance has climbed to about $8.3 billion, marking the highest level since 2024.

According to him, when the 30-day average rises this quickly, it often shows that big holders may plan to sell or adjust their positions, especially when prices look weak. At the time of his reading, Bitcoin traded near $66,400, 47% below its all-time high. He suggested that possible selling pressure could be one reason prices have struggled.

Possible Selloffs?

However, Arab Chain clarified that the Bitcoin whale exchange inflow spike does not automatically mean a massive sell-off has started. Notably, whales might simply move funds to manage liquidity, use derivatives, or prepare for larger trades ahead. 

Despite confirming this, he pointed out that past jumps in the 30-day average often line up with periods of higher volatility or changes in market structure. He also noted that this latest surge came after a stretch of stable whale flows, which may indicate a change in sentiment among large investors.

If inflows keep rising, more supply could hit exchanges and push prices lower in the short term. Nonetheless, if inflows begin to fall again, this development could indicate the end of distribution and the return of confidence.

Past Bitcoin Whale Flow Spikes Often Came Before Price Drops

Meanwhile, historical chart data shows that Bitcoin whale inflows have surged suddenly about three times since 2025, though not as strongly as now. In two of those three cases, Bitcoin’s price fell soon after.

Bitcoin Whale Flows to Binance
Bitcoin Whale Flows to Binance | CryptoQuant

The first case happened in January 2025 when Bitcoin crossed $100,000. As the price climbed to $107,000 in late January, whale inflows jumped from around $3 billion to about $7 billion. Soon after, Bitcoin dropped to $76,000 by mid-March. During that decline, whale inflows began to fall sharply.

A similar pattern appeared in early October 2025. Specifically, Bitcoin reached an all-time high of $126,000 that month. Around the same time, whale inflows rose from about $3 billion in early October to roughly $7.7 billion by late November. As inflows increased, Bitcoin fell from $126,000 to $80,000 in late November. 

After that drop, inflows eased again before rising to current levels. The major difference now is that this latest spike has occurred while Bitcoin already trends lower, not during a strong rally. This leaves the market unsure about how the price will respond this time.

UniCredit on Bitcoin

Elsewhere, Italian multinational bank UniCredit recently suggested that Bitcoin’s recent weakness comes from soft market sentiment and wider macro pressures. Even though easing U.S. regulatory concerns have reduced policy risk, confidence has not fully returned. Thomas Strobel, a strategist at UniCredit, said he keeps a neutral view on Bitcoin.

Strobel places Bitcoin’s fair value around $75,000. He warned that a drop of about 35% from that level, especially if the price stays below $50,000, could indicate a bigger change in the market. To him, any strong recovery would need better sentiment, rising ETF inflows, and stronger liquidity.

Michael Saylor Says If Bitcoin Is Not Going to Zero, It’s Going to $1 Million

0

Michael Saylor has doubled down on his long-standing Bitcoin conviction, declaring that the asset faces only two ultimate outcomes.

“If Bitcoin is not going to zero, it’s going to a million,” Saylor wrote on X today, as the market navigates bearish pressure.

His statement comes as Bitcoin trades at $67,100. Earlier this month, the asset briefly touched $60,000. It now sits 47% below its all-time high of $126,200, recorded during the previous cycle peak. The broader market has also suffered, with many altcoins down as much as 90% from their highs.

Key Points

  • Michael Saylor says if Bitcoin isn’t going to zero, it’s heading to $1M long term.
  • With Bitcoin at $67,100, 47% below its $126,200 peak, Saylor calls the slump temporary.
  • While Bloomberg’s Mike McGlone warns of $10K, Saylor cites ETFs and banks as support.
  • Strategy holds 717,131 BTC and plans to keep buying despite paper losses.

Bear Market Doubts vs. Saylor’s Long-Term View

While Saylor remains confident, some analysts are calling for a deeper downside. Bloomberg commodity strategist Mike McGlone has floated the possibility of Bitcoin revisiting $10,000.

Saylor, however, has consistently called downturns temporary phases within a larger uptrend. In recent interviews, he described the current slump as milder than previous bear markets, arguing that institutional adoption and political support have significantly strengthened Bitcoin’s foundation compared to past cycles.

He previously noted that banks and major financial institutions now participate more actively in Bitcoin markets than they did four years ago. He also pointed to the rise of spot Bitcoin ETFs and expanding corporate treasury allocations as evidence that the asset class is maturing.

Strategy’s Bitcoin Bet Remains Intact

Saylor’s conviction is reflected in the balance sheet of Strategy, the firm he chairs. The company currently holds 717,131 BTC, acquired at an average price of $76,027 per coin.

With Bitcoin trading below that level, the position is underwater on paper. Still, Saylor has insisted that even a severe crash would not derail the company’s plans.

Last week, he stated that Strategy could withstand a drop to $8,000 per Bitcoin and still manage its obligations. The firm continues to signal that it has no intention of selling and plans to keep accumulating.

From $1 Million to $10 Million

Saylor has previously outlined bold long-term price targets. In late 2025, he suggested Bitcoin could reach $1 million per coin if Strategy were to acquire 5% of the total supply. He went even further, arguing that prices could climb to $10 million if ownership concentration rises toward 7%.

His thesis rests on a supply-demand imbalance. With a fixed cap of 21 million coins and increasing institutional demand, Saylor believes the asset will become exponentially more expensive over time. In his words, each cycle requires “more fiat for less Bitcoin.”

Ultimately, Saylor’s latest remark reinforces a binary perspective: either Bitcoin ultimately fails, or it evolves into a multi-million-dollar asset.

Arkham Reveals When Strategy Could Sell Bitcoin Amid Over $6B Paper Loss

0

Arkham Intelligence has assessed whether Michael Saylor could be forced to sell Bitcoin after Strategy’s BTC holdings fell more than 10% below their average purchase price.

Bitcoin’s recent downturn has deepened losses for both retail and corporate investors. In particular, Strategy, the pioneer of the Bitcoin treasury model, has seen the value of its holdings drop sharply, fueling debate over its next move.

Key Points 

  • Bitcoin’s recent price slump has triggered heavy unrealized losses across both retail and institutional portfolios. 
  • Strategy’s BTC stash is now down over $6 billion, representing an 11.92% unrealized loss. 
  • Since Strategy primarily funds its Bitcoin purchases via equity issuance and convertible debt, it has significant flexibility in managing its financial obligations. 
  • Strategy stresses that it can still cover its debts even if Bitcoin’s price crashes to $8,000. 

Strategy Faces Over $6B Paper Loss on Its Bitcoin Holdings 

Company data shows that Strategy acquired 717,131 BTC for an average cost of $54.52 billion. However, with Bitcoin trading at $66,961, those holdings are now worth $48.02 billion. As a result, the firm faces an unrealized loss of $6.5 billion, representing an 11.92% decline. 

Strategy Bitcoin Holdings

Since Strategy financed these purchases through the issuance of its preferred stock and convertible notes, speculation has intensified that Strategy may need to liquidate part of its Bitcoin reserves to offset its short-term debt. 

Strategy’s Bitcoin Funding 

Examining Strategy’s financing structure, Arkham Intelligence indicated that selling Bitcoin remains a last resort, not an immediate necessity. The blockchain analytics platform explained that Strategy relies heavily on equity issuance and convertible debt, giving it flexibility in managing liabilities. 

Its preferred shares, such as STRK, STRF, STRD, STRC, and STRE, offer dividend rates of roughly 8-10%. However, these dividends are legally optional, and redemptions remain at the company’s discretion, according to Arkham. Notably, only STRK converts into common stock. Therefore, Strategy is not required to sell Bitcoin to meet preferred dividend payments.

In contrast, convertible notes pose a firmer obligation. The company carries about $8 billion in convertible debt against roughly $2.5 billion in cash. These notes are legally binding and must be repaid or converted at maturity. Unlike preferred dividends, they cannot be skipped. 

Selling Bitcoin Remains Strategy’s Last Resort

Since convertible notes can typically be converted or refinanced, Arkham Intelligence emphasized that Strategy can remain underwater on Bitcoin for extended periods. However, the firm noted that Strategy would likely sell some BTC only if both conversion and refinancing options fail. 

Meanwhile, Strategy recently dismissed concerns about its ability to service debt amid Bitcoin’s downturn. The company asserted that it could meet its obligations even if BTC fell to $8,000, signaling confidence despite market weakness.

Soon after, Strategy reinforced that stance by purchasing an additional 2,486 BTC. Analysts now expect the company to announce further Bitcoin acquisitions in the coming weeks. 

Top Investor Predicts When XRP Will Surpass Bitcoin by Magnitude

0

A long-time Bitcoin investor has argued that XRP could surpass Bitcoin “by magnitude” as global finance moves on-chain.

Pumpius, who says he has bought Bitcoin since 2013, took to X to declare that all central banks will ultimately use XRP as a bridge asset. According to him, that shift is already starting to become reality.

“When this happens, XRP will surpass Bitcoin (BTC) by magnitude,” he wrote. The backdrop to the discussion centers on growing stress in global currency markets.

Key Points

  • A longtime Bitcoin investor says XRP could surpass Bitcoin as global finance shifts on-chain.
  • Rising FX stress and bond volatility are fueling calls for blockchain-based settlement systems.
  • Supporters argue that XRP and the XRP Ledger could serve as a neutral bridge for global currencies.
  • Despite bold forecasts, XRP would need trillions in added market cap to overtake Bitcoin.

FX Tensions and the Push for On-Chain Settlement

Notably, Pumpius made his comment while responding to a macro-focused post by the popular X account Stellar Rippler. The post referenced reports that the U.S. Treasury contacted Japan for assurances on foreign exchange as oil prices climbed and Japanese interest rates rose.

With oil at $65 and Japan’s rates rising, investors are growing concerned about bond market instability and possible capital leaving the U.S. Reports that the Federal Reserve asked banks for dollar/yen quotes have added to speculation that officials may step in if currency volatility worsens.

Stellar Rippler argued that this kind of uncertainty highlights the need for on-chain foreign exchange systems instead of relying only on traditional interbank networks.

He also pointed to the growing ecosystem around Ripple and the XRP Ledger. Ripple President Monica Long recently said that 2026 could mark the start of institutional-scale adoption for XRP, a statement many in the community believe aligns with these market trends.

XRP Ledger as a Neutral Bridge

Supporters describe a system in which regulated euro- and dollar-liquidity flows through XRP as a neutral bridge asset.

In this model, euro-backed and dollar-backed stablecoins could operate on-chain. Over time, similar corridors could expand to include yen liquidity through Japanese financial institutions.

The idea includes permissioned areas where verified banks provide liquidity. A compliant on-chain DEX would handle foreign exchange matching, while privacy-focused credential systems would protect institutional users. Transactions would settle on the XRP Ledger within seconds, with built-in audit trails and policy controls.

In this setup, XRP would move beyond speculation and serve as the connecting layer for cross-border payments between major global currencies.

Can XRP Really Surpass Bitcoin?

The claim that XRP could surpass Bitcoin by a large margin echoes earlier predictions from market commentators.

In October 2025, Tradeship University founder Cameron Scrubs forecast that XRP would become the number one cryptocurrency by market capitalization by 2030, overtaking both Bitcoin and Ethereum. Similarly, Coach JV has repeatedly argued that XRP could rise into the top spot within the decade.

However, the numbers illustrate the scale of the challenge.

Bitcoin’s market capitalization currently stands in the trillions of dollars, while XRP’s valuation remains a fraction of that at $86 billion. For XRP to flip Bitcoin at current levels, it would require a multi-trillion-dollar increase in market cap. 

And if Bitcoin continues to grow toward long-term projections such as $500,000 or $1 million per coin, the gap would widen even further.

Even optimistic XRP forecasts from analytics platforms project prices between $23 and $48 by 2030, which would still leave Bitcoin with a substantial lead.

Document Proposes How RLUSD Could Boost XRP Price to $5

0

A community-generated document has proposed an avenue through which the Ripple stablecoin RLUSD could boost the XRP price to as high as $5.

A document circulating in the XRP community presented a theory that institutions could use RLUSD to execute large XRP buy orders, potentially pushing prices as high as $5.00 in a staged example involving a $1 billion deposit. 

However, the practicality of the model remains highly questionable, considering issues surrounding real-world trading activities, arbitrage opportunities, and the fact that switching from USD to RLUSD does not automatically create new demand for XRP.

Key Points

  • Following the launch of RLUSD in December 2024, some proponents suggested that the stablecoin could compete with XRP for institutional adoption.
  • However, a community-generated document recently proposed how RLUSD could complement XRP and boost its value.
  • The proposal suggests banks could deposit $1 billion into RLUSD and use it to buy XRP on exchanges.
  • In the example order book, 100,000 XRP sit at $0.50, 50,000 at $1.00, and 20,000 at $5.00.
  • A large RLUSD buy order would clear lower-priced sell orders and push XRP’s price toward $5.00 or higher.
  • However, the proposal has issues surrounding real-world institutional trading activities and the fact that using RLUSD instead of USD does not lead to new demand for XRP.

How the Proposal Says RLUSD Boosts XRP Price

Xaif, a known XRP community figure, recently shared the document. For context, the material suggested that RLUSD could help drive XRP’s price higher by making it easier for institutions to accumulate large amounts of the token.

Notably, it proposed that instead of banks using regular U.S. dollars to buy XRP, they would first convert their funds into RLUSD. Because RLUSD is pegged to the dollar, it keeps a stable value during the transaction process.

The theory claims this stability would allow institutions to make large XRP purchases without worrying about sudden price swings in their base currency.

The proposal then suggests that if these institutions use RLUSD to place very large buy orders, they will quickly absorb the cheapest XRP sell orders available. As buyers remove those lower-priced offers, the price would climb to the next available level. If liquidity at lower prices remains thin, the price could jump sharply in a short period.

Document Proposing How RLUSD Could Boost XRP Price

The document argues that using RLUSD instead of traditional fiat trading pairs like USD/XRP could speed up transactions and improve efficiency. 

Amid the proposed XRP price spike, institutions might still continue buying and using it because of its speed and lower costs for cross-border payments. In this situation, RLUSD acts as a steady middle layer that keeps the whole process running smoothly.

XRP Price Boost to $5

To make the idea clearer, the document presented an example. In the first step, a bank deposits $1 billion into RLUSD. Further, the institution holds that RLUSD in a Ripple-supported wallet or on an exchange, ready to use.

Next, the bank uses RLUSD to buy XRP. The example assumes a specific order book involving 100,000 XRP offered at $0.50, 50,000 XRP at $1.00, and 20,000 XRP at $5. 

With a $1 billion buy order, the bank wipes out all the XRP listed at $0.50, then clears everything at $1.00, and begins purchasing into the $5 range. According to the proposal, this action pushes the price to $5 or higher because no cheaper sell orders remain. The new higher level then becomes the reference point for future trades.

After the purchase, the bank uses XRP to settle international payments, taking advantage of its speed and lower transaction costs. Meanwhile, RLUSD continues to serve as the stable asset that makes repeated large transactions easier to manage.

Important Caveats

However, the proposal has some major flaws. First, it assumes institutions would place one huge order directly into a thin public order book. In reality, large buyers usually break orders into smaller pieces, use special routing strategies, or trade over-the-counter to avoid pushing prices up too quickly.

Secondly, arbitrage activity may not allow such sudden spikes. Practically, if XRP’s price suddenly jumped from $0.50 and $1.00 to $5.00, traders on other exchanges would likely leverage this. They would add new sell orders and take advantage of price gaps between platforms. This could limit extreme price spikes.

Finally, the proposal mixes up the payment method with actual demand. Switching from USD to RLUSD does not automatically create new interest in XRP. Institutions still need a strong reason to buy and hold XRP in the first place. If real demand is absent, simply changing the transaction currency may not be enough to sustain a move toward $5.

Expert Says XRP Could Make a Parabolic Move Most people are Not Prepared For

0

Historical data points to a potential upsurge for XRP as its volatility hits lows the market last witnessed in June 2024.

XRP has not escaped the crypto market turbulence that began in Q4 2025, down more than 61% from its all-time high of $3.66 to the current price of $1.41. During this period, XRP has recorded four consecutive monthly losing candles and is on track to witness the fifth one, down 13.44% this month.

However, market data indicates that the downturn may now be losing steam, as market losses slow. This has led to a massive decline in XRP’s historical volatility indicator. Specifically, the indicator has dropped to 96 at press time. The last time the metric hit these lows was in June 2024 as it moved close to a bottom. The November 2024 rally followed shortly after.

Key Points

  • While XRP has declined 61% from its all-time high since the ongoing turbulence began, market data shows the downturn may be slowing down.
  • This slowdown has led to reduced losses and consolidation with mild gains across multiple timeframes.
  • Amid the slowdown, XRP’s historical volatility has reached a low of 96, representing levels last witnessed in June 2024. 
  • When the historical volatility indicator dropped to similar lows in June 2024, it marked the bottom for the downtrend, with XRP surging by November 2024.
  • Data suggests XRP could record a rally similar to its 2017 run if the trend plays out as expected.

XRP Historical Volatility Hits Extreme Lows

This idea came from Austin, an XRP community figure and market commentator, as XRP struggles to maintain its hold above $1.4. Now trading for $1.41, XRP is down 25% this year but appears to be demonstrating greater resilience than other assets such as Ethereum.

With the downturn now slowing down, Austin confirmed that XRP’s historical volatility indicator has hit extreme lows. For context, the Historical Volatility indicator shows how much an asset’s price has moved in the past. It helps traders gauge how calm or how turbulent the market has been, based purely on previous price changes.

In an earlier commentary, Austin pointed out that historical volatility had dropped to a 20-month low of 96. The last time the metric hit this extreme low was in June 2024, when XRP dropped to $0.45. Weeks later, XRP slumped further to $0.38, and this marked the bottom. After four months, XRP engineered the November 2024 rally.

Interestingly, Austin highlighted that XRP has dropped to this extreme low historical volatility while its price has witnessed higher lows compared to the June 2024 bottom. He believes this is interesting. According to him, this indicates that the market may be building pressure. He expects the compression to lead to expansion, predicting it could send XRP to price discovery.

A Possible Rally Similar to the 2017 Run

In a follow-up analysis, Austin also highlighted that the historical volatility is following an ABCDE wave structure within a contracting triangle. The recent drop to 96 marked the conclusion of Wave E, and the analyst expects an upward breakout to occur from here, resulting in the price expansion.

XRP Historical Volatility Austin
XRP Historical Volatility | Austin

He projected that the imminent expansion could lead to a rally similar to the 2017 run. For context, XRP soared from $0.0050 in February 2017 to a peak of $3.31 by January 2018. This represented a 66,100% increase within a year.

According to Austin, if XRP’s price breaks out with the historical volatility metric to retest the 2017 highs around $3.3, a more parabolic surge could play out, potentially leading to a rally similar to the 2017 run. Notably, if XRP saw the 66,000% rise from the current price, its value could reach $925. However, this surge will likely not reach this extent.

Peter Schiff Says Bitcoin Price Could Dip to $20,000

0

Long-time crypto skeptic Peter Schiff has renewed his warning about Bitcoin outlook, cautioning investors that further downside could emerge if market conditions deteriorate.

Key Points

  • Schiff warns that a decisive break below $50,000 could trigger accelerated selling for Bitcoin.
  • He projects that sustained pressure might push Bitcoin down to $20,000, an 84% decline from its October all-time high above $126,000.
  • Schiff is the most frequent critic of Bitcoin, with at least 22 public predictions of its collapse recorded since 2010.
  • He has made over 200 bearish statements on Bitcoin since 2011, consistently questioning its intrinsic value and long-term viability.

Schiff Flags $50K as Key Risk Level

In a post published Thursday on X, Schiff said a decisive break below the $50,000 level could trigger accelerated selling. He suggested that, under sustained pressure, Bitcoin might ultimately revisit $20,000. This would represent an 84% decline from its all-time high above $126,000 reached in October.

When asked to explain the technical basis for this projection, Schiff did not cite specific indicators. Instead, he emphasized Bitcoin’s inherent volatility, pointing to its history of steep rallies followed by sharp corrections as evidence of structural instability.

Despite his warning, Bitcoin demonstrated near-term resilience. As of Friday morning, it was trading at $68,134, up 1.5% over the previous 24 hours.

History of Bearish Calls

Schiff’s latest comments align with his long-standing criticism of digital assets. Indeed, he has consistently questioned Bitcoin’s intrinsic value and long-term viability since its early years.

The website Bitcoin Deaths, which catalogues public declarations of Bitcoin’s demise since 2010, identifies Schiff as its most frequent critic. Specifically, the platform records at least 22 instances in which he predicted the cryptocurrency’s collapse.

Other prominent skeptics include Warren Buffett, Steve Hanke, Nouriel Roubini, and JPMorgan CEO Jamie Dimon.

Additionally, data compiled by CryptoPotato shows that Schiff has made more than 200 bearish statements since 2011. His earliest public caution dates back to June of that year. During a radio broadcast, he argued that Bitcoin lacked intrinsic value and could ultimately become worthless.

Taken together, these records illustrate a consistent pattern in Schiff’s outlook.

Debate Over Institutional Influence

While Schiff attributes potential downside risks to rising hype, leverage, and institutional participation, other analysts interpret these developments differently.

In Schiff’s assessment, greater institutional exposure could intensify losses during a downturn. He believes larger positions and borrowed capital may amplify volatility.

Conversely, some market observers argue that institutional involvement has strengthened the ecosystem. They point to deeper liquidity and regulated custody solutions as stabilizing factors. In their view, structural demand today is more robust than during the crypto downturns of 2018 and 2022.

This divide highlights an ongoing debate over whether mainstream adoption increases fragility or resilience.

Bullish Projections and Legislative Watch

While Schiff remains cautious, several major financial institutions maintain optimistic forecasts. Both Bernstein and Standard Chartered have reaffirmed their year-end Bitcoin price target of $150,000, even as the asset consolidates below $70,000.

Meanwhile, traders are closely watching progress on the proposed CLARITY Act, which many believe could provide regulatory certainty and unlock further institutional inflows. Proponents argue that clearer rules may catalyze renewed upward momentum.

For now, Bitcoin remains at a pivotal juncture. Schiff warns that a breakdown below key support levels could trigger a steep correction. At the same time, major financial institutions continue to project significant upside, underscoring the stark divide in expectations surrounding the world’s largest cryptocurrency.

How Many XRP Needed to Reach 1% of XRP Rich List and Their Worth If XRP Hits $10

0

As XRP trades at $1.40 today, many investors are quietly asking how much XRP is enough to be considered part of the elite group of holders.

Fresh data from the XRP rich list shows that to enter the top 1% bracket, a wallet must hold at least 46,426 XRP. Currently, only 76,412 wallets meet or exceed this threshold out of a total 7.64 million XRP holders.

Key Points

  • To join XRP’s top 1%, wallets must hold at least 46,426 XRP, with 76,412 wallets qualifying today.

  • Buying 46,426 XRP now costs ~$64,996

  • Top 5% and 10% XRP holders need 7,745 and 2,231 XRP, costing ~$10.8K and $3.1K today.

  • Most XRP holders have small balances; only a fraction control enough to reach elite wealth tiers.

Worth If XRP Hits $10

At today’s price of $1.40, accumulating 46,426 XRP would require an investment of approximately $64,996. That is the current entry point for anyone aiming to secure a position among the top 1% wealth bracket on the XRP Ledger.

If XRP eventually climbs to $10, that same 46,426 XRP stack would be worth $464,260. In other words, a portfolio that costs just under $65,000 today could approach half a million dollars at the $10 level.

While this scenario remains hypothetical, it helps illustrate why many community members focus on rich list positioning during price dips.

The Top 5% and Top 10% Thresholds

For investors targeting slightly lower brackets, the entry requirements are far more modest. To rank among the top 5% of XRP holders, a wallet needs at least 7,745 XRP. There are currently 382,056 addresses in this category.

At $1.40 per XRP, this amounts to an investment of about $10,843. If XRP reaches $10, that holding would be valued at $77,450.

Meanwhile, joining the top 10% requires 2,231 XRP or more. Around 764,111 wallets fall into this bracket. At today’s price, acquiring 2,231 XRP would cost roughly $3,123. Should XRP rise to $10, that portfolio would grow to $22,310.

These figures show that while the top 1% demands a larger capital commitment, entering the top 10% or 5% remains relatively accessible compared to the broader market.

XRP Rich List
XRP Rich List

Where Most XRP Holders Stand Today

The distribution of XRP holdings reveals a wide gap between smaller holders and the wealthier brackets.

Out of 7.64 million holders, 3,707,244 wallets hold between 0 and 20 XRP. Another 2,549,199 wallets hold between 20 and 500 XRP. This means the majority of participants hold relatively small balances.

Moving higher up the ladder, 260,186 wallets hold between 500 and 1,000 XRP, while 612,985 wallets hold between 1,000 and 5,000 XRP. These segments sit below the top 10% threshold but are much closer to entering higher wealth brackets compared to smaller holders.

The data highlights a clear reality: only a small fraction of wallets control the amounts needed to rank in the top 1%, 5%, or even 10%. As price rises, the dollar cost of entering these brackets increases, even if the XRP amount required remains the same.

Psychological Milestone or Strategic Goal?

Reaching the top 1% of XRP holders is largely a symbolic milestone. It does not guarantee returns, nor does it offer any direct advantage beyond relative positioning.

However, many long-term holders see rich list positioning as a strategic goal. If XRP appreciates significantly over time, those who secured higher brackets at lower prices could see outsized portfolio growth.