Home Blog Page 256

Stablecoins Are Better Suited Than Bitcoin to Act as Money: MUFG Bank’s Lee Hardman

0

MUFG Bank currency analyst Lee Hardman says stablecoins are proving to be a more practical form of money than volatile cryptocurrencies such as Bitcoin.

In a recent market note, Hardman explained that stablecoin growth is drawing more attention because these assets function as a digital form of cash.

Unlike Bitcoin and many other cryptocurrencies, stablecoins maintain a stable value, usually pegged 1:1 to major currencies like the U.S. dollar, euro, or pound, or in some cases to commodities such as gold.

Stablecoins such as USDC and USDT are built to avoid the sharp price swings that limit Bitcoin’s usefulness as everyday money. This stability has made them central to crypto markets. Around 80% of all trades on centralized exchanges are executed using stablecoins, highlighting their role as the backbone of crypto liquidity.

Key Points

  • MUFG Bank analyst Lee Hardman says stablecoins work better as money than volatile Bitcoin.
  • Dollar-pegged tokens like USDT and USDC now power about 80% of crypto exchange trades.
  • Stablecoin market cap tops $310B, with nearly 99% tied to U.S. dollar-backed digital tokens.
  • Hardman says stablecoins better meet money’s three roles, offering price stability and fast, low-cost payments.

Stablecoins Dominate Crypto Liquidity

Hardman noted that USDT, issued by Tether, remains the largest and most widely used stablecoin globally. It is pegged to the U.S. dollar and backed by cash and U.S. Treasury bills. USDT dominates liquidity across Asia, Latin America, and other emerging markets.

It is commonly used for savings, cross-border remittances, DeFi activity, and as a base trading pair across crypto platforms, accounting for more than 70% of stablecoin trading volumes.

Market Cap Surpasses $310 Billion

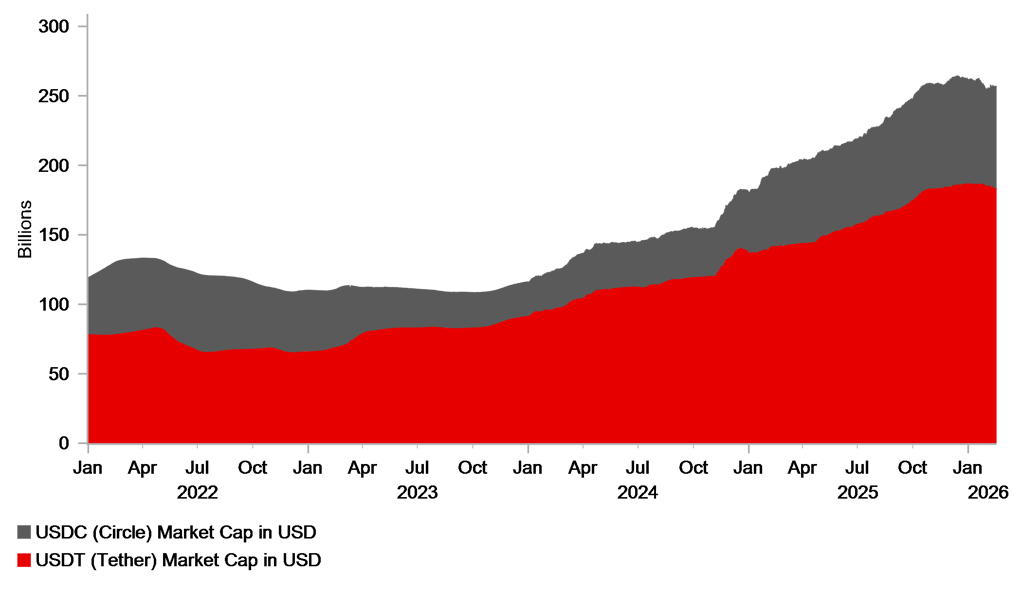
The total market capitalization surpassed roughly $310 billion earlier this year, with nearly 99% of that value tied to U.S. dollar-pegged tokens. USDT alone stands at about $184 billion in market cap, while USDC is near $74 billion.

Stablecoins now represent around 13% of the total crypto market, a share Hardman expects to rise over the next decade. Some estimates suggest the sector could grow to between $2 trillion and $4 trillion by 2030.

Chart by MUFG Bank
Chart by MUFG Bank

Fulfilling the Three Functions of Money

According to Hardman, stablecoins are better positioned than Bitcoin to fulfill the three main functions of money: a medium of exchange, a unit of account, and a store of value.

Their price stability makes them easier for merchants and users to accept, as there is less risk of value loss during transactions. They also enable near-instant global payments, operate 24/7, and typically carry lower fees than traditional banking or card networks.

As a result, stablecoins have become the preferred medium of exchange within digital environments, widely used for trading, lending collateral, and payments.

Hardman added that their appeal could be even stronger in high-inflation economies, where access to stable, dollar-linked digital cash can offer a practical alternative to weakening local currencies.
Has Bitcoin Bottomed or Could Deeper Lows Play Out? Bloomberg Fields Industry Opinions

0

Bloomberg recently fielded industry opinions on the ongoing Bitcoin downtrend, assessing whether the market has reached a bottom yet.

Notably, Bitcoin has erased more than $1 trillion in market value since its October 2025 peak, and investors have now continued to ask an important question: has the market finally found a floor, or is there more pain ahead?

In a recent report, Bloomberg examined the latest price slide and gathered opinions from finance industry leaders as uncertainty continues to weigh on crypto.

Key Points

  • Amid the ongoing downtrend, Bitcoin has lost $1.17 trillion in market value since dropping from the $2.52 trillion peak in October 2025.
  • Bitcoin initially slid to $59,000 earlier this month, but has since recovered to the $67,000 region.
  • Now, investors are split on whether the $59,000 low marked Bitcoin’s bottom for the ongoing downtrend or steeper declines could play out.
  • Koinly’s CEO told Bloomberg that the market does not yet show the capitulation signs that defined past cycle bottoms.
  • CryptoQuant spotlighted multiple concerning metrics, but insisted that bear market bottoms often take time to form.

Bitcoin Suffers a $1.17T Drop Since October

For context, Bitcoin reached a market capitalization of $2.52 trillion in October 2025. Since then, it has lost $1.17 trillion, bringing its valuation down to $1.35 trillion. The price has fallen 41% from those October highs and now trades around $67,000.

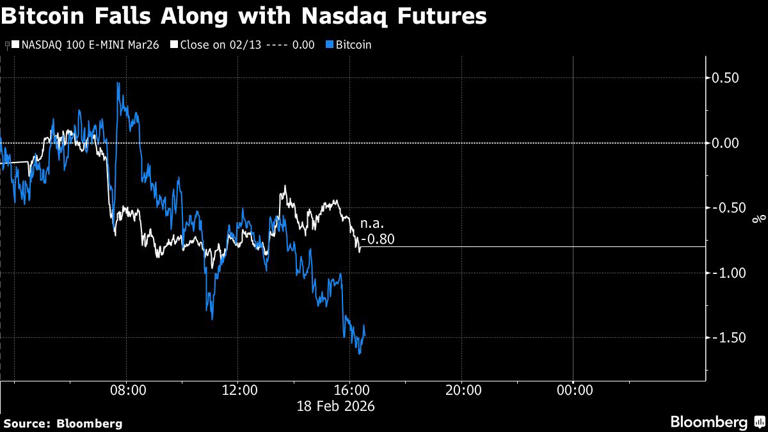
According to Bloomberg, the latest decline came ahead of the U.S. market open following a three-day break. The report noted that Bitcoin fell as much as 1.7% on Tuesday. At the same time, Nasdaq 100 futures slid 0.9%, and S&P 500 contracts dropped 0.6%, pointing to a weaker start.

Bitcoin Falls Along with Nasdaq Futures Bloomberg
Bitcoin Falls Along with Nasdaq Futures | Bloomberg

Bloomberg said Bitcoin has behaved like a high-beta technology stock in recent months, often moving in step with equity markets, and it again followed that pattern.

The report also suggested that macro concerns have led to the recent mood. Specifically, investors are watching rising geopolitical tensions around Iran and discussing whether artificial intelligence could have economic effects beyond the tech sector. 

Bitcoin Sees ETF Outflows and Fragile Sentiment

Bloomberg highlighted continued pressure from fund flows. Notably, U.S.-listed Bitcoin ETFs recorded a fourth straight week of net outflows, with $360 million pulled last week alone. This steady withdrawal of capital has added to the headwinds facing the market.

Sentiment indicators also show a clear strain. Bloomberg reported that CryptoQuant’s Fear and Greed Index stood at 10 out of 100 on Monday, placing it in extreme fear territory. Such a low reading shows how cautious investors have become during this 41% pullback.

Has Bitcoin Bottomed?

Speaking on the downtrend, Paul Howard, senior director at market maker Wincent, told Bloomberg that macro news has guided crypto’s risk profile over the past 12 months. He expects Bitcoin to move sideways for a while as it looks for fresh drivers of sentiment. 

Meanwhile, Robin Singh, CEO of crypto tax platform Koinly, said many traders see $60,000 as an important support level. However, he warned that if risk appetite weakens further, that level might not hold. 

Singh added that another bout of macro instability or prolonged trading in the mid-$60,000 range could send Bitcoin back into the $50,000s. He believes the market does not yet show the deep capitulation that has marked past cycle bottoms.

On-Chain Data Suggests More Time May Be Needed

Notably, on-chain analytics firm CryptoQuant argued that bear market bottoms usually take time to form. The firm noted that Bitcoin holders realized $5.4 billion in daily losses on Feb. 5, the largest since March 2023 and even higher than levels seen after the FTX collapse. 

Still, monthly cumulative losses in BTC terms stand at 0.3 million BTC, far below the 1.1 million BTC recorded in late 2022, which suggests the market has not yet gone through a full structural washout.

CryptoQuant also said major valuation metrics have not reached historical capitulation zones. The MVRV ratio remains outside the extreme undervalued area, while NUPL has not fallen to the roughly 20% unrealized loss level that typically signals a bottom. In addition, 55% of the supply remains in profit, compared with the 45% to 50% range seen at prior cycle lows.

The firm added that long-term holders are currently selling around breakeven, or 0% profit. In past bear markets, bottoms formed when these holders absorbed losses of 30% to 40%. 

CryptoQuant’s Bull-Bear Market Cycle Indicator also remains in the Bear region rather than the Extreme Bear region that often marks the start of bottoms. Bitcoin still trades about 18% above its realized price near $55,000, while earlier cycle lows saw price fall 24% to 30% below realized price before spending four to six months building a base.

Ripple CEO Projects 80% Odds of Clarity Act Passage by April

0

Ripple CEO Brad Garlinghouse has expressed strong confidence that the Digital Asset Market Clarity Act could become law by April 2026. 

Garlinghouse recently stated there is an 80% chance U.S. President Donald Trump will sign the bill into law by then, signaling that the long wait for regulatory clarity in the crypto industry may soon end. 

Key Points 

  • Brad Garlinghouse says the Clarity Act is nearing the Senate Banking Committee markup stage once again.
  • He projects an 80% chance the U.S. president will sign the bill into law by the end of April.
  • Banking and crypto leaders face a late-February deadline to resolve disputed provisions.
  • Although the bill has bipartisan backing, Treasury Secretary Scott Bessent warns support could fade if Democrats retake the House in November.

Clarity Act Nears Banking Committee Markup Process 

Despite recent delays, Garlinghouse emphasized that the bill is approaching the Senate Banking Committee markup, an important step in the legislative process. 

Although the Senate Agriculture Committee’s markup concluded on a positive note, the Banking Committee postponed its own markup in January after disagreements emerged between banking leaders and crypto executives, particularly over provisions such as stablecoin yields.

Meanwhile, as negotiations continue behind the scenes, Garlinghouse urged the crypto community to resist letting frustration or perfectionist demands derail progress. He stressed that while no legislation is flawless, regulatory clarity remains far preferable to prolonged uncertainty.

In the meantime, reports suggest that private discussions are gaining momentum, which further supports Garlinghouse’s projection of an 80% chance that the U.S. president will approve the bill by the end of April. 

Why Ripple Backs Broader Crypto Clarity

Drawing on Ripple’s multi-year legal battle with the SEC, he underscored the need for firm legal certainty. Although a federal court ruling confirmed that XRP is not a security, delivering much-needed clarity for Ripple, he argued that the broader crypto sector still lacks comprehensive regulatory guidance. 

Essentially, since Ripple’s growth depends on the overall success of the digital asset ecosystem, Garlinghouse affirmed the company’s strong support for legislation that benefits the entire industry. Notably, his optimism mirrors remarks from Ripple CLO Stuart Alderoty, who last week signaled that imminent progress was underway on the bill. 

Current Status 

Meanwhile, Treasury Secretary Scott Bessent has urged the Senate to pass the Clarity Act swiftly to ease crypto market volatility. Despite confirming that a bipartisan group is currently working to pass the bill, he pressed lawmakers to act quickly before November, when Democrats could potentially retake the House.

Although banking and crypto executives remain divided over the Senate Banking Committee draft, reports indicate both sides face a February deadline to reach an agreement, supporting Garlinghouse’s projection that the bill could become law by April.  

After Topping Solana, XRP Looks to Overtake BNB in Tokenized RWA as It Adds $354M in 30 Days

0

The XRP Ledger is now pushing to overtake BNB Chain as the fifth-largest network by total tokenized real-world assets.

While prices have struggled across the broader market, with the global crypto market cap losing $628 billion this year alone, the tokenization narrative has only gained steam, and the XRP Ledger (XRPL) is riding on the momentum to secure its spot among the largest networks by real-world assets value.

Over the past 30 days, the XRPL has welcomed nearly $354 million worth of tokenized real-world assets (RWA), bringing its total RWA value to $1.874 billion at press time, excluding stablecoins. With this, the XRPL is now looking to overtake BNB Chain as the fifth-largest network by RWA value after surpassing Solana last month.

Key Points

  • While the XRP price has struggled amid a broader market downturn, its tokenization market has thrived, adding $354 million in the last 30 days.
  • The latest additions have brought XRP’s total RWA value to $1.874B, including distributed and represented assets, while excluding stablecoins.
  • This places the XRP Ledger sixth among the largest networks by tokenized real-world assets, immediately behind BNB Chain with $2.3 billion.
  • The XRPL’s journey to the sixth position saw it surpass Solana, which currently boasts $1.7 billion in RWA, excluding stablecoins.
  • Now, the XRPL looks to overtake BNB Chain as the fifth-largest chain, requiring an additional $400M to achieve this feat.

XRPL Surpasses Solana

XRP’s campaign in the tokenization space picked up in Q4 2025 and has continued to gain steam. At the start of this year, the XRPL had $673 million worth of total RWA, excluding stablecoins, per RWA.xyz. While this represented an addition of $326 million from Q4 2025, nearly double the value, the ledger still trailed behind other prominent networks.

For instance, Solana boasted a whopping $1.1 billion worth of real-world assets at the start of 2026, outpacing XRP. Moreover, other networks such as Polygon and Liquid stood above the XRPL, with the ledger sitting ninth among the largest networks by RWA. 

Interestingly, today, the XRPL now hosts $1.874 billion worth of RWA, outpacing Polygon, Liquid, and even Solana. Currently, Solana features $1.7 billion in real-world assets, having added $600 billion this year. Meanwhile, XRP has welcomed $1.2 billion within the same period, now the sixth-largest network.

XRP Ledger Sixth in Total RWA

XRP Now Looking to Overtake BNB

The XRP Ledger has now set its eyes on BNB Chain, which holds the fifth position with $1.9 billion. XRP’s momentum has been undeniable, especially over the past 30 days, as it has recorded a 22.38% increase in total RWA value.

For context, this translates to an additional $354 million welcomed within this period, as the XRPL went from $1.520 billion in total RWA on Jan. 18, 2026, to the current figure of $1.874. Notably, Ondo’s US Government Bond, the Diamonds: AD Collection 1 products contributed mostly to this increase.

Now, the XRP Ledger just needs to host an additional $400 million in RWA to overtake BNB Chain as the fifth-largest network by total RWA, excluding stablecoins. Interestingly, when it comes to represented real-world assets alone, the XRPL shines, sitting fourth with $1.5 billion. It towers over Polygon and Ethereum. BNB Chain and Solana do not make it to the top 10.

XRP Ledger Fourth in Represented RWA

Bitcoin Maxi Simon Dixon Says XRP and Ripple Are a “Psyop”

0

Bitcoin advocate Simon Dixon, founder of Bnk To The Future, has described Ripple and XRP as part of what he called a “psyop” within crypto.

In a recent podcast, Dixon argued that the rise of altcoins, specifically XRP and Ripple, fractured the Bitcoin community and distracted people from Bitcoin’s original mission. Specifically, he suggested that what he views as “shitcoinery and gambling” divided participants through financial incentives, creating internal conflict rather than unity.

According to Dixon, the split between Bitcoin and projects like XRP represented a “divide and conquer” dynamic. He claimed that, over time, it became increasingly difficult to explain the difference between Bitcoin and XRP to newcomers, which he believes weakened Bitcoin’s position during its early growth phase.

Key Points

  • Simon Dixon, founder of Bnk To The Future, calls XRP a crypto “psyop.”

  • He links Mt. Gox and forks like Bitcoin Cash to divide-and-conquer tactics.

  • XRP backers cite XRP Ledger speed, low fees, and bank adoption to counter critics.

  • The Bitcoin–XRP feud endures as both grow into major global crypto ecosystems.

Linking XRP to “Ops” Narrative

Dixon extended his argument beyond XRP, describing several historic crypto events as potential “operations” that fragmented the ecosystem. He referenced the collapse of Mt. Gox, as well as Bitcoin’s block size wars and subsequent forks like Bitcoin Cash and Bitcoin SV, as examples of how communities splintered over time.

He speculated that figures such as Brock Pierce may have played roles in events that contributed to division. He also mentioned possible links involving Jeffrey Epstein, a controversial American financier.

Dixon described these episodes as “divide and conquer” tactics. He argued that breaking Bitcoin into competing factions weakened the movement, even though Bitcoin later recovered and grew stronger.

XRP Supporters Push Back

Supporters of XRP rejected Dixon’s claims. X user Nepentia argued that politics aside, “the ledger doesn’t lie”. She highlighted the XRP Ledger’s performance, including three-second settlement times, very low fees, and more than a decade of banking integrations.

Notably, this latest conversations build on an earlier technical debate involving XRP and Bitcoin. Specifically, on February 3, Marshall Hayner, an early Bitcoin developer, tweeted that Bitcoin still has not delivered a fully decentralized and scalable system that matches its original vision.

Former Ripple director Matt Hamilton responded that Bitcoin’s scaling issues were addressed years ago with the creation of the XRP Ledger. He claimed early Bitcoin developers built XRPL specifically to fix problems related to speed, fees, and transaction capacity.

Historically, Jed McCaleb, one of Bitcoin’s early developers and founder of Mt. Gox, co-created the XRP Ledger in 2011 with David Schwartz and Arthur Britto. McCaleb later co-founded Ripple before leaving to start Stellar. Supporters argue this history shows XRPL grew directly out of Bitcoin’s early technical challenges.

Bitcoin and XRP Rivalry

The rivalry between the Bitcoin and XRP communities remains one of crypto’s longest-running debates. While some Bitcoin maximalists argue XRP undermines decentralization principles, others increasingly see the two assets serving different roles: Bitcoin as a store of value and XRP as a payments infrastructure.

Dixon’s comments highlight how ideological divides continue to shape crypto discourse. Yet despite years of conflict, Bitcoin and XRP have grown into multi-billion-dollar ecosystems with institutional backing and global adoption.

Ultimately, whether XRP is a distraction, a complement, or a direct competitor to Bitcoin remains a matter of perspective.

Serial Entrepreneur Andrew Parish Sees Bitcoin Rally Beyond $500K in 3 Years

0

Bitcoin is at the center of a heated market debate. One entrepreneur predicts it could rise to $500,000 in a few years, while a top strategist warns it might fall to $10,000.

Currently, Bitcoin trades around $68,136 after weeks of big swings.

Key Points

  • Andrew Parish predicts Bitcoin could hit $500,000 within three years, citing extreme retail pessimism as a buying opportunity.
  • Veteran investor Ric Edelman notes that even a 1% allocation of global wealth (~$7.5 trillion) to Bitcoin could support prices near $500,000 over time.
  • Bloomberg strategist Mike McGlone predicts Bitcoin could plunge to $10,000.
  • Bitcoin trades near $68,136, following a 30% drop in the past month amid broader crypto market losses.

Bullish Outlook: Bitcoin to $500,000 by 2029

Amid the recent pullback, Andrew Parish, a serial entrepreneur and outspoken Bitcoin advocate, argues that the weakness represents opportunity rather than risk. Writing on X, Parish said prices below $70,000 are a strategic entry point. In fact, he predicted Bitcoin would exceed $500,000 within three years.

To reach that level from current prices, Bitcoin would need to rise roughly 634%. That implies an annualized return of about 95.5% over the period.

Parish’s outlook rests largely on sentiment indicators. Specifically, he contends that retail investors have turned excessively pessimistic. 

As evidence, he cited the Fear and Greed Index, which fell to 5 on February 6 — its lowest reading since inception. Notably, on that same day, Bitcoin traded near $60,000, marking its weakest point in the current correction.

The broader backdrop reinforces his contrarian stance. Over the past month, Bitcoin has declined nearly 30%, while the broader cryptocurrency market has shed approximately $2 trillion in value.

Meanwhile, according to DefiLlama, $678 million flowed out of Bitcoin exchange-traded funds in February alone, thereby extending total ETF outflows to roughly $6 billion since November.

Parish believes such selling pressure could create an opportunity for institutional investors. He specifically referenced BlackRock, arguing that large asset managers often accumulate assets when retail sentiment deteriorates. In his view, this counter-cyclical buying could lay the foundation for the next major rally.

Institutional Allocation Thesis Gains Momentum

Parish’s optimism is echoed by veteran investor Ric Edelman, who has also outlined a path toward $500,000 per Bitcoin — albeit on a slightly longer timeline. Edelman projects the cryptocurrency could reach that level by 2030, primarily driven by gradual portfolio allocation across global markets.

His thesis centers on expanding participation. Edelman argues that the vast majority of global investors still lack exposure to Bitcoin. As the asset class matures, he expects allocations from governments, pension funds, sovereign wealth funds, hedge funds, insurers, banks, and brokerages.

To illustrate the scale of potential inflows, Edelman points to the size of global wealth. He estimates that stocks, bonds, real estate, gold, and cash collectively total about $750 trillion. Real estate alone is approximately three times the size of the stock market, while global cash holdings total about $56 trillion.

From this perspective, even a modest reallocation could have a significant impact. For instance, if diversified portfolios were to allocate just 1% to Bitcoin, inflows could reach around $7.5 trillion. When combined with Bitcoin’s existing market value, Edelman argues such demand could support prices approaching $500,000.

Bearish Warning: Risk of a Steeper Decline

However, not all analysts share this optimistic view. Offering a stark counterpoint, Mike McGlone, a macro strategist at Bloomberg Intelligence, has warned that the crypto market may face deeper losses.

Specifically, in a post on X, he wrote that the market bubble is deflating and suggested Bitcoin could drop another 85%, potentially falling to $10,000.

McGlone questions whether the long-standing “buy the dip” strategy remains effective in today’s environment. He contends that the broader investment landscape has shifted, with strong equity performance and subdued volatility drawing capital away from crypto markets. He also pointed to weakening confidence in U.S. President Donald Trump’s crypto-friendly messaging as a potential headwind.

Additionally, McGlone highlighted aggressive profit-taking in gold and silver markets, noting that the pace resembles activity last seen roughly half a century ago. In his assessment, these signals collectively suggest sustained pressure on risk assets — including Bitcoin.

Taken together, the market now stands between two sharply divided outlooks. While some investors see a historic opportunity in negative sentiment, others interpret current conditions as a warning of further downside. Ultimately, as volatility persists, Bitcoin’s next move will likely determine which narrative prevails.

SBI Shareholders Sitting on 4X Gains From XRP Distributions Since 2020

0

Shareholders of SBI Holdings who opted to receive XRP as part of the company’s shareholder benefit program are now sitting on gains of more than four times their average acquisition price.

The update was highlighted by XRP community figure Eri, who pointed to the firm’s latest financial results presentation delivered on February 4, 2026.

Key Points

  • SBI shareholders who chose XRP since 2020 are now sitting on 4x gains from their average acquisition price.

  • Over six distribution rounds, the weighted average purchase price came in at just JPY 58.8 per XRP.

  • With XRP recently trading near JPY 252, earlier allocations from 2019–2022 have surged in value.

  • Despite a 60% drop from its peak, XRP still delivers strong long-term gains for SBI investors.

XRP Distributions Began in 2020

SBI began distributing XRP to eligible shareholders in March 2020 as part of its shareholder benefits program. Since then, six distributions have been made. Under the program:

  • A benefit equivalent to JPY 8,000 translates to 816 XRP.
  • A JPY 2,000 benefit translates to 204 XRP.

Over the six rounds, the weighted average acquisition price per XRP came in at JPY 58.8.

Image

Market Value Now 4X Higher

As of February 2, 2026, the market value of the distributed XRP stood at approximately JPY 252.46 per token. That places the holdings at roughly four times the average acquisition price, according to Slide 12 of SBI’s financial results presentation.

The chart in the report shows that earlier distributions, particularly those in fiscal years 2019 through 2022, were made when XRP was trading significantly lower. In some cases, the price ranged from around ¥20 to ¥100. With XRP recently trading near ¥250, those allocations have appreciated sharply.

Notably, these estimates in Japanese yen also closely align with XRP’s dollar value. For instance, XRP traded around $0.285 in 2019 and remained within that range for subsequent years. It was not until November 2024 that XRP’s price decisively broke out from $0.50 to $1, $2, and later $3 within three months. This 7x price surge is reflected in the Japanese market as well.

Meanwhile, as of today, XRP is trading around $1.45, having lost over 60% of its value from its peak. Yet SBI investors are still roughly four times richer in XRP compared to their initial distribution.

Long-Term Exposure Paying Off

The data shows the benefit of holding XRP for the long term. Instead of buying at market highs, SBI’s shareholder program allowed investors to receive XRP at an average price far below today’s market value.

SBI has maintained a strong partnership with Ripple and remains one of the largest institutional supporters of XRP in Japan and across Asia. Its chairman, Yoshitaka Kitao, recently stated that SBI Holdings’ 9% stake in Ripple is worth more than $10 billion in XRP.

Now that XRP is trading several times higher than the average distribution price, shareholders who kept their tokens are sitting on significant unrealized gains. This has strengthened confidence in SBI’s crypto-related shareholder programs.

Standard Chartered Recent XRP Predictions Align With Fibonacci Targets of $8, $13, and $27

0

Data indicates that Standard Chartered’s latest XRP price predictions align with key Fibonacci extension targets all the way to $27.

XRP may be witnessing steep declines, down nearly 60% from its July 2025 all-time high of $3.6, but the broader market has maintained around its long-term potential despite lowered short-term targets.

Notably, global bank Standard Chartered recently reviewed its long-term XRP targets, lowering the 2026 target to $2.8 but increasing the targets tied to 2028 and beyond. Interestingly, data shows the new targets align with key Fibonacci extension levels.

Key Points

  • XRP has not escaped the broader market bloodbath that began in Q4 2025, currently down nearly 60% from its July 2025 all-time high.
  • Despite the consistent downtrend, optimism around XRP’s long-term value proposition remains high.
  • Global bank Standard Chartered recently lowered its short-term XRP targets amid the turbulence, but increased its long-term targets tied to 2028 and beyond.
  • Interestingly, market data indicates that the recent targets align with key Fibonacci extension levels all the way to $27.

Standard Chartered’s Reviewed XRP Targets

Market watcher Chart Nerd spotlighted these targets as he discussed XRP’s long-term prospects following Standard Chartered’s latest review. For context, Standard Chartered recently reduced its XRP price target for 2026 amid the ongoing turbulence that has pushed the token below $2 for nearly two months.

In its earlier projection, Standard Chartered suggested that XRP could soar to a price of $8 in 2026 and then reach $10.4 by next year. Notably, this was a revision of its previous prediction, and at the time of this revision, XRP held strong above $2 despite mounting selling pressure.

Now, the multinational bank has reduced its 2026 target to just $2.8, even lower than XRP’s $3.6 all-time high in July 2025. At the current price of $1.48, XRP would only need to rise 89% to claim the $2.8 target. Meanwhile, Standard Chartered cut its 2027 target from $10.4 to $7, representing a 372% rise from the current price.

Revised XRP Price Predictions Standard Chartered
Revised XRP Price Predictions | Standard Chartered

New Targets Align with Key Fibonacci Levels

Interestingly, while Standard Chartered lowered its 2026 and 2027 targets, the bank actually increased its longer-term targets. Specifically, they hiked their 2028 target from $12.5 to $12.6, increased the 2029 target from $12.25 to $19.6, and then set the 2030 target at $28.

Chart Nerd stressed that these targets align with Fibonacci extension levels he identified in previous analyses. Notably, the market watcher shared that during the November 2024 rally, XRP broke above a symmetrical triangle on the monthly chart that had capped its upside potential since January 2018.

This breakout kept XRP above the triangle throughout 2025, but the current downtrend, which began in Q4 2025, has now pushed prices back to retest the upper trendline. Such a retest is natural after a breakout, and often tests the strength of the breakout.

XRP Fibonacci Targets Chart Nerd
XRP Fibonacci Targets | Chart Nerd

Chart Nerd expects XRP to soar from the current price region once it completes the retest of the breakout, identifying multiple Fib. targets for this uptrend. The first target sits at Fib. 127.2% ($8.47), aligning with Standard Chartered’s $7 target for 2027, while the second level rests at Fib. 141.40% ($13.7), aligning with the bank’s $12.6 target for 2028. The ultimate price target is $27 at Fib. 161.8%.

Shiba Inu Tokens Pouring into Exchanges—A New Setback for Rebound Prospect?

0

Shiba Inu net exchange flow has risen sharply, putting pressure on supply and further hurting the prospects of a price recovery.

Exchange flow reflects the sentiments of enthusiasts, showing their stance on their holdings. A rise may indicate distribution, a decline could show accumulation, while a near-zero net flow often points to neutrality.

Key Points

  • Shiba Inu net exchange flow has risen sharply, putting pressure on supply and further hurting the prospects of a price recovery.
  • A rise in exchange netflow may indicate distribution, a decline could show accumulation, while a near-zero net flow may suggest neutrality.
  • The net difference between inflows and outflows was 182 billion SHIB tokens, reflecting a sharp 113% spike in the past 24 hours.
  • Exchange reserve data show a rise in the amount of Shiba Inu held by exchanges, from 81.135 trillion on February 15 to 8.341 trillion today, a 2% rise.
  • Unless this changes and other key market indicators stabilize, SHIB risks further price corrections.

Exchange Flow Spikes in Past 24 Hours

After a near-zero flow over the weekend, exchange netflow spiked on Monday as holders increasingly shifted their Shiba Inu holdings to exchanges. Per CryptoQuant, the net difference between inflows and outflows was 182 billion SHIB tokens, reflecting a sharp 113% spike in the past 24 hours.

Shiba Inu Trending Metrics

This is notable, as it could suggest a tilt towards selling rather than holding through the market turbulence. More movements to exchange show that holders are willing to swap their Shiba Inu for stablecoins or other cryptocurrencies, which affects sentiment and price.

In addition, exchange reserve data confirms this. The metric highlights a spike in the amount of Shiba Inu held by exchanges from 81.135 trillion on February 15 to 8.341 trillion today, representing a 2% rise. Much of this inflow happened on Sunday and Monday, with data showing just a 0.22% increase in the past 24 hours.

New Shiba Inu Price Setback?

In this context, more positive exchange netflow could lead to increased selling pressure. With demand still weak, adding to the meme coin’s supply has a negative impact on the price.

SHIB has been in a prolonged downtrend, aligning with the broader market trend. In the past 30 days, the token has retraced by 22%, trading near the key support area at $0.0000064. Such exchange flows make recovery attempts more difficult, as each uptrend is met with renewed selling pressure.

Unless this changes and other key market indicators stabilize, SHIB risks further price corrections. SHIB is already down nearly 2% since the start of today in a bear-controlled market condition.

Active Addresses and Transaction Counts Keep Hopes Alive

Interestingly, active addresses and transaction count offer a glimmer of hope. While others, like price and volume, have dropped in the past 24 hours, these metrics continue to spark optimism.

The total number of unique active wallets in the Shiba Inu ecosystem rose by 0.87% over the past 24 hours, suggesting persistent user activity despite price volatility. The total number of transactions on the network also increased by 0.81%. 

Solana Price Prediction for Feb 17: Can SOL Breach Key Breakout Levels for a Substantial Surge? 

0

Solana shows short-term bullish momentum but faces resistance around key areas. Can SOL breach major breakout levels? 

Solana (SOL) is currently trading at $86.25, showing a 1.2% surge over the past 24 hours. The price has shown resilience after dipping to a low of $82.87 and reaching a high of $87.41, indicating moderate volatility during the day. This $4.54 daily price range between the lows and the highs shows the market’s active movement, with the price trending upwards as the day progressed, suggesting some bullish momentum.

In terms of trading volume, Solana has seen a 24-hour volume of $3.60 billion, down over 12%. On the other hand, the market cap is currently at $48.97 billion, up about 1.44%. 

While Solana has shown positive performance in the short term, it is still down by 39.6% over the last 30 days and 53% over the past year. Traders will now be watching if Solana can sustain its upward momentum and break through key resistance levels.

Where’s Solana Headed?

On the daily chart, Solana is facing immediate resistance near the $91.69 level, as indicated by the middle band of the Bollinger Bands indicator. The price is currently moving towards this band, while the upper band is above at $114.65, indicating that the price is still well below its breakout levels.

Solana Prediction
Solana Prediction

In terms of support, Solana has found a floor around $67.74, just above the lower Bollinger Band placed at $68.73. If Solana bears were to take over, they would need to break below the lower band first, then the next support level at $60.

The Average True Range, currently at 6.94, indicates low and declining volatility in comparison to earlier periods. The ATR level shows that the price won’t experience extreme fluctuations unless momentum shifts significantly. This would be either a breakout direction above $91.69 or a breakdown below $68.73.

Can Solana Reclaim $90?

Meanwhile, veteran trader BitGuru recently observed that Solana has been following a clear downtrend for weeks in the 4-hour timeframe, characterized by lower highs and lower lows. However, the market is now attempting a small rebound after holding a key support zone. 

SOL 4H Chart
SOL 4H Chart

According to his commentary, SOL is currently trying to reclaim the $90–$95 resistance area. This could be crucial for determining whether the price can continue to recover or if it will face further downside pressure.