Home Blog Page 302

Possible XRP Price at $1T Market Cap and Potential Timeline

0

As projections point to XRP reaching a $1 trillion market cap, this breakdown explains how much a single token could be worth at that level. 

Key Points

  • XRP’s Potential to Reach a $1 Trillion Market Cap: Market analysts estimate that XRP could achieve a $1 trillion market valuation, driven by strong demand for XRP spot ETFs and increased institutional interest.
  • Implications of a $1 Trillion Market Cap on XRP’s Price: If XRP attains a $1 trillion market cap with a circulating supply of 60.7 billion tokens, its price would be approximately $16.47 per token.
  • Projected Timeline for XRP to Hit $16: Analysts predict XRP could reach a $16 price point between 2027 and 2030, depending on the pace of adoption and regulatory developments.
  • Scenarios for XRP’s Growth Timeline: The timeline ranges from 1-3 years in an aggressive scenario, 3-5 years in a moderate scenario, to 4-10 years in a conservative outlook, based on different levels of institutional adoption and regulatory clarity.
  • Factors Influencing XRP’s Long-Term Valuation Growth: Growth factors include expanded role in global DeFi ecosystems, cross-border payments, and deeper integration into banking and fintech platforms.

XRP to $1T Market Cap Projections

Despite XRP muted price action, many market watchers still believe XRP can reach significantly higher valuations, including a potential $1 trillion market cap in the long term. In addition, some analysts highlight strong demand for XRP spot ETFs, arguing that such products could reduce the circulating supply and act as a catalyst for further price appreciation. 

For instance, in June 2025, market analyst EGRAG identified a developing W-shaped pattern in XRP’s market cap chart, projecting that the formation could drive the asset’s valuation toward the $1 trillion mark.

In the same year, Omni founder Austin King also weighed in, emphasizing the need for XRP to expand its role in the global DeFi ecosystem if it hopes to become a trillion-dollar asset.

Notably, this projection has gained momentum amid renewed discussions around institutional adoption and the growing role of XRP in cross-border payments. 

XRP Price If Token Reaches a $1T Valuation 

While a $1 trillion valuation would place XRP among the most valuable digital assets in history, it is essential to understand what such a market cap would mean for the token’s price. In simple terms, a token’s market cap results from multiplying its circulating supply by its unit price. Conversely, determining the price of a single token requires dividing the total market cap by the circulating supply. 

At press time, XRP has an estimated circulating supply of about 60.70 billion tokens. Accordingly, if XRP were to reach a $1 trillion market cap, its implied price would stand at approximately $16.47, calculated by dividing $1 trillion by 60.70 billion tokens.

This implies that XRP will trade within the $16 price range, assuming it reaches a market cap of $1 trillion, while its circulating supply remains stable at 60.7 billion. Any future increase in XRP’s circulating supply, particularly from Ripple’s monthly token unlocks, would marginally lower the price needed to sustain a $1 trillion market valuation. 

Potential Timeline for XRP to Trade at $16 

Several entities have offered projections on when XRP could trade near $16 or reach the $1 trillion market cap milestone. Notably, analysts at Changelly estimate that XRP could reach $16 toward the end of 2030, roughly four years from now.

However, ChatGPT presents a broader range of possibilities. Under a conservative scenario, it suggests that XRP could hit the milestone within five to ten years (2031–2036). This prediction is driven by gradual adoption by banks and payment providers alongside clearer regulatory frameworks across major economies.

Under a moderate outlook, the chatbot projects a faster timeline of three to five years (2029–2031). In this case, wider use of XRP for cross-border settlements and accelerating institutional adoption would propel the token toward a $1 trillion market cap.

In contrast, the aggressive scenario sets an even shorter window of one to three years (2027–2029). This outcome would depend on XRP becoming deeply integrated into banking and fintech platforms while emerging as a standard liquidity layer for global payments. 

Potential Timeline XRP Could Reach $1T Market Cap

Bitcoin Sees Largest Long-Term Holder Supply Release in History

0

The current Bitcoin market cycle may be about more than price action. 

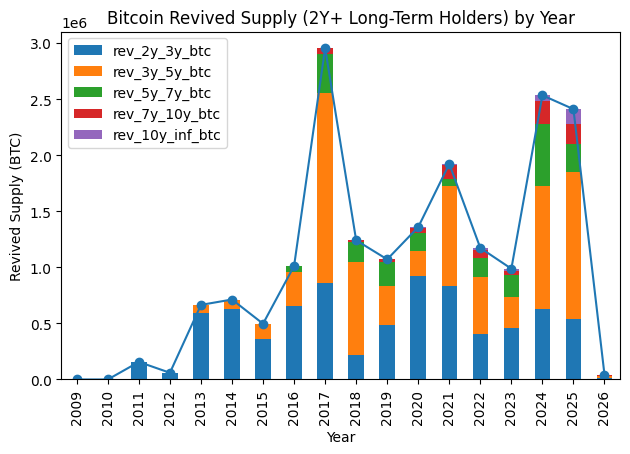
According to CryptoQuant author Kripto Mevsimi, on-chain data shows that 2024 and 2025 recorded the largest release of long-term Bitcoin supply in the asset’s history.

The analysis focuses on “revived supply,” meaning Bitcoin that remained untouched for more than two years before moving. These coins typically belong to long-term holders and tend to move only during major market shifts, not short-term price swings.

Notably, the amount of revived supply in this cycle is larger than that observed in the 2017 and 2021 bull markets.

  • Bitcoin recorded the largest long-term holder supply release in its history in 2024–2025.

  • On-chain data shows older coins moving with less hype than in past bull markets.

  • Long-term holders appear to be selling as new, price-driven buyers step in.

  • BTC remains under pressure as global macro risks continue to weigh on markets.

Not a Typical Bull Market Pattern

Unlike past cycles, when long-term Bitcoin supply moved amid heavy speculation and strong price rallies, the current revival is unfolding under different conditions.

Kripto Mevsimi notes that this supply is moving with less market hype and involves a significant number of older coins. This suggests the activity is not driven by short-term traders but by long-term holders reassessing their Bitcoin positions.

From an on-chain perspective, this makes the current cycle structurally different from previous market peaks.

CryptoQuant's chart
CryptoQuant’s chart

Long-Term Holders Reassess, New Buyers Step In

The data suggests Bitcoin ownership is gradually shifting. Early holders, who focused on halvings, self-custody, and long-term scarcity, are selling to a new group of buyers.

These new participants are more driven by price action, macroeconomic conditions, and liquidity than by long-term ideology. As a result, Bitcoin’s supply dynamics are changing, altering how future market cycles unfold.

Early 2026 Shows Moderation, Not a Full Reversal

While revived long-term supply has cooled slightly in early 2026 compared to the peaks in 2024–2025, the trend has not fully reversed. Kripto Mevsimi cautions that it is still too early to determine whether this slowdown signals temporary exhaustion or the beginning of a new accumulation phase.

More clarity should emerge as the year progresses and on-chain activity evolves.

This analysis comes at a time when Bitcoin’s price continues to struggle, particularly amid macroeconomic pressure. BTC is trading at $88,800, down 1.15% over the past day. The weakness has persisted since October, when Bitcoin peaked at $126,200 and has since declined by more than 30%.

Global Risk Weighs on Bitcoin Price

According to XWIN Research, Bitcoin’s recent declines are largely driven by rising global macroeconomic risk rather than crypto-specific weakness. The firm links the downturn to U.S. tariff pressures under President Trump, which have weighed on investor risk appetite since 2025.

XWIN notes that tariffs can hurt corporate earnings, raise inflation uncertainty, and tighten monetary expectations—conditions that typically prompt investors to reduce exposure to risk assets. As a result, Bitcoin has fallen alongside equities during periods of elevated trade tension.

Bitcoin Loses Key Cost Basis Level—What Does It Mean for the Bull Market?

0

Bitcoin (BTC) has fallen below a crucial market sentiment gauge and has failed to reclaim it, further piling pressure on its price.

The crypto market leader has corrected over 4% so far this week, relinquishing all the gains from the previous week. This correctional move has ensured it stays below the 0.75 supply cost-basis quantile, a key market sentiment indicator.

Key Points

  • Bitcoin has fallen below the 0.75 supply cost-basis quantile at around $95,000 and has failed to reclaim this level.
  • The 0.75 quantile line shows the cost basis of 75% of Bitcoin’s supply.
  • A drop below highlights that over 25% of the asset’s supply is underwater, as investors procured it at higher prices.
  • The 0.75 cost distribution quantile is a crucial indicator of a bear market and signals a deep correction when Bitcoin falls below it.
  • Interestingly, analysts also associate Bitcoin’s price trend below the key quantile as a potential bottom.

Bitcoin Trends Below Key Level

Glasnode data shows that Bitcoin has fallen below the 0.75 supply cost-basis quantile at around $95,000 and has failed to reclaim that price level. The market intelligence platform highlighted this in a Thursday tweet using the supply quantiles cost basis model.

Bitcoin Supply Quantile Cost Basis Model/Glassnode
Bitcoin Supply Quantile Cost Basis Model | Glassnode

The model showed the prices where different percentages of Bitcoin were acquired, helping identify areas of accumulation and distribution. Notably, the metric has four major trendlines: the Bitcoin price and the 0.95, 0.85, and 0.75 quantiles.

The 0.75 quantile line shows the cost basis of 75% of Bitcoin’s supply. Typically, this is a key sentiment gauge, and a drop below highlights that over 25% of the asset’s supply was bought at a higher price.

Meanwhile, the 0.85 and 0.95 quantiles show the cost basis for a more moderate number of holders. If BTC trades above the 0.95% quantile, it suggests that fewer than 5% of holders are unprofitable, indicating a late-stage bullish market phase.

What Does the Trend Below the 0.75 Quantile Mean? 

The 0.75 cost distribution quantile is a crucial indicator of a bear market. When Bitcoin drops below this level, it indicates the market is in a deep correction.

The longer Bitcoin stays below, the more bearish market sentiment becomes. Furthermore, as more holders panic and sell their stash, the further the chances of steeper price declines.

Glassnode confirmed that this brings more distribution pressure and creates market conditions where bears are on top. However, this changes once Bitcoin reclaims the 0.75 supply cost-basis quantile.

Interestingly, analysts also associate Bitcoin’s price trend below the key quantile as a potential bottom. The market usually forms a bottom below this level, as seen in 2023 when Bitcoin started an uptrend that endured until the October 2025 all-time high of $126,200.

To reclaim the 0.75 cost-basis quantile, Bitcoin would have to rise by 6.2% from the current market standing. Notably, there is no guarantee this will happen, as the market remains weak and is plagued by macroeconomic uncertainties.

Binance Wallet Unveils Three AI Tools to Simplify Web3 Market Research

0

Binance Wallet has introduced three new AI–powered features designed to help users better navigate the fast-moving Web3 market.

The update aims to reduce information overload by transforming large volumes of on-chain and social data into more accessible insights, making crypto research easier to manage.

Key Points

  • The new AI tools—Social Hype, Topic Rush, and AI Assistant—are live on Binance Wallet’s web-based platform.
  • Topic Rush identifies emerging crypto narratives and organizes related tokens into topic-based cards.
  • Social Hype tracks real-time social engagement and sentiment for individual tokens across supported blockchains.
  • AI Assistant provides consolidated token summaries, including narrative context, sentiment scores, and event timelines.

Three AI Tools for Market Insights

The update includes three proprietary AI tools—Social Hype, Topic Rush, and AI Assistant—each of which analyzes and structures market data in real time. Together, they help users identify trends, assess market sentiment, and track token developments more efficiently.

Binance Wallet stated that its features operate across multiple blockchain ecosystems. With support for BNB Smart Chain, Solana, and Base, the wallet offers coverage across several major Web3 networks.

Topic Rush Identifies Emerging Market Narratives

At the core of the update is Topic Rush, a tool designed to surface early-stage crypto narratives. Binance Wallet said the feature analyzes meme trends and discussions from influential social media accounts to detect themes as they begin to gain traction.

Additionally, the tool groups related tokens into topic-based cards within seconds and categorizes each narrative by lifecycle stage using capital inflow data. This allows users to gauge momentum and assess potential market interest more quickly.

Users can access topic summaries, related tokens, and inflow metrics directly within the interface. Moreover, integrated trading tools further streamline the experience by reducing the need to switch between platforms.

Social Hype Tracks Shifts in Market Attention

While Topic Rush focuses on identifying narratives, Social Hype monitors how attention shifts across individual tokens in real time. Binance Wallet said the feature ranks assets based on social engagement and sentiment across supported blockchains.

In addition, the tool highlights sudden spikes in interest and visualizes how attention is distributed through a “mindshare” display. As a result, users can quickly see which assets are gaining momentum and which are falling out of favor.

AI Assistant Brings Token Insights Into One Dashboard

To complement these discovery tools, Binance Wallet has added an AI Assistant widget to its web platform. The company said the assistant generates concise, AI-driven summaries for tokens across supported networks.

Specifically, the dashboard brings together narrative context, sentiment data from platforms such as X, scoring metrics, and key event timelines. By consolidating this information into a single view, the assistant allows users to monitor token developments without relying on multiple tools.

Commenting on the launch, Winson Liu, Global Lead of Binance Wallet, said information overload remains one of the biggest challenges in today’s crypto markets. He noted that the new AI features are designed to help users process data more efficiently and make better-informed decisions.

Liu added that Binance Wallet’s broader goal is to make Web3 exploration accessible to users of all experience levels.

Finally, Binance stated that the rollout is part of its broader effort to integrate artificial intelligence across its ecosystem.

Bitcoin Leverage Ratio on Binance Futures Climbs to Levels Last Seen in November 2025

0

While Bitcoin faces sustained bearish pressure, data confirms that the leverage ratio on Binance futures has increased to November 2025 highs.

Bitcoin (BTC) has struggled to regain momentum since reaching a high of $97,939 on Jan. 14, as geopolitical tensions and market uncertainty continue to dampen investor sentiment. In the days that followed this peak, BTC closed lower in six out of seven sessions, resulting in an 8.6% drop from the January high. 

Despite this, recent derivatives data on Binance suggest that trader behavior is changing, with leverage gradually returning to the market. However, this pattern leaves the market more sensitive to sharp price movements in either direction.

Key Points

  • Bitcoin has recorded six losing days out of seven since Jan. 14, now down 8.6% from its $97,939 peak.
  • Amid the downturn, data confirms leverage is returning to the market, with the estimated leverage ratio climbing to its highest level since November 2025.
  • Elevated leverage shows increased risk-taking and raises the likelihood of sharp price swings driven by liquidations.
  • Historical data confirms that spikes in leverage have coincided with sharp upswings in Bitcoin’s price.

Bitcoin Leverage Ratio on Binance Hits November 2025 Highs

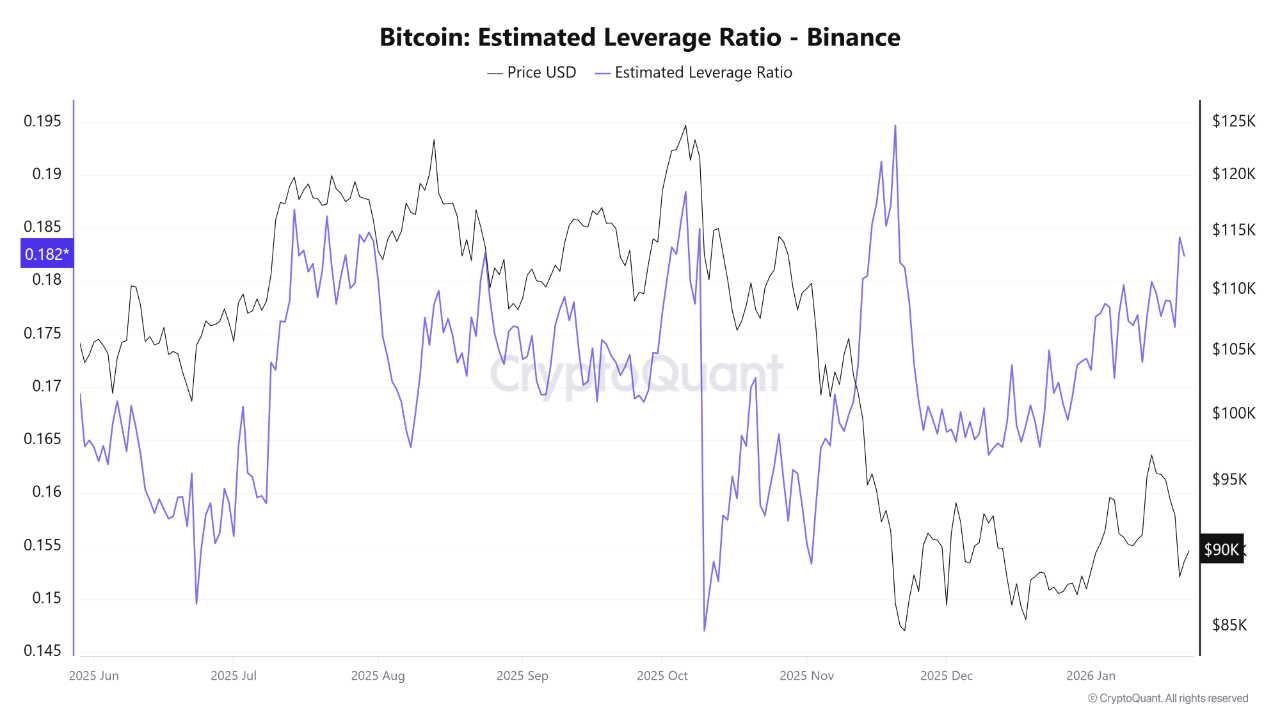
Arab Chain, an analyst at CryptoQuant, confirmed the recent increase in the leverage ratio. According to CryptoQuant data, the estimated leverage ratio climbed to roughly 0.184, marking its highest reading since November 2025. Notably, this confirms a renewed willingness among traders to take on risk after a period of more restrained positioning.

In his analysis, Arab Chain explained that the estimated leverage ratio shows how much borrowed capital traders are using to maintain futures positions. An increase in this ratio indicates that a larger share of positions relies on leverage rather than spot capital. 

He noted that the current rise points to a growing risk appetite, particularly among short-term traders and speculators. Historically, similar leverage levels have often appeared during phases of price expansion, when fresh liquidity flows into derivatives markets and helps push prices higher.

What Could This Mean for Future Price Action?

However, the analyst stressed that higher leverage introduces greater fragility into the market. Specifically, when traders rely heavily on borrowed funds, even mild price swings can lead to forced liquidations. 

As a result, periods of elevated leverage tend to increase the likelihood of sharp and sudden price movements. In this environment, both strong rallies and abrupt pullbacks can become more intense as liquidations accelerate market moves.

However, Arab Chain warned against seeing the rising leverage ratio as a negative signal on its own. Instead, he emphasized that it may be part of a broader transition from caution toward renewed confidence. 

If Bitcoin continues to move sideways without experiencing steep declines, the existing leverage could act as fuel for a renewed upward move. On the other hand, if price momentum fades, the market may face additional rounds of deleveraging before the larger trend resumes.

Historical Context

Historical data further confirms the close relationship between leverage and price action. Chart data shows that spikes in the estimated leverage ratio have frequently occurred alongside rises in Bitcoin’s price, while declines in the indicator have tended to coincide with price drops.

In early June 2025, the leverage ratio hovered around 0.165 as Bitcoin traded between $108,000 and $110,000. When Bitcoin slipped below $100,000 in late June, the ratio fell to about 0.15. 

Bitcoin Estimated Leverage Ratio on Binance CryptoQuant
Bitcoin Estimated Leverage Ratio on Binance | CryptoQuant

The subsequent recovery in July, which saw Bitcoin climb toward $120,000, occurred alongside a rebound in the leverage ratio to above 0.185. Meanwhile, during July’s consolidation phase, with prices holding between $118,000 and $120,000, the indicator remained relatively stable in the 0.17 to 0.18 range.

However, the conditions changed in early October 2025, when the leverage ratio dropped to 0.145. Soon after, Bitcoin’s price fell to around $106,000 by mid-October and then declined further to a low of $80,000 by November 2025.

Since reaching that bottom, both the leverage ratio and Bitcoin’s price have trended upward. Specifically, as the indicator continues its gradual rise, Bitcoin has recovered from the $80,000 low and is now trading at $89,450, though price swings remain pronounced.

BlackRock CEO Says Tokenization Is Inevitable as Binance’s CZ Confirms State-Level Talks

0

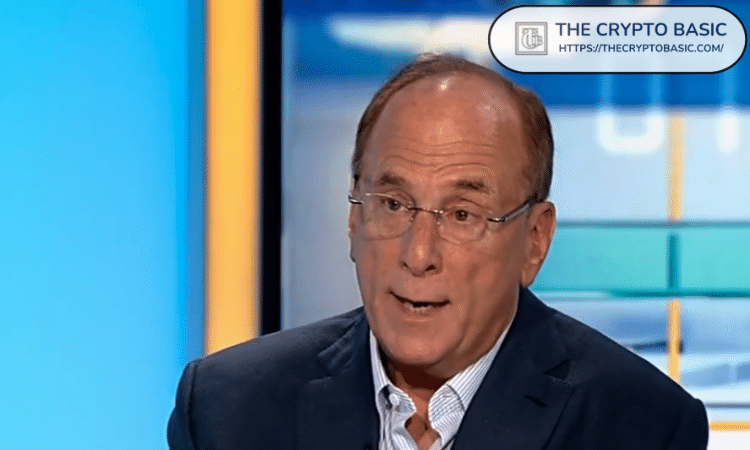
BlackRock CEO Larry Fink argues that tokenization and decimalization represent the next critical step for global financial markets. 

He made the case at the World Economic Forum (WEF) in Davos, reinforcing the view that blockchain-powered tokenization is becoming foundational to global finance, not just crypto markets. 

Key Points 

  • BlackRock CEO Larry says tokenization and decimalization are the next critical steps for global financial markets. 
  • He expects tokenization to reduce transaction fees, democratize investing, and expand market access. 
  • BlackRock’s 2026 Thematic Outlook names tokenization as one of its top investment themes. 
  • Binance founder confirms ongoing discussions with nearly a dozen governments on tokenizing national assets. 

Tokenization as a Necessary Evolution for Global Finance 

Fink describes tokenization as an inevitable transformation of the financial system. Notably, he points to Brazil and India as early leaders in deploying tokenized digital currency frameworks. 

As a result, he urged other nations to accelerate adoption. According to Fink, tokenization could deliver significant economic benefits by cutting transaction costs, expanding market access, and democratizing investing.

Specifically, he argues that a unified digital infrastructure would allow investors to move capital seamlessly between money market funds, equities, and bonds. Beyond efficiency, he highlights transparency as a major advantage, noting that blockchain-based records could help reduce corruption.

What This Means for Crypto

Larry Fink’s comments confirm institutional validation of blockchain technology beyond speculation. By backing tokenized equities, bonds, and money market funds on a shared blockchain, he aligns traditional finance with crypto’s core infrastructure, such as distributed ledgers, programmability, and near-instant settlement. 

Tokenization increasingly bridges TradFi and crypto, reinforcing the long-term relevance of blockchain networks.

Notably, Fink’s remarks followed BlackRock’s 2026 Thematic Outlook, which identified tokenization as a top investment theme for the year. The report also named Ethereum as the dominant blockchain for tokenized assets, accounting for 65.46% of the market. BNB Chain follows with 9.73%, while Solana holds 4.52%.  

Tokenized assets by blockchains
Tokenized assets by blockchains | BlackRock

Binance Founder Engages Governments on Asset Tokenization

Last year, U.S. SEC Chair Paul Atkins also underscored tokenization’s importance by stating that it could reshape the U.S. financial system over the coming years. 

Speaking at the WEF, Binance co-founder Changpeng Zhao (CZ) disclosed that he is in discussions with around a dozen governments on tokenizing national assets.

According to CZ, these talks center on using blockchain to enable fractionalized financing of state-owned assets such as infrastructure, real estate, and commodities. 

Recent Updates This Week for Ripple and XRP

0

Ripple and XRP are witnessing a series of bullish developments this week that are shaping market expectations for 2026. 

These include bold leadership commentary at Davos, expanding stablecoin liquidity, and rising institutional exposure. Accordingly, XRP holders see the asset positioning itself beyond speculative trading.

Key Points

  • Ripple executives at Davos signal confidence in crypto reaching new highs in 2026.

  • Garlinghouse says clearer U.S. regulation is unlocking major institutional demand.

  • RLUSD expands reach with a Binance listing, boosting Ripple’s stablecoin strategy.

  • Spot XRP ETFs surpass $1.2B in inflows, supporting XRP’s strong start to 2026.

Garlinghouse’s Bold Comments

Ripple CEO Brad Garlinghouse drew fresh attention to XRP this week while speaking at the World Economic Forum in Davos. He said crypto markets are likely to reach new all-time highs this year, citing growing institutional interest and clearer U.S. regulation.

He pointed to recent legislation such as the GENIUS Act as a key catalyst, saying it has “unlocked a lot of activity” across the industry.

Garlinghouse also highlighted Ripple’s legal victory after the SEC dropped its four-year lawsuit, calling it a turning point for the sector. He said interest from major financial institutions marks a “massive sea change” that is not yet fully reflected in prices.

Notably, Bitcoin last hit a record above $126,000 in October but now trades around $89,000 at the time of writing. Meanwhile, XRP trades at $1.90 and has been one of the standout performers in the recent rally.

Looking ahead, Garlinghouse said crypto is set for sustained growth over the next decade, with stablecoins and payments among the biggest near-term use cases.

Ripple President Outlines Institutional “Production Era” for Crypto

Ripple President Monica Long added to the bullish tone by outlining four major expectations for 2026. At the center of her outlook is a shift toward what she described as a full institutional production era for crypto.

She expects that in 2026, companies could hold over $1 trillion in digital assets. Moreover, Long expects about half of Fortune 500 firms to adopt blockchain technology this year.

RLUSD Gains Momentum With Binance Listing

Ripple’s RLUSD stablecoin also reached a major milestone this week after securing a listing on Binance. Spot trading officially went live on January 22, initially on Ethereum, with XRPL support coming soon.

Trading pairs include RLUSD/USDT, RLUSD/USDC, and XRP/RLUSD, with Binance rolling out a zero-fee promotion to encourage early liquidity.

The listing significantly expands RLUSD’s reach and strengthens Ripple’s push into regulated, enterprise-grade stablecoin infrastructure.

ETF Inflows and Acquisitions

On the market side, spot XRP ETFs have attracted more than $1.23 billion in inflows since their launch in November 2025. This brings total assets to approximately $1.39 billion. Notably, XRP has recorded only two days of outflows since launch, with most trading sessions posting net inflows.

Meanwhile, Ripple’s recent acquisitions totaling around $2.5 billion point to an aggressive expansion strategy across payments, custody, and financial infrastructure.

Strong Start to 2026 for the Ripple Ecosystem

With Ripple leadership signaling confidence and institutional capital continuing to flow in, Ripple and XRP are entering 2026 with strong momentum. While challenges remain, the broader trajectory suggests the ecosystem is positioning itself for a much larger role in the next phase of crypto market expansion.

Cardano Price Bounces as Buyers Defend Key Demand Zone

0

Cardano is showing strong momentum around a key support area, fueling the prospects of a recovery to higher price levels.

Notably, the 10th-largest cryptocurrency by market cap printed its first green candle in four days, joining a broader market recovery. Moreover, the rebound emerged around a key support level, hinting at a short-term rally.

Key Points

  • Cardano is showing strong momentum around a key support area, fueling the prospects of a recovery to higher price levels.
  • ADA printed its first green candle in four days, joining a broader market recovery push.
  • The rebound was around a key support level, hinting at a short-term rally.
  • Cardano previously traded under a descending trendline that dated back to its October 6, 2025, high of $0.088.
  • Before this breakout, ADA retested a key support zone around the $0.33 region in late December 2025.
  • Cardano retested support around $0.33 on December 20, dropping to a low of $0.34, and holding this area could see Cardano target higher prices.

Cardano Reacts to Demand Zone

Cardano previously traded under a descending trendline that dated back to its October 6, 2025, high of $0.088. This resistance zone had curtailed upward momentum until a breakout occurred on January 6.

Cardano Rebound from Support

Before this breakout, ADA retested a key support zone around the $0.33 region in late December 2025. It was from this support that it gained the strength required to finally break above the multi-month descending trendline.

However, after multiple attempts to surge further, the $0.43 resistance has proven insurmountable in the short term. ADA rose to this supply zone on January 6 and 14, but higher price rejections followed, triggering the earlier correction.

Why This Matters for Cardano

However, the $0.33 region, which provided support during the December 2025 downturn, has again emerged as a key demand zone for Cardano. Notably, bulls have previously defended this area, underscoring its importance to ADA’s market structure and price action. Recall that it was also from this region that the coin consolidated before its November 2024 breakout to reach $1.32.

As a result, holding this area has rekindled optimism that Cardano could target higher prices. While this remains uncertain, market watchers are closely watching its behavior around the support level.

A sustained trend above the $0.33 demand zone paves the way to visit the next resistance level at $0.53. If the recovery momentum persists, the next area of interest for Cardano is the $0.80-$0.85 key supply level.

Crucial Caveat

However, a single-day bounce does not guarantee momentum; Cardano would have to sustain gains beyond a single day to confirm a trend shift. As a result, its subsequent daily closings would determine if the over 4% growth was a relief rally or the start of a bullish reversal.

Moreover, this still does not confirm that it will retest higher resistance levels. Essentially, this is a report on the current state of the market and not financial advice.

XRP ‘Looks Good’ for a $4 Price Run: Details

0

XRP is showing early signs of strength after months of sideways movement, with traders pointing to a familiar price structure that previously led to a major upside breakout.

At the time of writing, XRP is trading at $1.94, up 2.13% over the past day, though it remains down 7.2% over the past week.

  • XRP shows strength as traders spot a familiar setup that has led to a major breakout before.
  • Technical charts suggest XRP is nearing the end of a long consolidation phase.
  • A breakout could send XRP toward $4, requiring just over a 100% price surge.
  • Analysts say extended consolidation supports higher targets, with some calling for $6.

XRP “Looks Good”

Widely followed trader DonWedge shared a 12-hour XRP chart on TradingView, summarizing his outlook with a simple message: “XRP looks good.”

The chart highlights a repeating technical pattern that has appeared twice over the past year. In both cases, XRP formed a descending channel following a strong rally.

Notably, the first instance was XRP’s move from $0.49 to $3.34 between November 2024 and January 2025. The chart illustrates how XRP rallied sharply, delivering 6x gains, before entering a controlled downward channel that saw it dip below $1.80 over a six-month period.

Once selling pressure faded, XRP broke out decisively in July, eventually reaching $3.66.

Current Structure Mirrors Past Setup

The current structure now closely mirrors that earlier setup. Specifically, XRP has once again spent six months moving within a falling channel, with the price now pressing near the lower boundary as volatility compresses. As a result, the market is increasingly eager for a resumption of a new uptrend.

Image

$4 Is a Possible Next Target

DonWedge’s projection outlines a breakout scenario that could send XRP toward the $4 level. This zone aligns with a measured move similar to the previous post-consolidation breakout.

While the chart does not suggest an immediate move, it implies that once XRP exits the channel, the next leg higher could be swift rather than gradual. Notably, from current levels, XRP would need just over a 106% price surge to reach $4, which would mark a new all-time high.

DonWedge’s “looks good” comment reflects rising confidence among technical traders that XRP’s long consolidation phase may be nearing its end. While a move to $4 is not guaranteed, the price action suggests XRP is building strength.

Calls for $6 XRP

In a separate analysis this week, Elliott Wave analyst XForceGlobal stated that XRP is in an accumulation phase rather than a bearish zone and could reach a $6 price target.

He noted that XRP has been consolidating for over a year within its current pattern and for more than eight years in a broader cycle. Such extended consolidation phases often precede strong breakouts.

According to XForceGlobal, XRP’s long-term triangle breakout remains valid, and recent pullbacks are simply normal market noise. Despite short-term volatility, he considers $6 a conservative target, adding that long, quiet periods that frustrate some holders are a natural part of the process.

Four Chart Overlays Show XRP Historically Rallies from the Current Levels

0

Four chart overlays originating from XRP price movements in past cycles indicate that the price often rallies from levels such as the current one.

While XRP has been at the mercy of the bears, market data suggests a recovery effort may not be far off. For context, after a disastrous Q4 2025, XRP embarked on a rebound push that pushed prices to $2.41 by Jan. 6, 2026. However, the resistance at this point has since led to a pullback, with XRP struggling to hold above the $1.9 support.

Despite the downward trend, historical data from previous cycles indicate that whenever XRP surges, pulls back, and consolidates around levels like the current position, what typically follows is another upward push. The current cycle appears to be following the exact same trend, which has played out four times since 2015.

Key Points

  • XRP has struggled since collapsing from the $2.41 high on Jan. 6, down 19% since this yearly peak.
  • The recent struggles, which began in late 2025, come after a consolidation period that defined most of 2025 following the initial rally recorded earlier that year.
  • Historical data from four different chart overlays suggest that XRP witnessed similar patterns in past cycles, eventually rallying from levels that resemble the current position.
  • While historical data points to a possible reversal in the works, past success does not always guarantee future results.

XRP Declines After Initial Upsurge

Austin, a well-regarded chartist, discussed this pattern in one of his recent analyses. The market watcher stressed that XRP may be near the end of the current consolidation phase, suggesting that volatility could return to the market when the bulls finally arrive.

For context, the ongoing phase follows an initial rally recorded by XRP a year ago. Specifically, XRP witnessed an impressive rally from $0.5 in November 2024 to $3.4 by January 2025, representing a 580% increase in three months. After the $3.4 peak, the price corrected and has since continued to consolidate.

Within this consolidation, XRP has seen occasional upswings above $3 and declines below $2, but it has largely maintained a position around the $2 price, currently trading for $1.95. Austin believes the consolidation, which has lasted for a year now, could be close to an end.

Four Chart Overlays Provide Historical Data

To prove his point, he called attention to historical data. According to him, XRP currently trades within a structure that looks similar to XRP’s price action in previous cycles. Specifically, the structure involves an initial upsurge, a pullback from this upsurge, a consolidation, and then a recovery push.

He identified four different occasions in which this structure played out. In the first chart, he identified how XRP first surged from $0.004 to $0.009 in December 2015, and then pulled back to $0.005. After a slight recovery, XRP consolidated around $0.006 from February 2016 to March 2017. From here, an explosive run ensued, pushing prices to $3.31 by January 2018.

XRP Price Action from December 2015 to March 2017

For the second chart, XRP surged from $0.4 to $0.94 in July 2023 and immediately pulled back to around $0.6. From here, it consolidated between $0.5 and $0.6 from August 2023 to November 2024, when a rally pushed prices to $3.4 by January 2025.

XRP Price Action from July 2023 to November 2024

In the third chart, XRP hit $0.92 in March 2022 and pulled back to $0.4 in May of that year. After consolidating at this level from May 2022 to June 2023, it saw the rally to $0.94 by July 2023. Meanwhile, the fourth chart shows XRP dropping from $0.5 in June 2019 to $0.2 in September 2019. After this, it consolidated until April 2023, when a rally took prices to $1.96.

XRP Price Action from June 2019 to April 2021

Consolidation Near an End?

Austin believes XRP now sits at the same position as it did in all four occasions before the final rally. This would put XRP in the same area it traded at in March 2017, April 2021, July 2023, and November 2024. If this proves true, the recovery push may not be far behind.