Home Blog Page 310

Why the Next Major XRP Breakout May Come When No One Expects It

0

The next major XRP breakout is unlikely to arrive with warning, according to market watchers.

Indeed, XRP price continues to struggle around $2, frustrating holders. However, community analysts believe a breakout will come suddenly, catching most traders off guard, just as previous XRP moves have.

The sentiment around XRP suggests that patience, not prediction, may be the deciding factor.

Key Points

  • Analysts say XRP’s biggest breakouts come suddenly, not after long buildups

  • XRP frustrates traders, then historically explodes when confidence is lowest

  • Exposure matters more than timing, as late buyers often chase after the move

  • With the SEC case resolved, this may be XRP’s first free cycle since 2017

“XRP Breakouts Are Never Announced”

In a tweet, technical analyst ChartNerd argued that XRP’s biggest moves could arrive quietly. Historically, XRP does not grind upward for weeks before exploding. Instead, it stays calm, frustrates traders, and then moves aggressively when confidence is at its lowest.

This pattern, often described as a “catch-off-guard” breakout, is why many short-term traders miss the move entirely. By the time momentum becomes obvious, price is already far above key levels.

Exposure Matters More Than Timing

XRP commentator Moon Lambo echoed this idea, stressing that nobody truly knows when XRP will break out. What matters is whether investors already have exposure when it happens.

According to this view, XRP breakouts reward those who position, not those who chase. Once price accelerates, late buyers tend to enter emotionally, often near local tops, while early holders are already in profit.

This behavior has repeated across multiple XRP cycles.

Many Investors Lost Faith After Past Rallies

Community responses show how past price action shaped current sentiment. Some investors who bought XRP above $3 last year have sold after years of stagnation, leading to frustration and disbelief in another breakout.

Others argue that XRP has only seen one meaningful breakout since 2018, and even that move struggled to sustain momentum beyond its all-time high. This has caused skepticism, even among long-term supporters.

The SEC Lawsuit Changed XRP’s Entire Cycle

Moon Lambo pushed back on this pessimism by pointing to a critical factor: the SEC lawsuit.

XRP effectively missed an entire market cycle due to regulatory pressure. While other assets experienced explosive rallies, XRP remained constrained. From this perspective, the current cycle represents the first real opportunity for XRP to move freely since 2017.

With the lawsuit now resolved, supporters argue that XRP is once again operating on equal footing.

XRP Price Context: A Powerful Move, Then a Deep Reset

XRP is trading around $1.96, down roughly 5% on the day and nearly 60% below its recent peak.

Its last major breakout began in November 2024, shortly after the U.S. elections. Market optimism surged following Donald Trump’s victory and the subsequent resignation of SEC Chair Gary Gensler.

XRP moved from $0.50 to $1 in November, crossed $2 in December, and reached $3 by January 2025—levels not seen since 2018. The rally peaked at $3.66 in July, where XRP faced strong resistance and entered a prolonged correction.

Waiting for the Move That Nobody Expects

Today, XRP sits in a familiar place. For believers, this is exactly when XRP tends to surprise the market. For skeptics, the memory of long consolidation periods still lingers.

Given XRP’s history, its next major move is unlikely to arrive when the crowd feels most comfortable. And when it does, positioning will matter far more than perfect timing.

Bitcoin RSI Against Gold Hits 30 for Fourth Time in History: What Happens Next?

0

The Bitcoin RSI against gold has dropped to 30 for only the fourth time in Bitcoin’s history, indicating BTC is highly undervalued relative to gold.

The latest development comes as Bitcoin (BTC) continues to underperform against gold (XAU) for over six months. Specifically, after soaring to reach 37 ounces (oz) of gold in August 2025, it has been downhill for BTC, witnessing five consecutive months of declines against gold since then, and on course for a sixth monthly loss.

Amid this decline, BTC has now collapsed to 20 ounces of gold, trapped within a falling channel pattern on the monthly chart. However, market data now confirms that the BTC/XAU pair has now hit an RSI low of 30 for the fourth time in history, confirming that BTC is now undervalued against gold.

Key Points

  • Since the rally to 37 ounces of gold in August 2025, Bitcoin has continued to drop against gold.
  • This drop has translated to five consecutive monthly losses, as BTC struggles while gold consistently records new all-time highs.
  • With BTC collapsing to 20 ounces of gold amid this decline, the 1W RSI on the BTC/XAU pair has dropped to 30.
  • This is only the fourth time in history this indicator has hit 30, with each of the three previous times leading to a Bitcoin rebound.

Bitcoin Struggles Against Gold

Michaël van de Poppe, a veteran analyst, spotlighted this recent development while analyzing Bitcoin’s current price action amid the ongoing downtrend. For context, after recovering to retest $98,000 by Jan. 14, BTC has seen persistent declines, with the latest drop to $92,000 leading to $785 million in long liquidations.

This downward push, triggered by macroeconomic uncertainties surrounding Trump’s latest tariff announcements, has exacerbated Bitcoin’s downtrend against gold, which began in August 2025, after BTC claimed the peak of 37 ounces of gold.

Bitcoin has now collapsed nearly 46% to 20 ounces of gold, recording five consecutive monthly candle losses since then. With this decline, BTC has now entered a falling channel structure on the 1-month chart against gold, but the latest development may renew hopes of a rebound.

Bitcoin RSI Against Gold Hits 30

Specifically, the Bitcoin 1W RSI against gold has now hit an extreme low of 30, according to chart data provided by van de Poppe. The analyst confirmed that this represents only the fourth time in history that the RSI would drop to this level.

For context, BTC has historically found long-term bottoms versus the yellow metal in this area. Each prior occurrence preceded a strong period of outperformance, meaning sellers were largely exhausted, and value investors began positioning for the next cycle. 

Moreover, the developing falling channel on the 1-month BTC/XAU chart bolsters that narrative. Notably, falling channels typically form during corrective phases and resolve with a bullish breakout as momentum flips back to the upside. 

Bitcoin Falling Channel Against Gold

Historical Context

Data from van de Poppe’s chart also confirms that all the previous times this happened were during Bitcoin bear markets. Specifically, the last time the RSI hit such a low was in November 2022 on the back of the FTX collapse. Shortly after this, Bitcoin recovered from 9 ounces of gold to a high of 34 by March 2024.

Bitcoin RSI Against Gold Drops to 30 Michael van de Poppe
Bitcoin RSI Against Gold Drops to 30 | Michael van de Poppe

Before then, the weekly RSI had dropped to 29.15 in December 2018 during the bear market at the time, as BTC traded for 3 ounces of gold. What followed was a recovery to 10 ounces by June 2019. Meanwhile, the earliest occurrence played out in January 2015, as the RSI hit 27.65. Another uptrend emerged shortly after.

Bitcoin and Litecoin Investor Targeted in $282 Million Social Engineering Fraud

0

A cryptocurrency investor has lost more than $282 million in Bitcoin and Litecoin after attackers manipulated the victim into approving fraudulent transactions.

Notably, the incident, which occurred on January 10, 2026, at approximately 11:00 PM UTC, ranks among the largest personal crypto thefts ever documented. It underscores how social engineering continues to bypass even sophisticated self-custody protections, including hardware wallets.

Key Points

  • Over $282 million stolen in Bitcoin and Litecoin from one investor.
  • Attack method: Social engineering with user-approved transactions
  • 928.7 BTC swapped via THORChain into ETH, XRP, and LTC
  • Monero price rose approximately 70% within four days after conversions
  • Three wallets identified receiving 1,459 BTC and 2.05 million LTC

How the Scam Unfolded

Blockchain investigator ZackXBT reported that the victim held funds in a hardware wallet at the time of the attack. However, the wallet’s security features did not prevent the loss. The attackers relied on psychological manipulation rather than technical exploits.

Through deception, the victim was persuaded to approve transactions that appeared legitimate. Once confirmed, the transfers allowed the attackers to drain the wallet directly. Importantly, no software vulnerability or hardware flaw was identified during the investigation.

Movement and Conversion of Stolen Funds

Immediately after gaining control of the assets, the attackers moved quickly to obscure their trail. Specifically, significant amounts of Bitcoin and Litecoin were exchanged for Monero through instant swap services, a common tactic because of Monero’s strong privacy features.

This activity had immediate market effects. Since Monero has lower liquidity than Bitcoin, the sudden inflow drove its price up by roughly 70% over the following four days, according to ZackXBT.

Use of THORChain for Cross-Chain Transfers

In parallel, the attackers leveraged THORChain, a decentralized cross-chain protocol, to move Bitcoin across multiple networks. ZackXBT traced transactions that bridged Bitcoin into the Ethereum, Ripple, and Litecoin ecosystems.

Because THORChain operates without identity verification, investigators say it is increasingly attractive for laundering illicit funds. Consequently, this cross-chain activity significantly complicated efforts to trace the stolen assets.

ZackXBT identified several major swaps, including the conversion of 928.7 BTC, worth about $78 million, into 19,631 ETH, 3.15 million XRP, and 77,285 LTC.

Wallets Connected to the Theft

ZackXBT linked the stolen assets to three main wallet addresses: two Bitcoin wallets and one Litecoin wallet. Collectively, these addresses received 1,459 BTC and 2.05 million LTC.

As of this writing, a substantial portion of the Bitcoin remains in a wallet believed to be under the attackers’ control. The lack of recent movement suggests a calculated pause, leading investigators to speculate that the perpetrators may be waiting for public scrutiny to diminish before resuming activity.

Comparison With Earlier Crypto Thefts

The incident surpasses a high-profile social engineering theft from August 2024 involving a Genesis creditor, in which $243 million was stolen.

In that case, attackers impersonated support personnel, gained remote access, and ultimately extracted private keys. ZackXBT’s investigation contributed to arrests, asset freezes, and multiple criminal charges.

While both cases relied on manipulation rather than exploits, the latest theft reflects a more sophisticated laundering strategy. Specifically, the extensive use of cross-chain swaps and privacy-focused assets marks a notable escalation in these practices.

Broader Implications

The case highlights a persistent vulnerability in cryptocurrency security: human trust. Indeed, even the strongest self-custody tools can be undermined when users are deceived into approving malicious transactions.

As ZackXBT’s findings demonstrate, once stolen assets are routed through Monero and cross-chain protocols, recovery becomes exceedingly difficult. Overall, the incident illustrates how crypto crime continues to evolve, adapting to increased user awareness and stronger technical defenses.

Over 30% of Ethereum Total Supply (36.3M ETH) Now Staked

0

The amount of staked Ethereum continues to climb despite the dip, reestablishing investor confidence beyond short-term volatility.

Notably, over 30% of the Ethereum total supply has now been staked, drastically depleting its supply in actual circulation. Reductions of this nature could precede a supply shock—a scenario in which available tokens can no longer meet the growing demand for an asset.

Key Points

  • Over 30% of Ethereum’s total supply has now been staked, drastically depleting its circulating supply.
  • The number of Ether staked now stands at 36.3 million ETH, a little over 30% of the cryptocurrency’s circulating and total supply of 120.69 million.
  • The total value staked increased from 35.99 million ETH ($108 million) to 36.31 million ETH ($117 million), representing a 0.89% growth YTD.
  • This matters for the Ethereum network because it signals a reduced circulating supply, greater security, and increased long-term investor confidence in the long term.

Ethereum Supply Depletes

Notably, CryptoQuant data shows that the amount of Ether staked now stands at 36.3 million ETH, a little over 30% of the cryptocurrency’s circulating and total supply of 120.69 million. This number has continued to climb even during periods of market turbulence, as users focus on the longer term, beyond the current uncertainty.

Remarkably, a considerable amount of staking activities has occurred this year. As of January 1, the total value staked was 35.99 million ETH, worth approximately $108 million. These numbers have grown to 36.31 million ETH worth $117 million, representing a 0.89% growth.

Ethereum Staked Supply/CryptoQuant

This increase becomes more evident on a longer timeframe. A year ago, around 34.19 million Ethereum was staked, and the current figure shows 6.2% year-over-year growth.

Why This Matters for Ethereum

Interestingly, this matters for the Ethereum network in several ways. First, it reduces the amount of the token’s supply available in the open market, removing immediate sell pressure.

Again, it boosts network security, as more staking activity increases the cost of attacking the Ethereum network. Additionally, it suggests long-term confidence among holders, as staking means they believe in the asset’s price trajectory in the future.

However, it comes with lower yields. As the total amount of Ether staked increases, the annual percentage yield (APY) automatically reduces to provide balance to the ecosystem.

Per the Ethereum Validator Queue, more are still in the pipeline. Over 2.6 million ETH are in the entry queue, pushing the wait time to 45 days and 12 hours. However, only 64 ETH are in the exit queue, as validators seem uninterested in unstaking their stash.

Ethereum Validator Queue

Ethereum Network Hits Record Transaction High

Meanwhile, the surge in staking activities is accompanied by several other bullish developments on the Ethereum network. The daily Ethereum transaction spiked to 2.88 million on January 16, marking a new all-time high for the network. Notably, this highlights an uptick in on-chain activities and renewed user traction on Ethereum.

Notably, a decline in Ethereum mainnet network fees accompanied this. Average fees dropped sharply to 0.054 gwei ($0.01), making transacting far cheaper than usual. This combination of high transactions and low fees marks a turnaround from past occurrences in previous cycles, thanks to recent upgrades.

At the time of writing, the Ethereum price remains weak amid unfavorable macroeconomic factors, failing to respond to these network activities. There is also no guarantee that that would happen, as volatility and uncertainty currently cloud the crypto market.

Bitcoin and Crypto Funds Record Biggest Weekly Inflows Since October 2025

0

Investments in products tied to Bitcoin, XRP, and other crypto assets recorded new historic inflow figures.

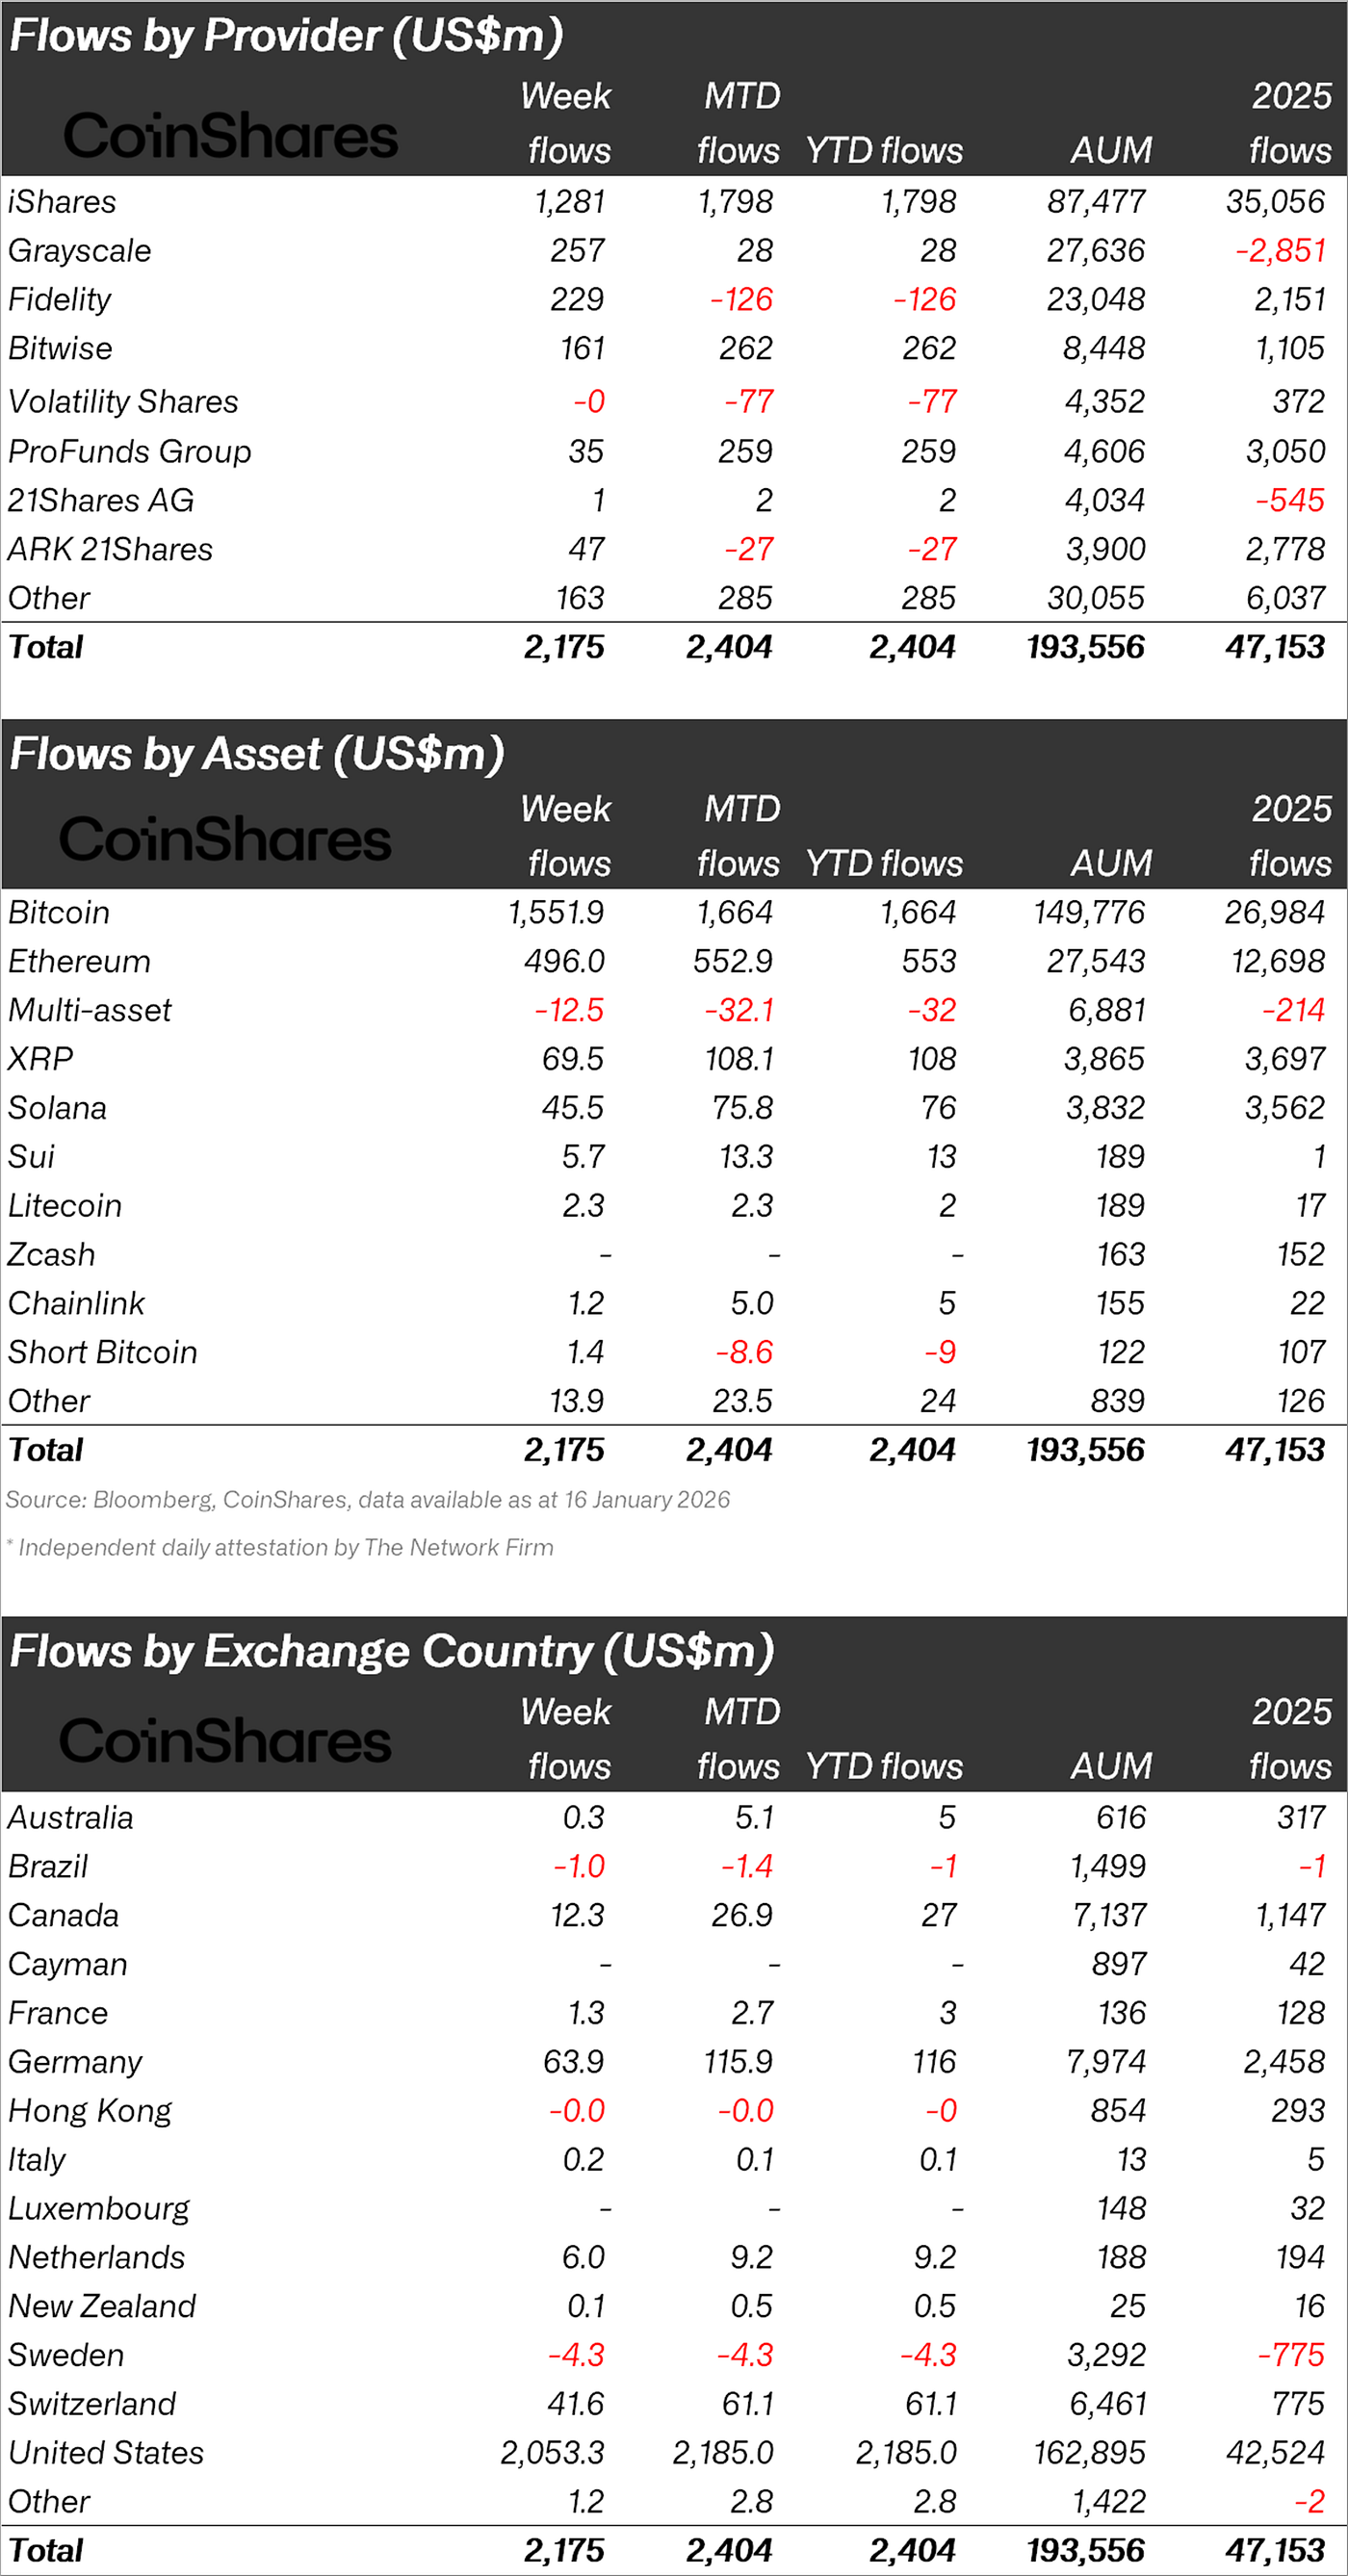
Specifically, crypto asset investment products attracted $2.17 billion in inflows last week, marking the strongest weekly performance since October 2025. The surge highlights revived institutional demand for crypto exposure, even as macroeconomic and geopolitical risks resurfaced toward the end of the week.

Bitcoin led the charge, but strength was also visible across Ethereum, XRP, Solana, and a broad range of altcoins, according to CoinShares’ latest report.

Key Points

  • Crypto investment products saw $2.17 billion in inflows, the strongest week since Oct 2025.
  • Bitcoin led with $1.55 billion, while Ethereum, XRP, and Solana also posted gains.
  • XRP topped the altcoin list with $69.5 million.
  • U.S. inflows hit $2.05 billion as institutions rebuilt exposure despite macro risks.

Early-Week Momentum

Inflows were heavily front-loaded, with strong demand earlier in the week. However, sentiment weakened on Friday after $378 million in outflows. This was triggered by geopolitical tensions, including a diplomatic escalation over Greenland and fresh tariff threats.

As of today, those tariff threats have materialized, with President Trump imposing a 10% tariff on eight European countries.

Investor caution also increased due to U.S. policy uncertainty, particularly speculation that Kevin Hassett—viewed as more dovish—may remain in his current role instead of becoming the next Federal Reserve Chair.

Bitcoin Dominates

Bitcoin remained the primary beneficiary of early-week inflows, attracting $1.55 billion. This reinforces its role as the dominant institutional asset during periods of heightened uncertainty.

Despite ongoing U.S. regulatory debates around the CLARITY Act, Ethereum still attracted $496 million in inflows, while Solana added $45.5 million.

This strength across major smart contract platforms suggests investors are positioning beyond Bitcoin, even amid policy headwinds.

XRP and Altcoins See Broad-Based Inflows

Altcoin interest remained healthy, with several assets attracting notable capital. XRP led with $69.5 million in inflows. Other assets included:

  • Sui: $5.7 million
  • Lido: $3.7 million
  • Hedera: $2.6 million

This all-around participation points to improving risk appetite rather than a narrow Bitcoin-only trade.

U.S. Leads Regional Inflows as Global Interest Expands

Regionally, the United States dominated with $2.05 billion in inflows. Other regions also posted gains, including:

  • Germany: $63.9 million
  • Switzerland: $41.6 million
  • Canada: $12.3 million
  • Netherlands: $6.0 million

Blockchain Equities Reinforce Bullish Signal

Blockchain equities also recorded $72.6 million in inflows, capping a strong week for the digital asset space.

The combined performance of crypto investment products and blockchain stocks suggests institutional investors are steadily rebuilding exposure, even as short-term uncertainty continues to shape market sentiment.

Chart from CoinShares report

Cardano Founder Criticizes Ripple CEO on Clarity Act Support

0

Cardano founder Charles Hoskinson has taken a jab at Ripple CEO Brad Garlinghouse following his recent support for the Digital Asset Market Clarity Act. 

Hoskinson’s public disagreement with Garlinghouse has drawn backlash from some XRP supporters, who accuse him of attacking Ripple despite the company’s commitment to regulatory clarity.

Key Points 

  • Hoskinson rejects Garlinghouse’s position, warning that accepting flawed legislation hands power back to hostile regulators. 
  • His public criticism of Ripple’s CEO has triggered backlash among segments of the XRP community. 
  • Jungle Inc and other XRP figures pushed back, questioning Hoskinson’s role during Ripple’s legal battle with the SEC. 
  • Some community members sided with Hoskinson, arguing that once the Clarity Act passes, it will be nearly impossible to amend. 

Cardano Founder Challenges Ripple CEO’s Stance on the Clarity Act 

Despite widespread criticism of the Clarity Act, particularly over DeFi restrictions and the potential ban on stablecoin yields, Garlinghouse has continued to back the bill. He argues that, although imperfect, the legislation offers more certainty than the regulatory chaos of the previous SEC administration. 

However, Hoskinson rejected this position, contending that accepting flawed legislation for “some clarity” effectively returns control to the same regulators who previously sued and constrained crypto firms. 

Moreover, he warned that once such laws pass, they become tough to amend, citing the enduring Securities Exchange Act of 1933. 

Jungle Inc Shade Cardano Founder 

In a statement, Jungle Inc questioned Hoskinson’s role during Ripple’s fight for survival and its extensive lobbying efforts. For context, Ripple experienced regulatory uncertainty firsthand when the U.S. SEC sued the company in December 2020 over alleged violations of securities laws tied to XRP sales. 

Garlinghouse later disclosed that Ripple spent up to $150 million defending the case. Following the lawsuit, he actively engaged lawmakers in Washington, D.C., in pursuit of clearer crypto regulation, with Hoskinson praising him as a leading industry advocate for the Clarity Act. 

In Jungle’s view, given Ripple’s costly experience with unclear regulation, securing regulatory clarity, even if imperfect, offers a practical path forward. 

Mixed Reactions Trail Hoskinson’s Commentary 

Meanwhile, other community members also criticized Hoskinson over his public remarks against Garlinghouse. Community analyst Cryptoinsightuk recalled that Hoskinson once labeled XRP holders as conspiracy theorists and supported the SEC during the height of the Ripple lawsuit. Although he shares Hoskinson’s broader goal of financial freedom, he still condemned the Cardano founder’s public attack on Garlinghouse.

In response, XRPL dUNL validator Vet suggested that Hoskinson should focus on helping shape the Clarity Act rather than publicly clashing with Garlinghouse. 

However, some users fully backed Hoskinson, arguing that Garlinghouse erred by supporting a version of the Clarity Act that removes yield from stablecoins. Others agreed with Hoskinson’s view that once the Clarity Act passes, changing the law would be nearly impossible. 

Relations Between XRP and Cardano Communities Hang in the Balance

Meanwhile, it remains unclear how the latest controversy will affect relations between Cardano and XRP holders. Both communities have only recently begun mending ties after a heated online feud during the peak of the Ripple lawsuit.

Although Hoskinson previously labeled XRP holders as conspiracy theorists, he later apologized, invited them to participate in the Midnight airdrop, and announced plans for a yield-bearing opportunity for XRP holders. He also disclosed intentions to support Ripple’s RLUSD stablecoin on Cardano. However, in light of the renewed dispute, the future relationship between both ecosystems remains uncertain.

Shiba Inu Forecast for Jan 19: Can SHIB Lift Back Above 0.618 Fibonacci Level?

0

Shiba Inu tests key support after a sharp drop, with traders watching whether SHIB can reclaim the 0.618 Fibonacci level to stabilize price.

Shiba Inu’s (SHIB) price has experienced a significant drop of 5.9% in the last 24 hours, falling from $0.00000845 to the current $0.000007874, which highlights a sudden market downturn. This sharp decline coincides with rising market volatility, as reflected by the sudden surge in trading volume, up over 108%, and the negative price action.

Further, SHIB has faced significant volatility over the past week, with its price dropping by 6.5% within this period. Over the 14 days, the loss is slightly less severe at 9.5%, which shows that the selling pressure has been persistent, with the coin failing to find solid support at key levels.

Looking at a 30-day window, Shiba Inu is still up by 5.4%, indicating that its longer-term performance remains positive despite recent losses. Can this dip be part of a consolidation phase rather than a long-term reversal?

Shiba Inu Prediction

On the technical analysis side, SHIB has now tested the 0.786 Fib retracement $0.0000075162. So far, price is still holding above that band, but the bounce has not been confirmed yet because it has not reclaimed the 0.618 level at $0.0000080620. In practical terms, the 0.786 test shows buyers are still defending the retracement zone, but the structure remains weak until the market proves it can lift back above 0.618.

Shiba Inu 1-Day Chart

For the setup to shift back to bullish, SHIB needs a daily close above 0.618. That would signal that demand is strong enough to break out of the deeper retracement area and re-enter the higher Fib range. 

If that close happens, the next upside checkpoints typically become 0.5 at $0.0000084455 and 0.382 at $0.0000088289. However, if SHIB fails to reclaim 0.618 and rolls over again, repeated pressure on 0.786 increases the risk of a breakdown back toward the prior swing low area.

In addition to the Fibonacci structure, volatility measured by the 20-day standard deviation provides more context on SHIB’s current setup. The STDEV has fallen to 0.000000558 after rising during the early-January rebound. A daily close above the 0.618 Fib would likely be accompanied by a renewed rise in STDEV, confirming fresh momentum to the upside.

Shiba Inu Futures Flow 

Elsewhere, the Shiba Inu Futures Flow data reveals a volatile market with mixed sentiments across different time frames. Over the 1-hour and 4-hour periods, the market is experiencing significant outflows, indicating bearish sentiment, especially in the immediate short term. 

Shiba Inu Futures Flows

The 1-hour shows a 495.08% drop in net inflow, while the 4-hour data, despite a small net inflow of $36.7K, reflects only a modest recovery with a 86% drop. 

However, the 8-hour data stands out with a sharp 23935.55% increase in net inflow. The 12-hour and 24-hour periods show continued outflows of $1.71M and $1.96M, signaling persistent bearishness over the medium to long term. Ultimately, the 3-day figures show a smaller net outflow of $3.2M.

Solana Prediction for Jan 19: SOL Faces Stiff Resistance but Analyst Eyes Rebound to $145

0

Solana faces resistance at key levels, but a potential rebound from support could trigger a rally toward previous highs.

The Solana (SOL) price has experienced a sharp decline of 6.0% over the past 24 hours, falling from about $142.92 to $133.62. The sudden drop came despite strong trading volumes, with over $5.47 billion exchanged in the last 24 hours, reflecting heightened market activity. This downward movement could be attributable to broader risk aversion, as traders re-evaluate their positions amid global economic and geopolitical tensions.

While the 24-hour performance shows a significant downturn, Solana’s longer-term performance remains relatively stronger. Over the past 30 days, the price has risen by 5.9%. 

If the $133 level holds as support, Solana could see a bounce; if not, further declines may test the next support zone. What’s next for SOL?

Where’s Solana Headed?

On the technical standpoint, the Parabolic SAR indicator currently shows dots positioned just above the price action at $148.10. This suggests that the price may be losing momentum, and the trend could shift from bullish to bearish if the dots continue to align above the price. 

Solana Price Analysis

The recent 2.9% drop in Solana’s price, combined with Parabolic SAR’s position, reinforces the possibility of further downside if the support level at $126 fails to hold. If the price breaks below key levels, the SAR dots could continue to guide the market into a downward trend, suggesting a stronger bearish momentum ahead.

Additionally, the Awesome Oscillator, currently at 9.24, showed positive momentum last week, but is gradually declining. This reduction in momentum suggests that buying pressure is weakening, and the market may not have the strength to push higher.

As the AO moves closer to the zero line, it signals a potential shift in market sentiment. A negative reading or a further decline in the AO could further support the bearish outlook.

Can Solana Retest $145?

Elsewhere, crypto analyst BitGuru noted that Solana has recently swept liquidity into a strong demand zone, placed just above $133, following a clean market structure breakdown. According to the analyst, SOL is now attempting to rebound from this support area, which has previously acted as a base for upside continuation.

Image

If buyers manage to defend this level, BitGuru suggests the setup could trigger a sharp relief rally, potentially pushing price back toward prior highs. Per the analyst’s chart, if the rebound holds, Solana could retest the $145 area in the coming days.

Cardano Ambassador: ADA Listing on CME Marks Its Strongest Institutional Validation

0

Cardano (ADA) joins CME Group’s expanding list of supported crypto futures, reinforcing its presence in the world’s leading cryptocurrency derivatives marketplace. 

In a press release, CME announced plans to launch regulated futures for Cardano, alongside Chainlink and Stellar Lumens. The announcement has sparked positive reactions among ADA holders. Some proponents view it as the strongest institutional validation in Cardano’s history.

Key Points

  • Cardano futures will commence trading on the CME platform next month, subject to regulatory approval.
  • The offering will include both large-sized contracts representing 100,000 ADA and micro contracts of 10,000 ADA.
  • CME’s popularity among financial institutions makes the listing a strong institutional validation of Cardano.
  • It reported impressive trading activity last year, with an average daily volume of 278,300 contracts, totaling $12 billion in notional value.

Major Institutional Milestone for Cardano

CME plans to launch Cardano futures on February 9, 2025, pending regulatory approval. Once approved, traders will be able to access both standard and micro-sized Cardano futures contracts.

The large-sized contract will feature 100,000 ADA, while the micro futures contract will carry 10,000 ADA. This provides flexibility for retail and institutional participants alike.

Reacting to the announcement, Cardano ambassador Lucas Macchiavelli stressed that CME’s support is far from a routine exchange listing. He noted that the futures launch could become the strongest institutional validation ADA has ever received.

Significance of CME Listing for ADA

Macchiavelli explained that CME is the world’s largest derivatives exchange, widely used by hedge funds, asset managers, banks, and other major financial institutions. Since its products primarily target institutional participants seeking regulated exposure, CME sets a high standard for the assets it supports.

As a result, the decision to list Cardano signals that ADA now meets institutional benchmarks. This further cements its credibility in traditional finance.

Legitimizing Crypto

CME has historically played a key role in legitimizing emerging asset classes. Its earlier Bitcoin and Ethereum futures launch was widely viewed as a milestone that opened crypto markets to institutional participation.

The derivatives marketplace also added XRP and Solana to its list of derivative products last year. With ADA slated to commence trading on February 9, it will join this small group of digital assets recognized at the highest level of regulated derivatives markets.

Meanwhile, the Cardano ambassador also portrayed the listing as a broader endorsement of crypto’s integration into traditional finance. He stressed that CME futures can improve price discovery, attract deeper pools of capital, and enhance the participation of traditional finance.

CME’s Outstanding 2025 Trading Activity

CME continues to maintain its dominance in the derivatives sector, as reflected in its strong trading activity last year. The exchange reported an average daily volume (ADV) of 278,300 futures and options contracts, with a notional value of $12 billion. It also recorded an average open interest (OI) of 313,900 contracts ($26.4 billion notional).

Futures alone reached an ADV of 272,200 contracts ($11.7 billion) with OI of 253,600 contracts ($21.4 billion). On the other hand, options averaged 4,100 contracts ($231 million) in daily volume and 60,400 contracts ($5 billion) in open interest.

361,380,965,000 Shiba Inu Leaves Exchanges in 72 Hours— What’s Happening?

0

The supply of Shiba Inu on exchanges is drying up despite current price uncertainties, suggesting potential reduced immediate selling pressure.

Data shows that the amount of SHIB tokens on all centralized exchanges has seen a remarkable decline in the past 72 hours. The reason for this supply reduction remains unclear, but it fuels optimistic sentiment among Shiba Inu holders, suggesting accumulation over distribution.

Key Points

  • The supply of Shiba Inu on exchanges is drying up despite current price uncertainties, suggesting reduced selling pressure.
  • Data shows that 361,380,965,000 SHIB tokens exited exchanges between January 16 and today, a significant drop worth noting.
  • The reserves on all exchanges were 82.642 trillion SHIB on Friday, but dropped to 82.28 trillion SHIB, a difference of 361 billion tokens.
  • Outflows from exchanges typically suggest that whales are repositioning their holdings to self-custody wallets or other third-party systems.
  • This accumulation trend reassures holders, especially considering that the token has corrected by 6.23% in the past 24 hours and 6.76% in the last seven days.

 Shiba Inu Exodus from Exchanges

CryptoQuant data shows that 361,380,965,000 SHIB tokens exited exchanges between January 16 and today, a significant drop worth noting. On Friday, the reserves on all exchanges stood at 82.642 trillion, with the meme coin’s price around $0.00000856.

However, at the time of writing on Monday, this figure has dropped considerably to 82.28 trillion SHIB, marking a difference of 361 billion tokens. Interestingly, this comes despite a price drop over the weekend, which saw Shiba Inu retrace to $0.00000787.

Shiba Inu Exchange Supply/CryptoQuant

Meanwhile, Binance recorded a considerable decline in its SHIB reserve during this period, dropping from 62.53 trillion to 62.42 trillion. Notably, such inflows boost sentiment, especially as prices struggle.

What Does It Mean for Shiba Inu?

Specifically, outflows from exchanges typically suggest that investors are repositioning their holdings to self-custody wallets or other third-party systems. Usually, this means accumulation, as it suggests market users are moving to facilities that encourage long-term holding.

Additionally, it reduces immediate selling pressure. As fewer Shiba Inu tokens are available on exchanges, the amount of supply left for immediate sales reduces. Also, it shows commitment among Shiba Inu investors, as they prefer to hold for the long term rather than sell in the short term.

Remarkably, this accumulation trend reassures holders, especially considering that the token has corrected by 6.23% in the past 24 hours and 6.76% over the last seven days. 

Meanwhile, it bears mentioning that exchange outflows alone are not enough to move the price, nor do they suggest that the underlying asset might recover. Hence, caution and due diligence remain key for an optimal investment.