Home Blog Page 401

If You Hold 5,000 XRP, Here’s What It Could Be Worth if Major Banks Adopt XRP for Cross-Border Transfers

0

As interest grows in XRP real use in global finance, many holders are starting to ask what widespread banking adoption could mean for its future price. 

Ripple continues to build out its technology and expand worldwide, making the idea of XRP serving as a global payment-settlement asset more realistic.

For many retail investors, 5,000 XRP is a common benchmark which is worth about $10,900 at today’s price of $2.18. But how much could it be worth if banks around the world began using XRP for cross-border payments?

Below is a simplified look at three major models that estimate XRP’s potential value.

Scenario 1: Market Capture Model — XRP at $83

In one of the most optimistic models, XRP is assumed to handle 10% of SWIFT’s $150 trillion annual transaction volume. 

Such a system would require about $5 trillion worth of XRP in circulation. Dividing that across roughly 60 billion tokens yields a price of about $83.33 per XRP.

At that valuation, 5,000 XRP would be worth approximately $416,650, a massive jump from today’s $10,900. This model depicts a world in which XRP becomes a significant liquidity source for global banking flows.

Scenario 2: Total Cross-Border Payments Model — XRP at $33

This scenario expands beyond SWIFT and includes the entire cross-border payments industry — remittances, business transfers, settlement flows, and consumer transactions — estimated at $200 trillion annually.

If XRP processed only 5% of that market, the network would require around $2 trillion in XRP liquidity, placing XRP’s price at about $33.33.

Under this model, 5,000 XRP would be valued at $166,650, representing a dramatic increase over the current portfolio value.

Scenario 3: Liquidity Reserve Model — XRP at $8

A more conservative model calculates price based on banks holding XRP as part of their liquidity reserve structure rather than transaction flow.

If 1,000 major banks each held $500 million in XRP, the combined liquidity pool would total $500 billion. Spread across the circulating supply, this places XRP near $8.33. Here, 5,000 XRP would be worth about $41,650, still nearly four times today’s value.

What Ultimately Shapes These Valuations?

The key variable across all scenarios is XRP’s velocity, which is the frequency with which the same tokens can be reused within the system.

  • Higher velocity reduces the amount of XRP locked in liquidity, lowering price pressure.
  • Lower velocity increases system demand for locked XRP, raising price pressure.

Depending on how deeply XRP integrates into institutional settlement frameworks and how its velocity evolves, ChatGPT suggests a potential range between $8 and $80+ per XRP under heavy utility-driven adoption.

For a holder of 5,000 XRP, that translates to a future value anywhere from $41,000 to over $400,000, depending on the scenario.


DeFi Protocol Balancer to Refund $8M to Users After $128M DeFi Hack

0

Balancer has proposed a plan to return nearly $8 million in recovered assets to liquidity providers affected by a major exploit earlier this month. 

In early November, Balancer V2 Composable Stable Pools suffered an attack that exploited a vulnerability, allowing the perpetrators to steal approximately $128.6 million.

Since then, the project says around $28 million has been recovered through internal operations and white-hat interventions. Of this amount, roughly $19.7 million in osETH and osGNO remains under the management of liquid staking protocol StakeWise.

How Balancer Plans to Distribute the Assets

Consequently, Balancer has now proposed a framework to restore funds exclusively to those directly affected. Specifically, the plan follows a non-socialized model, ensuring compensation is limited to liquidity providers in the exploited pools.

According to the proposal, payouts will be based on each user’s Balancer Pool Token balance at the time of the attack. Balancer added that all transfers will be made in-kind. In other words, users will receive the same types of tokens that were recovered during rescue efforts.

White Hat Contributions and Bounties

The proposal also highlights the critical role of white hat responders in mitigating the attack. For instance, six individuals or teams recovered a total of $3.86 million, with each eligible for a 10% bounty capped at $1 million per operation.

Notably, the largest recovery came from an individual known only as “Anon #1,” who secured approximately $2.68 million on the Polygon network. On Ethereum, security researcher Bitfinding retrieved $963,832.

Meanwhile, additional recoveries were made on Base and Arbitrum. However, the rescuers on Arbitrum have chosen to remain anonymous and will forgo their bounties.

To claim their rewards, eligible white hats must complete identity verification, KYC checks, and sanctions screening under Balancer’s SEAL Safe Harbor Agreement. This requirement, Balancer noted, serves to uphold regulatory and operational integrity during the compensation process.

Claim Deadlines and Governance Oversight

Moreover, the proposal sets clear expectations for the next stages. A 180-day claim window will apply to all recipients, including LPs and eligible white hats. After this period expires, any unclaimed funds will become dormant.

Finally, Balancer stated that decisions concerning the reallocation or repurposing of these assets will be entrusted to governance. This framework, in turn, empowers token holders to determine the management of any unused funds.

Arthur Hayes Insists on Bitcoin to $250K by Year End

0

BitMEX co-founder and former CEO Arthur Hayes remains unmoved in his $250,000 Bitcoin price projection, highlighting the catalysts for this rally.

It is barely 33 days to the end of the year, yet Hayes is still insistent on a 170% Bitcoin rally to a new all-time high of $250,000. In his Milk Road Show appearance on Wednesday, he refused to budge on BTC’s potential to achieve this hefty task.

“I’m going to stick with it,” he said, adding that Bitcoin either gets to the price or not.

Bitcoin Has Bottomed

Backing his bullish sentiment is the view that BTC has bottomed. Specifically, he earlier called the drop to $80,600 last week as the bottom for BTC, a prediction that appears to be playing out, at least for now. For context, Bitcoin has bounced nearly 12% from that low to its current price of $92,485.

Hayes highlighted that Bitcoin now has support from the US dollar liquidity, which he believes has also reached its bottom. He also noted that the Oct. 10 leverage washout, which wiped out billions of dollars from the crypto market, has stirred a reset.

Remarkably, Hayes suggests that the inflows into BlackRock’s iShares Bitcoin ETF (IBIT) were part of a “basis trade” strategy. Large institutions like Goldman Sachs invest in the Bitcoin ETF and use it to borrow money to open short positions on the CME against the underlying asset.

As funding rates dwindle, these institutions unwind these contracts by selling the ETFs to buy back the futures contract at a gain. The BitMEX co-founder believes this leveraged institutional move has now run its full course.

“We are bottom here and can go higher,” Hayes concluded.

Liquidity and QT to Fuel Rally to $250K

Meanwhile, he expects the now-bottomed US dollar liquidity, along with the end of quantitative tightening (QT), to drive the next Bitcoin leg up. Notably, the Federal Reserve System (Fed) slashed interest rates by 25 bps in October, teasing that the days of reducing the money supply are nearing an end.

Data from Polymarket shows an 87% chance that the Fed will cut interest rates by December 10. Before then, analysts expect the Fed to end QT as early as December 1.

Hayes believes that these events would drive Bitcoin through its current all-time high of $126,220 to $250,000 before the end of the year. However, he suggested that he might be wrong, but it doesn’t matter much to him.

“I’m long, right? I’m still happy either way,” Hayes stated.

How Bitcoin Price Could Move as Fed December Rate-Cut Odds Hit 87%

0

Bitcoin is back in rally mode as expectations for a December Federal Reserve rate cut surge to their highest level yet this month.

Specifically, traders are now pricing in up to an 87% chance of a rate cut.

Bitcoin Breaks Above $92,000 as Dovish Fed Bets Strengthen

Today, Bitcoin surged past $92,000, climbing more than 1.5% in 24 hours to $92,960 — its highest price this week. The rally comes as investors increasingly believe President Donald Trump will appoint a more dovish Federal Reserve chair before Christmas.

Screenshot 2025 11 28 at 43018 pm
Bitcoin price chart CoinMarketcap

Treasury Secretary Scott Bessent confirmed that Fed chair interviews are in their final round, signalling that the decision is “moving along very well.”

The possibility of a new, more rate-friendly Fed leader, combined with growing bets on a December cut, has boosted risk appetite.

The global crypto market cap rose 1.5% to $3.14 trillion, although it has only recovered a fraction of last week’s losses.

Why Surging 87% Rate-Cut Odds Matter for BTC

Prediction markets such as Kalshi and Polymarket now show probabilities above 80–87% for a 25-basis-point cut at the Fed’s Dec. 9–10 policy meeting. Financial markets also assign an 87% probability of a rate cut, according to CME’s FedWatch tool.

In other words, traders see very little chance that the Fed will hold rates steady (only 13% are betting on no change), and almost no chance of a larger cut, with just 1% expecting a reduction of 50 basis points or more.

Screenshot 2025 11 28 at 42607 pm
Market prediction for rate cut | Polymarket

Lower interest rates typically weaken the dollar, boost liquidity, and improve risk sentiment across the crypto market. Bitcoin price has already shown signs of stability around the $90,000 level, and a confirmed December cut could strengthen the case for BTC to retest the $100,000 mark.

In such a scenario, some analysts see potential for Bitcoin to break new all-time highs. For instance, Dr. Whale, a widely followed market commentator, has predicted that Bitcoin could reach $130,000 to $150,000 in the next four months.

Tom Lee on His $250K Bitcoin Prediction

Meanwhile, BitMine chairman Tom Lee has softened his long-standing call for Bitcoin to hit $250,000 by the end of 2025. He now says only that BTC may reclaim its October all-time high of $126,200, though he still expects Bitcoin to finish the year above $100,000.

Lee previously stood by his $250,000 target through early October, even as other industry figures, including Galaxy Digital’s Mike Novogratz, argued that such a move would require “crazy” conditions.

House Democrats Call Trump’s White House Most Corrupt Private Crypto Startup

0

A new staff report from House Judiciary Committee Democrats accuses President Donald Trump of turning the Oval Office into a crypto startup to enrich his family. 

Released earlier this week by Ranking Member Rep. Jamie Raskin (D-MD), the report, titled “Trump, Crypto, and a New Age of Corruption”, alleges that Trump’s presidency has evolved into a personal wealth-generating machine built around cryptocurrency ventures linked to foreign governments, corporate allies, and criminal actors. 

Trump’s Crypto Empire Soars to $11 Billion

It states that Trump expanded his crypto empire during and after the 2024 election, generating billions in new wealth. The report cites a Reuters investigation claiming Trump and his family earned $800 million from crypto sales in the first half of 2025. Consequently, it estimated the value of Trump’s crypto ventures, including World Liberty Financial and his meme coins, at roughly $11 billion. 

It categorically named Justin Sun as one of the leading investors in World Liberty Financial, referring to him as the owner of “illicit crypto exchange,” Tron. Despite this description, Tron is a public blockchain and the underlying network of the USDT stablecoin. 

Crypto Donations in Exchange for Political Pardons and Reduced Scrutiny

Moreover, the report alleges that foreign nationals and state-linked entities invested heavily in Trump-linked crypto ventures. Per the report, these investors received swift policy rewards through the shutdown of federal investigations and enforcement actions.

Notably, Ripple, Coinbase, Kraken, Yuga Labs, and Gemini were mentioned as firms that benefited from reduced scrutiny after donating to Trump’s campaign. It also points to Trump’s pardons of key crypto stakeholders involved in crypto-related crimes, describing them as rewards for backing his ventures. 

The allegations come several weeks after Trump pardoned Binance’s co-founder Changpeng Zhao (CZ), who served a four-month prison sentence last year for violating U.S. anti-money laundering (AML) rules. 

Committee’s Warnings 

Meanwhile, the report criticizes Trump’s pro-crypto agenda, describing it as another self-enrichment strategy driven by his family’s crypto interests. It also alleged that Trump rewarded crypto donors by dismantling federal safeguards, including the DOJ’s National Cryptocurrency Enforcement Team (NCET).

Beyond these allegations, the committee warns that a president who accumulates vast private wealth from influence-seeking crypto actors exposes major legal weaknesses and vulnerabilities in anti-bribery laws and in conflict-of-interest laws. 

Therefore, the committee urges Congress to act quickly and pass new reforms to restore accountability and integrity to the presidency. 

Here Are Case Scenarios for XRP Price as $2.89M Longs Are Liquidated

XRP edges higher after a rebound as long positions suffer from liquidations, leaving traders split between hopes of recovery and correction.

XRP is trading around $2.20 at press time, up about 1.2% over the last 24 hours. The price has fluctuated between $2.17 and $2.24 today, showing active intraday trading after a strong rebound earlier this week. With a market cap above $132 billion and almost $3 billion in 24-hour volume, XRP remains one of the most liquid large-cap cryptocurrencies. 

The token has climbed roughly 16.7% over the past seven days but is still lower on the 30-day horizon. Against this backdrop, traders and analysts are examining whether the current structure points to continued accumulation or signal the risk of a deeper corrective move.

XRP Price Prediction

On the daily XRP/USD chart, price is trying to stabilize after a persistent November downtrend. XRP is currently trading around $2.22, just above the 20-day Bollinger Band midpoint at $2.21. That means bulls have managed to reclaim the mean after briefly pushing price down to the lower band near $1.92, which now acts as key short-term support.

XRP
XRP

The upper Bollinger Band sits around $2.50, marking the next major resistance zone. With price trapped between the midline and the upper band, and the bands starting to narrow, XRP is effectively in a consolidation phase. Notably, a sustained close above $2.25 would strengthen the case for a move toward $2.50, while slipping further below the midline would put a retest of $2.00–$1.92 back on the table.

The Chande Momentum Oscillator (9) is currently near +21, having risen sharply from negative territory. This shows that short-term momentum has shifted in favor of buyers and that the recent bounce has some strength behind it. 

However, the reading is not yet in overbought territory, suggesting there is still room for XRP to extend its recovery if buying pressure continues. The broader picture remains fragile until XRP can break convincingly above the $2.50 resistance zone.

XRP Liquidation Data 

Meanwhile, the XRP liquidation data shows that derivatives traders have been whipsawed over the past day, with a clear bias toward long positions getting flushed out. Over the last 24 hours, roughly $4.40 million in XRP positions have been liquidated, split between about $2.89 million in longs and $1.50 million in shorts. 

Coinglass
Coinglass

Zooming in, the 12-hour window accounts for $2.81 million of that, $1.59 million from longs and $1.23 million from shorts, highlighting how both sides of the market have been caught by sharp intraday swings.

Short-term data, however, hints at a shift in pressure. In the past 4 hours, around $1.66 million has been liquidated, with longs still dominating at $1.49 million, but in the most recent hour, nearly all the $168.30K in liquidations came from shorts ($160.57K vs. $7.73K in longs).

This pattern lines up with XRP’s recent bounce off support: earlier downside moves forced overleveraged longs out of the market, while the latest uptick is now squeezing late-entering shorts. Overall, the data confirms that XRP remains in a highly volatile phase where aggressive leverage on either side is being punished.

Bloomberg Strategist Says Bitcoin on Track to Revisit Yearly Pivot at $50,000: Here’s Why

0

A well-known commodity strategist at Bloomberg Intelligence says there’s a chance Bitcoin could collapse 45% from here to its yearly pivot.

Notably, Bitcoin (BTC) has bounced over the past week, but the market still shows signs of stress from a longer timeframe. The price has climbed about 9% in the last 7 days to trade around $92,400, yet it continues to post a sharp drop for November.

With the month showing a decline of roughly 15%, Bitcoin remains on track for its biggest monthly loss since February 2025 unless buyers regain stronger control soon. 

Bitcoin Risks Dropping to $50,000

However, Bloomberg Intelligence senior commodity strategist Mike McGlone argues that Bitcoin still risks sliding back toward its yearly pivot near $50,000.

McGlone revealed this in a post on X today, sharing a chart that tracks Bitcoin’s yearly performance from 2014 to 2025 alongside the S&P 500 Index and the S&P 500’s 120-day volatility. Data from the chart shows that Bitcoin often gravitates back to the $50,000 level, which has acted as an important midpoint for the market since 2021. 

Bitcoin Yearly Pivot Since 2021 Bloomberg Intelligence
Bitcoin Yearly Pivot Since 2021 | Bloomberg Intelligence

Bitcoin first claimed this $50,000 mark in March 2021 and has since continued to pull or push toward it. Despite trading roughly 84% higher from this level, past behavior signals that the crypto firstborn frequently returns to the central pivot when global markets tighten.

The chart further highlights how closely Bitcoin tends to move with the S&P 500. At the time of the analysis, the volatility reading sits near 11%, one of the lowest year-end levels since 2017. 

According to McGlone, this unusually low volatility may indicate rising pressure. Now, when equity volatility drops to such lows, markets often set up for sharp moves, and he believes Bitcoin could respond by drifting back toward $50,000. Bitcoin last saw this price in August 2024.

For perspective, a decline to this level would mark a 45.8% drop from the current price. The last time BTC saw a crash of this magnitude was from April to June 2022, when it collapsed by over 70% within these three months amid the contagion from the Terra implosion.

Analysts Eyeing a Full Bitcoin Recovery

While McGlone warns about the potential downside, several other analysts see room for a full recovery if buyers break through key resistance levels. For instance, Michaël van de Poppe says Bitcoin needs to push above the $91,000 to $94,000 zone to shift momentum upward. If it clears that area, he expects the market to move toward $100,000 and possibly higher.

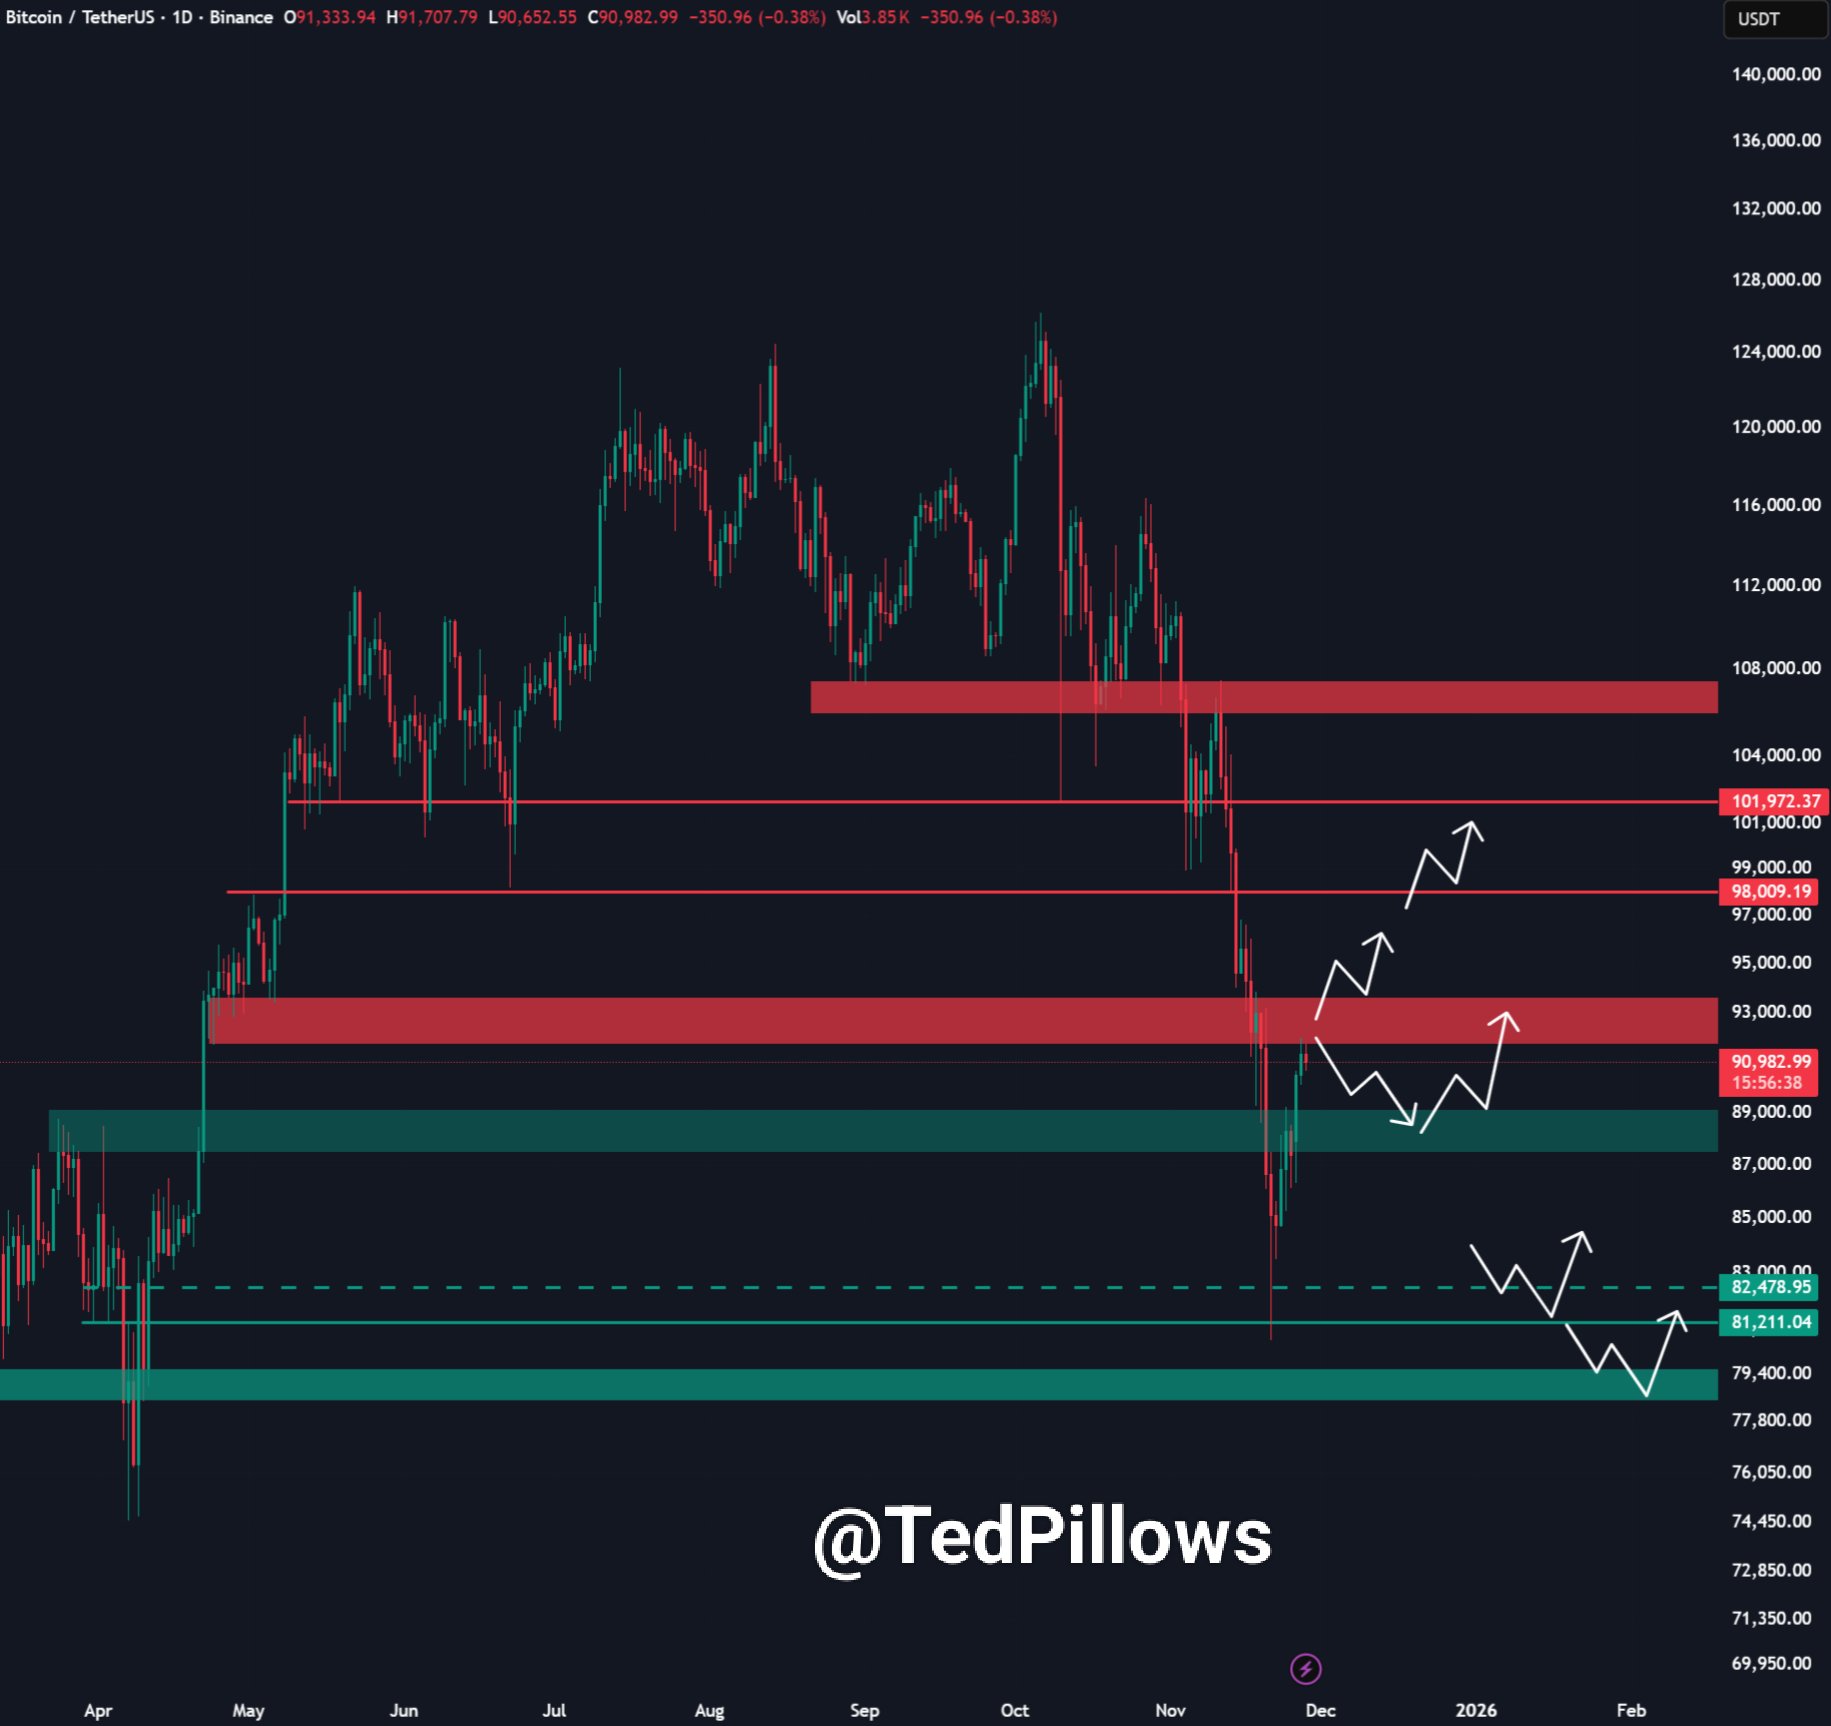
Analyst Ted Pillows presented a similar analysis but focused on the resistance between $92,000 and $93,000. He says Bitcoin must reclaim this region for buyers to target a run toward $98,000 to $100,000. If the market fails to break through, he believes a drop back toward the $88,000 level could ensue.

Bitcoin 1D Chart Ted Pillows
Bitcoin 1D Chart | Ted Pillows

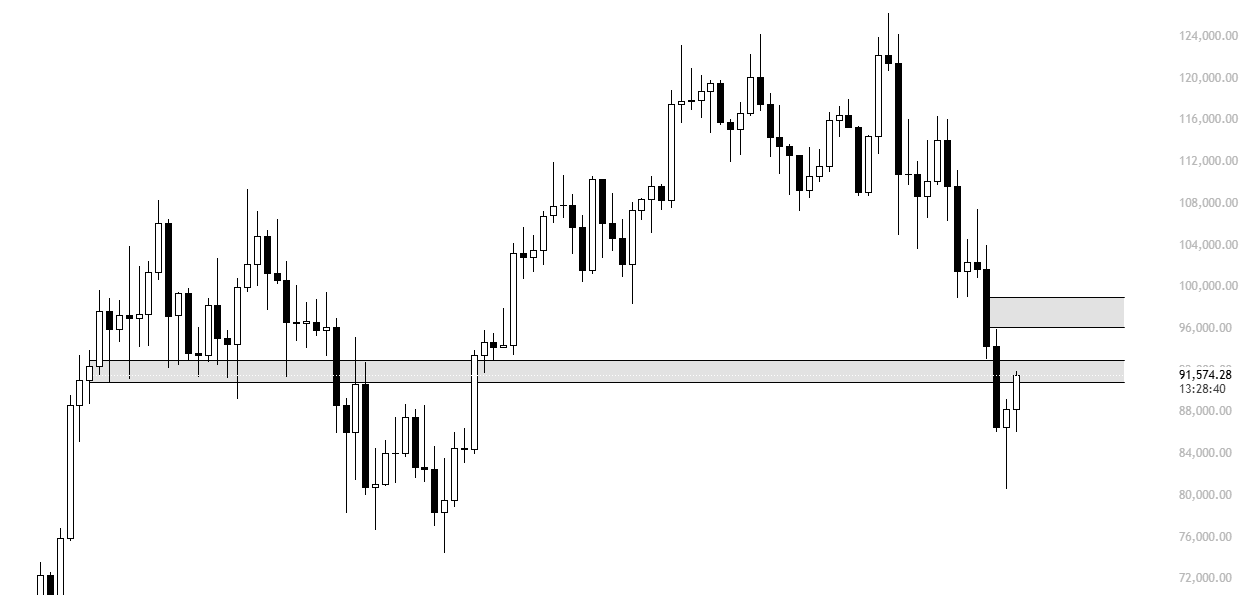
Meanwhile, market analyst Killa noted that despite Bitcoin’s 15% climb from recent lows in just 7 days, it hasn’t formed a clear higher low. According to him, it now approaches major resistance while trading on declining volume. 

He explained that strong downtrends often reject the first attempt to reclaim a major level, which usually sends the price back to retest demand before a real reversal forms. The analyst believes BTC would likely rise from $80,000 to $92,000, then drop to $88,000 before recovering toward $96,000 rather than surging straight from $80,000 to $96,000.

Bitcoin Chart KillaXBT
Bitcoin Chart | KillaXBT

Finance Expert Says 200% XRP Price Surge Is Extremely Conservative

0

XRP supporters are once again drawing parallels between Bitcoin’s explosive post-ETF performance and what could happen next for XRP.

Finance commentator Zach Rector says many investors are still underestimating how powerful ETF-driven demand can be. He argues that a 200% rally in XRP is “extremely” conservative. Notably, XRP currently trades at $2.20, up slightly by 0.38% today.

“Bitcoin Pumped 200% After ETFs — XRP Can Do the Same, or More”

Rector highlighted that Bitcoin surged over 200% after its spot ETFs launched in January 2024. BTC climbed from the post-ETF low of $38,518 to new record highs above $126,000.

He noted that XRP’s current setup closely mirrors Bitcoin’s early ETF phase, yet some investors remain skeptical of a comparable rally. According to Rector, XRP has the potential to exceed a 200% surge.

For context, a 200% increase from the current price would put XRP at $6.60, entering uncharted territory for the coin.

Meanwhile, Rector’s recent ETF analysis projected that XRP could add $500 billion to $1 trillion in market value over the next few years, potentially placing XRP in the $10–$20 range depending on the scale of institutional inflows.

“Most Don’t Understand What’s Coming”

Rector’s post drew similar reactions, with some noting that the market remains largely unaware of developing ETF dynamics. Crypto commentator Rohit Chaudhary responded, “Most have no idea what’s happening behind the scenes and what’s coming with XRP.”

Community member AlfRed pointed out that the actual available XRP supply is much smaller than what exchanges report. He suggested a scenario in which most XRP holders refuse to sell below $5, leaving only a small portion available. 

In this case, even if exchanges list 4.2 billion XRP, only a fraction would be for sale at current prices, potentially driving the price higher.

Screenshot 2025 11 28 at 20623 pm
XRP community reactions

Earlier forecasts suggest XRP ETFs could see $5–10 billion in monthly inflows, similar to Bitcoin’s launch. Using Bitcoin’s inflow-to-market-cap model, Rector believes XRP could be poised for a major revaluation.

Post-ETF Patterns: Is XRP Repeating Bitcoin’s Early Dip Before a Rally?

Market analysts have also noted a dip in XRP’s price following the launch of Canary Capital’s XRPC ETF, similar to Bitcoin’s behavior after its ETF debut.

Bitcoin fell 21% in the two weeks after ETF approval in January 2024, before staging a massive recovery that ultimately saw a 227% rise from its post-ETF low.

Analyst EGRAG recently suggested that XRP may be following the same pattern. XRP has seen a short-term dip below $2 after ETFs, somewhat mirroring Bitcoin’s trajectory. EGRAG projects a potential run toward $6–$7, though this has yet to materialize. 

Other analysts have issued longer-term projections of $10–$20 based on ETF inflows, reinforcing Rector’s view that a 200% surge may indeed be “conservative.”

However, XRP may not exactly follow Bitcoin’s blueprint and could chart its own trajectory. For instance, Ethereum has had ETF purchases since last year, yet its price has not experienced the same post-ETF surge seen with Bitcoin.

Shiba Inu Eyes Big Move as Falling Wedge Nears Breakout

0

A Shiba Inu rebound to greater heights is imminent, as recent reversal price action has steadied the course for a falling wedge breakout.

Shiba Inu (SHIB) has been a major beneficiary as positive momentum slowly returns to the crypto market. The token has rebounded over 14% this week and 18.4% from its low of $0.00000755 last week, sparking bullish sentiment among enthusiasts.

Glimpse of Future Trend

Meanwhile, this could be part of a larger bullish trend, a recent Shiba Inu price prediction suggested. Specifically, Bitcoinsensus highlighted a forming wedge on the SHIBUSDC weekly chart, whose completion would catalyze a big move for the meme coin.

The channel traces back to Shiba Inu’s lower low formation around $0.0000129 in September 2024. This marked a crucial support formation for the channel’s lower trendline. Shiba Inu bounced from that level to its December 2024 high of $0.00003343, forming the upper resistance trendline.

Most recently, SHIB retested the lower boundary of the now-tightening wedge with last week’s low. Specifically, amid this drop, it faked a breakdown below the channel, but its recovery this week has put things back on course.

Possible Shiba Inu Breakout

Bitcoinsensus now expects SHIB to continue this trend toward the upper resistance and finally break out to greater heights.

Long-Term Shiba Inu Pattern Nears Completion

The breakout point from the falling wedge lies around $0.0000110. The analyst predicted that Shiba Inu would finally break this supply zone, releasing the momentum from multi-month price suppression.

Following the breakout, he highlighted that a pullback to retest the channel’s top would ensue. The chart shows a possible 56.5% break to $0.000014, followed by a retest of the channel’s upper trendline. Notably, a successful breakout and retest would pave the way for a major upside move.

Meanwhile, this big move would target an initial 112.5% rally towards $0.0000190. However, a typical falling wedge usually retests the structure’s high. As such, SHIB could retest the December high of $0.00003343, marking a 274% growth from its current market price.

Notably, the $0.00003343 target also aligns with earlier Shiba predictions. Analyst Kamile Uray highlighted this as one of her targets in a Thursday outlook, pinpointing a rally toward $0.000088 as the ultimate move.

Analyst Says XRP is ‘Not Bearish in the Slightest’

0

Market analyst Charting Guy has insisted that XRP has not slipped into bearish territories despite the weak monthly RSI.

His latest analysis comes on the back of the ongoing downtrend impacting XRP and the broader crypto market. For context, despite a recent recovery push to the $2.2 price region this week, XRP has collapsed over 24% since October. 

With a 10% drop so far in November, XRP is now on track to record a second consecutive monthly decline for the first time since March. Amid the downward push, some market pundits have identified a weakening relative strength index (RSI) trend. However, Charting Guy believes XRP remains in a favorable position.

XRP Still Not Bearish in the Slightest 

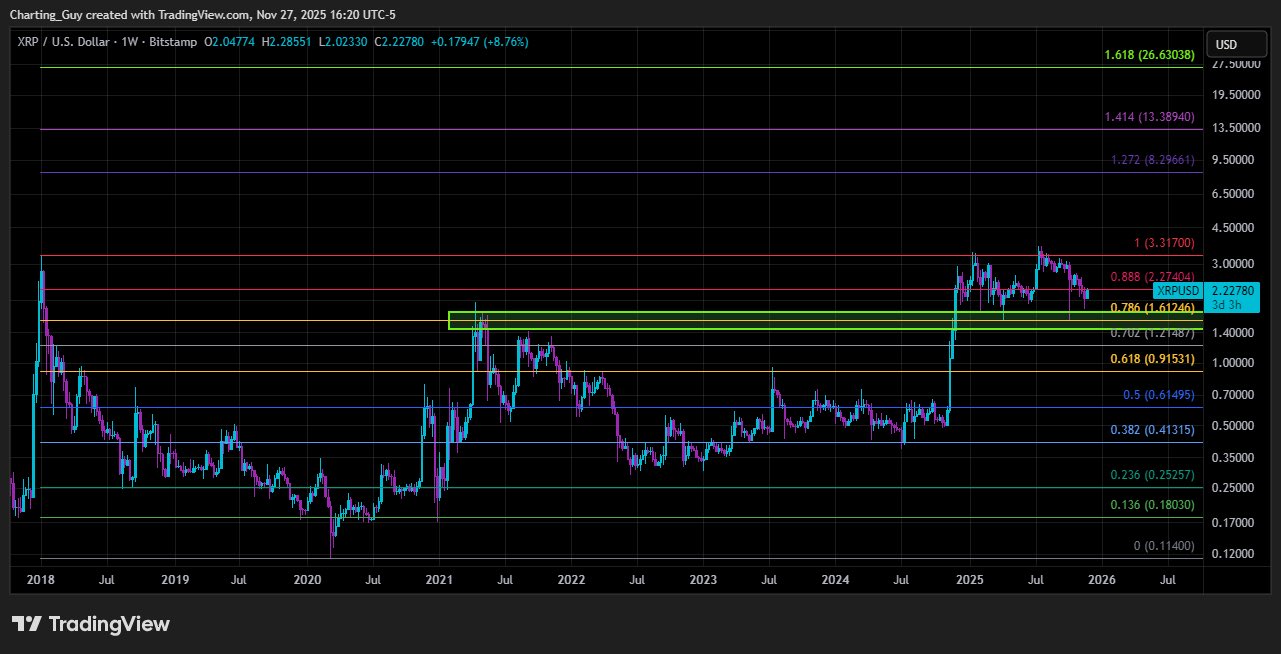
“XRP is still NOT bearish in the slightest,” he said in a Thursday analysis, building on an earlier report he presented last month. According to the analyst, the ongoing struggles have not turned the overall market bearish. Instead, XRP is merely looking to build support at the previous cycle peak as well as a golden pocket top.

For context, data from the accompanying chart shows XRP forming a solid base above the 2021 bull run peak. Notably, during that bull run, XRP soared to a high of $1.96 in April 2021, and eventually faced resistance at this level, marking the cycle top.

XRP 1W Chart Charting Guy
XRP 1W Chart | Charting Guy

Interestingly, in the ongoing cycle, XRP has not only recovered this $1.96 high, but it has maintained its hold above the pivotal level, flipping it to support throughout this year. According to Charting Guy, XRP’s current mission is to solidify the support in this region before its eventual upsurge.

Weakening Monthly RSI

He called attention to reports from other analysts, who confirmed that the RSI on the monthly chart has continued to lose steam. Notably, since recovering to a high of 73.08 in July during the rally to the $3.66 peak, the XRP monthly RSI has collapsed. At press time, the RSI now sits around 57.

XRP Monthly RSI
XRP Monthly RSI

With this gradual decline, some analysts have suggested that XRP may be weak, and this could lead to further declines. However, Charting Guy kicked against this interpretation. He especially pointed out that the monthly RSI actually topped for this year when it hit 84.4 in January, and has since been dropping.

According to him, the RSI has been weak throughout this year, but XRP has still not witnessed intense price drawdowns. Notably, XRP is still up 6.82% this year despite the recent declines. In contrast, Bitcoin (BTC) has dropped 1.92% within the same period, and Ethereum (ETH) is down 8.37%.

Charting Guy stressed that despite the RSI seeing weak momentum all year, XRP has only consolidated and defended its support. He suggested that the ongoing trend is likely a re-accumulation phase that leads to rapid declines in technical indicators that could lead to their reset, while the price remains stable.

Data from his chart shows that, upon recovery, XRP could retest multiple Fibonacci levels. The first two zones are the 0.888 and 1 Fib levels respectively at $2.27 and $3.31. Beyond these, XRP could target Fibonacci extensions around 1.272 and 1.414, corresponding to new peaks of $8.29 and $13.38. The last Fib level rests around 1.618 at $26.6.

Meanwhile, in previous analyses, Charting Guy had suggested where he thinks XRP may be headed once it recovers from this consolidation and engineers a bullish push. Recently, he said the consolidation was a test of investor resilience, projecting a possible run to $8 once bullish momentum resumes.