Home Blog Page 666

Shiba Inu Investors Holding for 1 to 12 Months Have Amassed 29,570,000,000,000 SHIB This Month

0

Shiba Inu investors that have been holding for 1 to 12 months have increased their holdings by nearly 30 trillion SHIB this month alone.

Notably, the crypto market has remained in an extensive consolidation phase, with altcoins feeling more of an impact than the crypto firstborn. Particularly, while Bitcoin is up 13.36% year-to-date, the global altcoin market (TOTAL2) has dropped 15% within the same period, with Shiba Inu (SHIB) contributing to this downtrend.

For context, Shiba Inu has collapsed 44.68% this year alone, now trading below the pivotal $0.000012 support. While this level has since flipped to resistance, it appears mid-term holders are either adding to their investments amid the downtrend or welcoming new entrants.

Shiba Inu Cruisers Amass 29.57T SHIB in June

Specifically, data from blockchain analytics platform IntoTheBlock shows that Shiba Inu wallets holding SHIB for the past 1 to 12 months, a class of investors called “Cruisers,” have increased their cumulative balance to a whopping 199.13 trillion tokens worth over $2.2 billion at press time. 

Notably, this current figure represents a massive spike in the balance of these addresses this month alone. Particularly, these wallets held 169.56 trillion SHIB tokens at the end of May 2025. As a result, the current balance of 199.13 trillion tokens represents an increase of 29.57 trillion SHIB since the start of June.
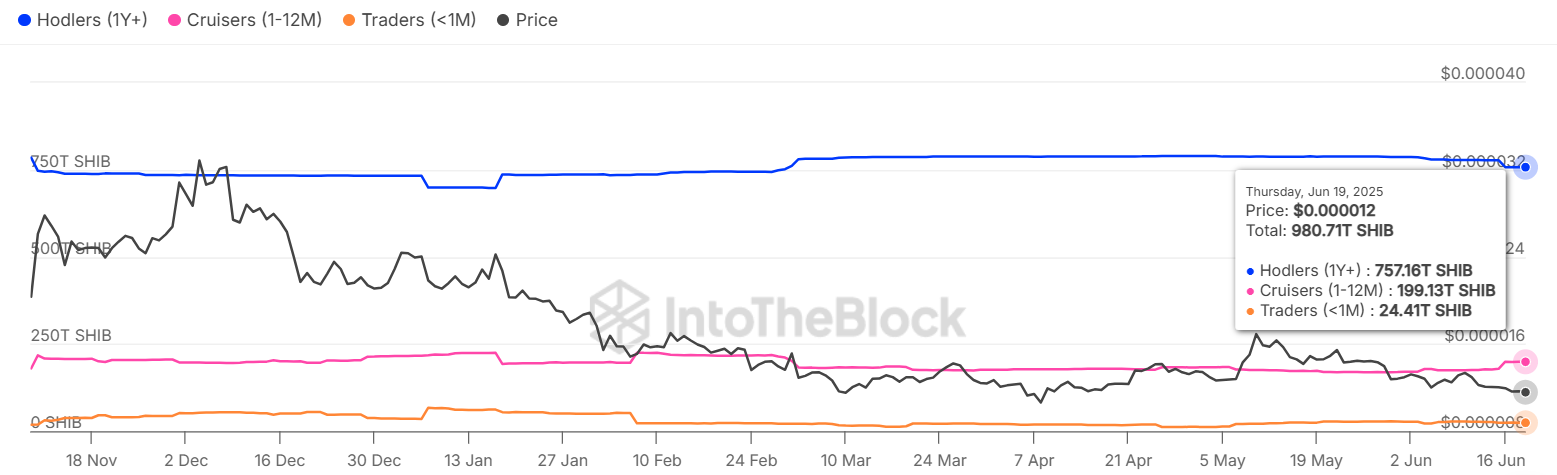
Shiba Inu Balance of Addresses by Time Held ITB
Shiba Inu Balance of Addresses by Time Held | ITB

This surge marks the largest 20-day uptick in these wallets’ cumulative balance in recent times despite Shiba Inu’s price collapsing 8.21% within this period. Such a rise could either come from a flood of new entrants who eventually transformed from Traders to Cruisers or an actual increase in the balances of existing Cruisers.

Further data indicates that the latter might be the case. Specifically, while the balance of these addresses surged tremendously, the number of addresses in this class actually reduced this month. At the end of May, there were 286,180 addresses holding for 1 to 12 months. This figure has dropped to 283,860.

Shiba Inu Addresses by Time Held ITB
Shiba Inu Addresses by Time Held | ITB

Other Classes of Shiba Inu Addresses Selling Off

Also, it appears that while Cruisers (those holding for 1 to 12 months) have accumulated 29.57 trillion tokens this month, Hodlers (those holding for at least a year) have withdrawn 29.28 trillion SHIB, while Traders (those holding for less than a month) have sold off 3.78 trillion tokens.

This indicates that despite the accumulation trend among Cruisers, the selloff campaign from the other classes of investors has created a balance, contributing to the current price downturn. If Hodlers flip, the accumulation could finally have an impact on price. Right now, Shiba Inu trades for $0.00001176, up 1.19% in the past 24 hours.

Dogecoin Forms Crucial Base at $0.17: Is a Bullish Rebound on the Horizon?

Dogecoin finds support at $0.17 as bearish momentum fades, while on-chain and derivatives data hint at a potential bullish reversal toward $0.20.

As top cryptocurrencies hold key support levels, meme coins have been on a downward trajectory. The segment’s market cap has dropped 20% over the past 30 days, now at $54.63 billion.

Meanwhile, Dogecoin appears to be forming a base at $0.17. With lower price rejections and rising optimism in the derivatives market, could Dogecoin be gearing up for a bullish comeback?

Dogecoin Price Analysis

On the daily chart, Dogecoin’s price action shows a base forming near the $0.17 support zone. Notably, Dogecoin has previously rebounded from this level in April, May, and June.

Dogecoin Derivatives

Following a recent bounce from a weekly low of $0.1639 to $0.1711, Dogecoin shows signs of an extended recovery.

The MACD and signal lines are nearing a bullish crossover, while the daily RSI has risen after reversing from the oversold zone. This suggests a short-term uptick in bullish sentiment, supporting the potential for a price rebound.

According to Fibonacci retracement levels, a daily close above the 23.60% mark could push Dogecoin toward the psychological resistance at $0.20. Conversely, a close below the current support zone could open the door to a decline toward $0.15.

Analyst Spots Bullish Crossover Ahead of Potential Dogecoin Reversal

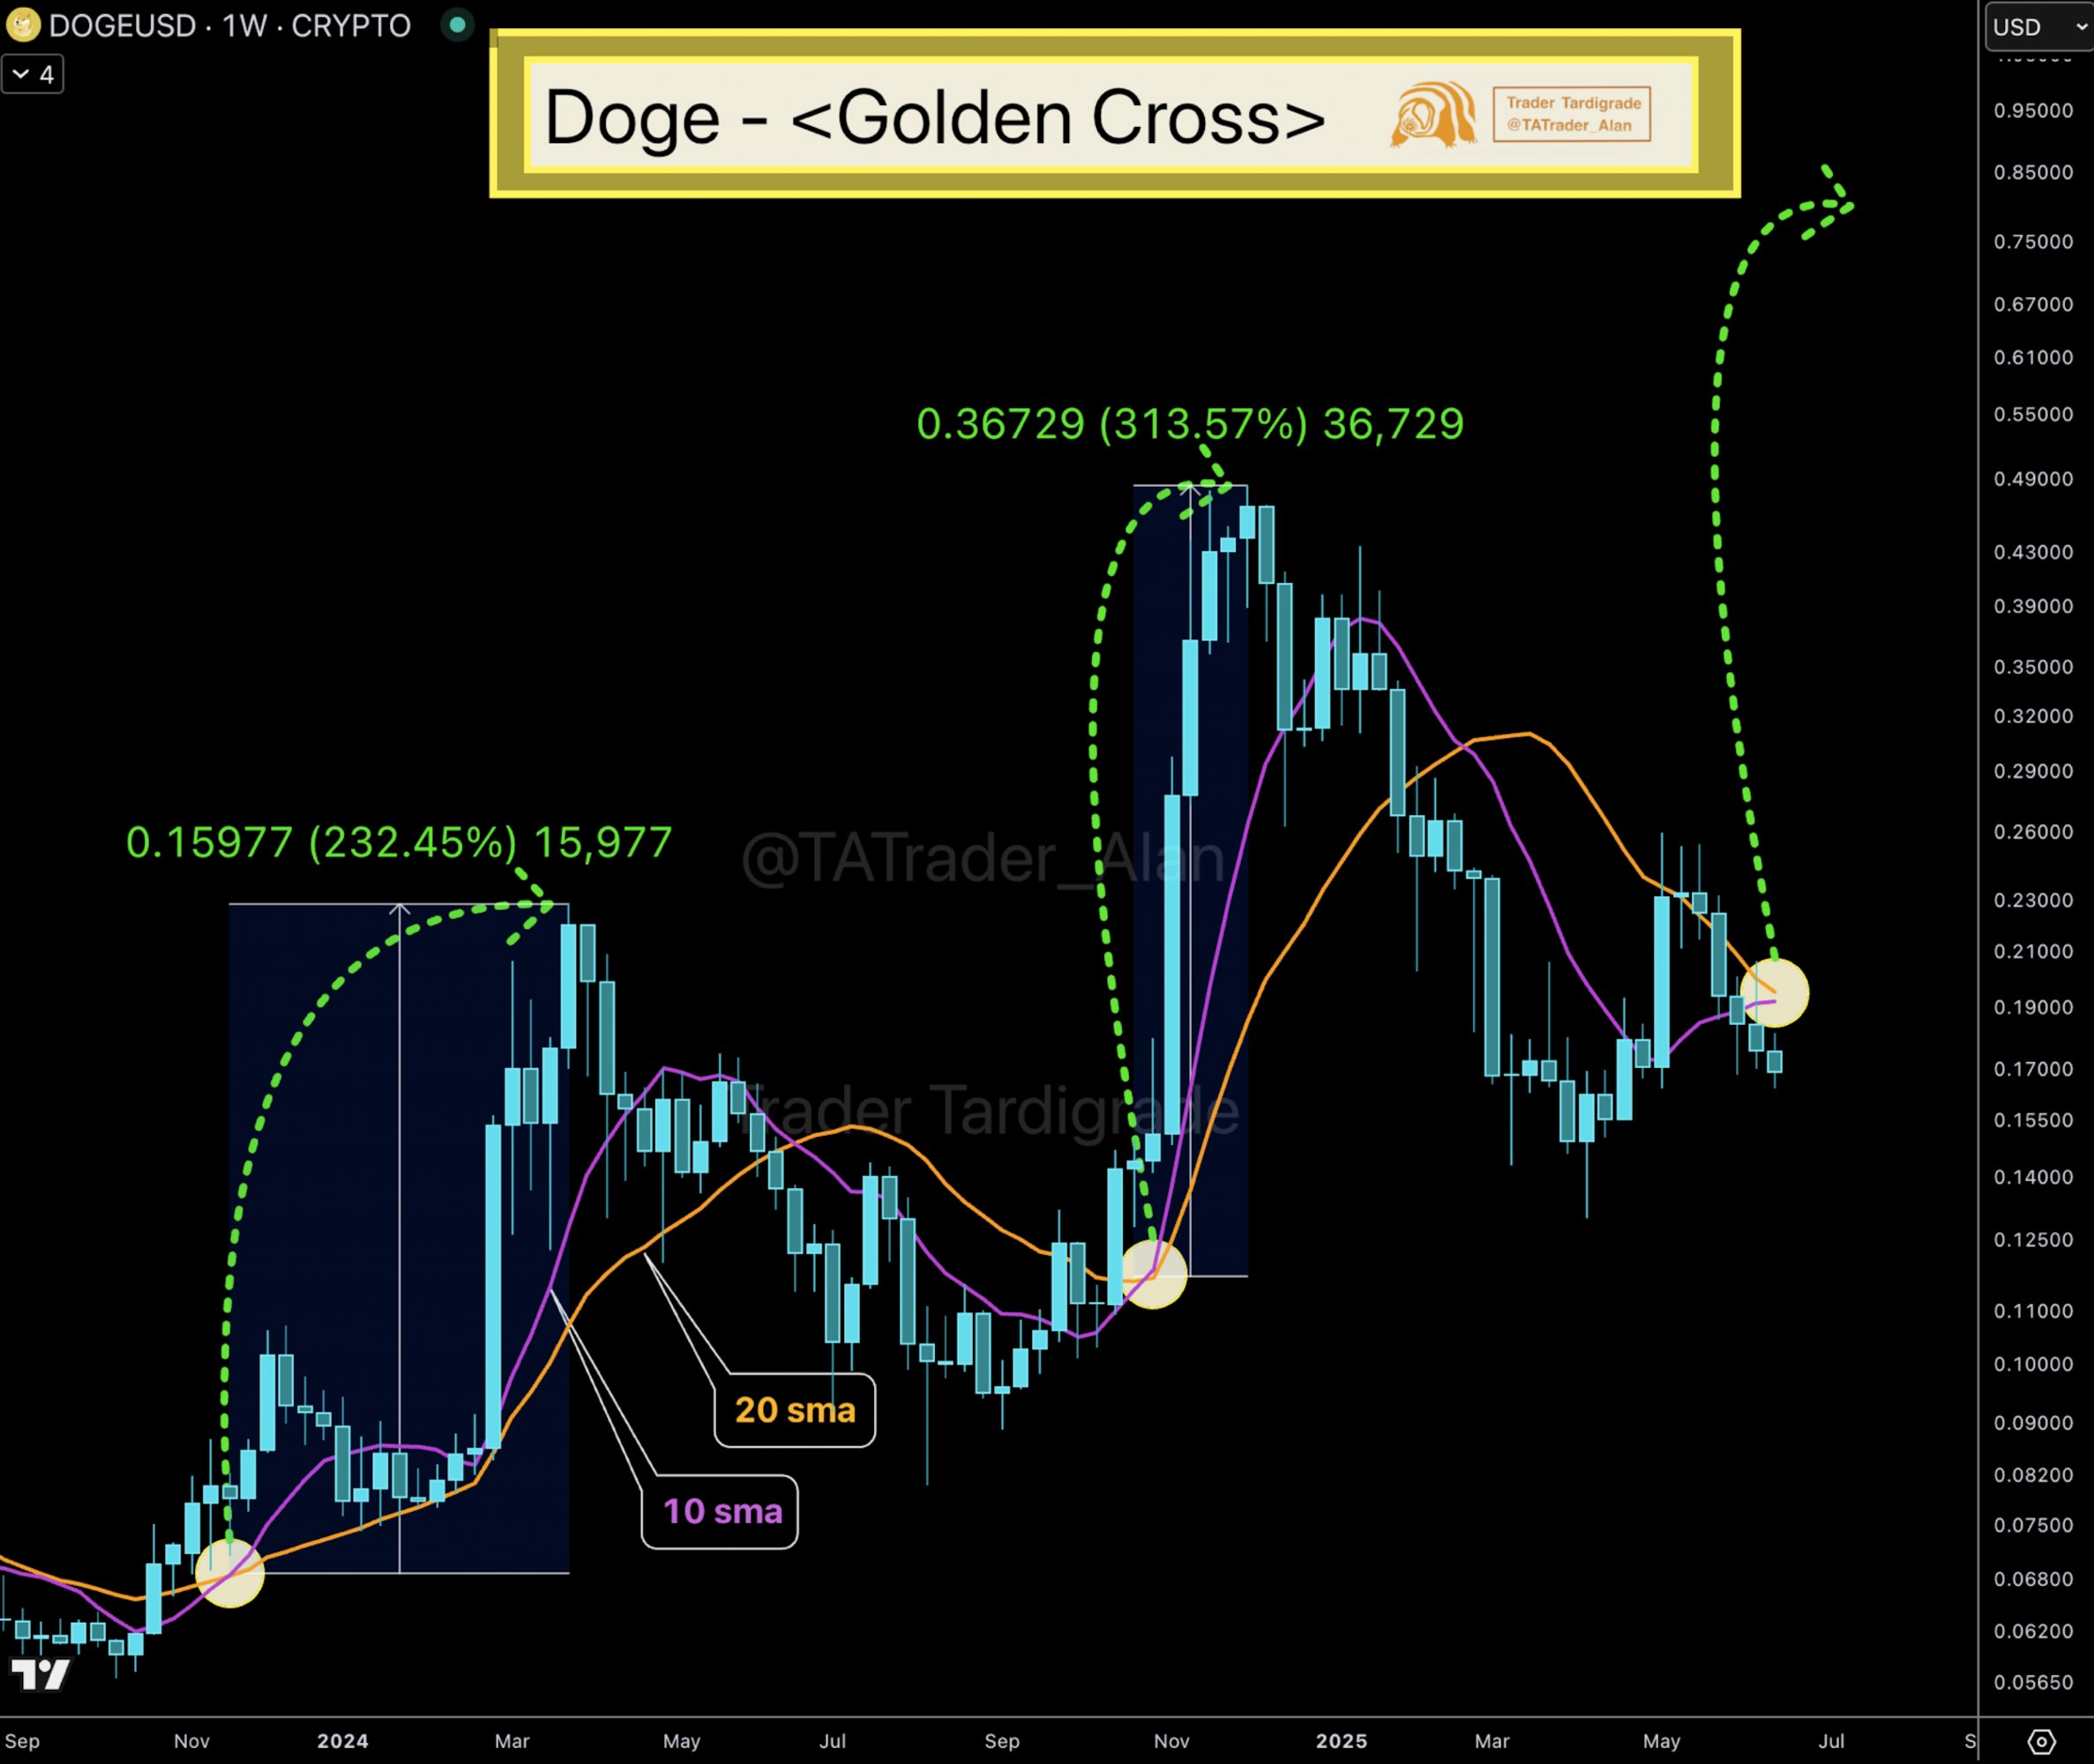
Supporting the bullish outlook, crypto analyst Trader Tardigrade highlighted the potential for a major price turnaround. According to the analyst, a bullish crossover between the 10-week and 20-week simple moving averages (SMAs) is approaching.

Historically, this crossover has led to Dogecoin price surges ranging from 200% to 300%. As Dogecoin nears this technical signal once again, the odds of a significant uptrend increase.

Image

Dogecoin Derivatives

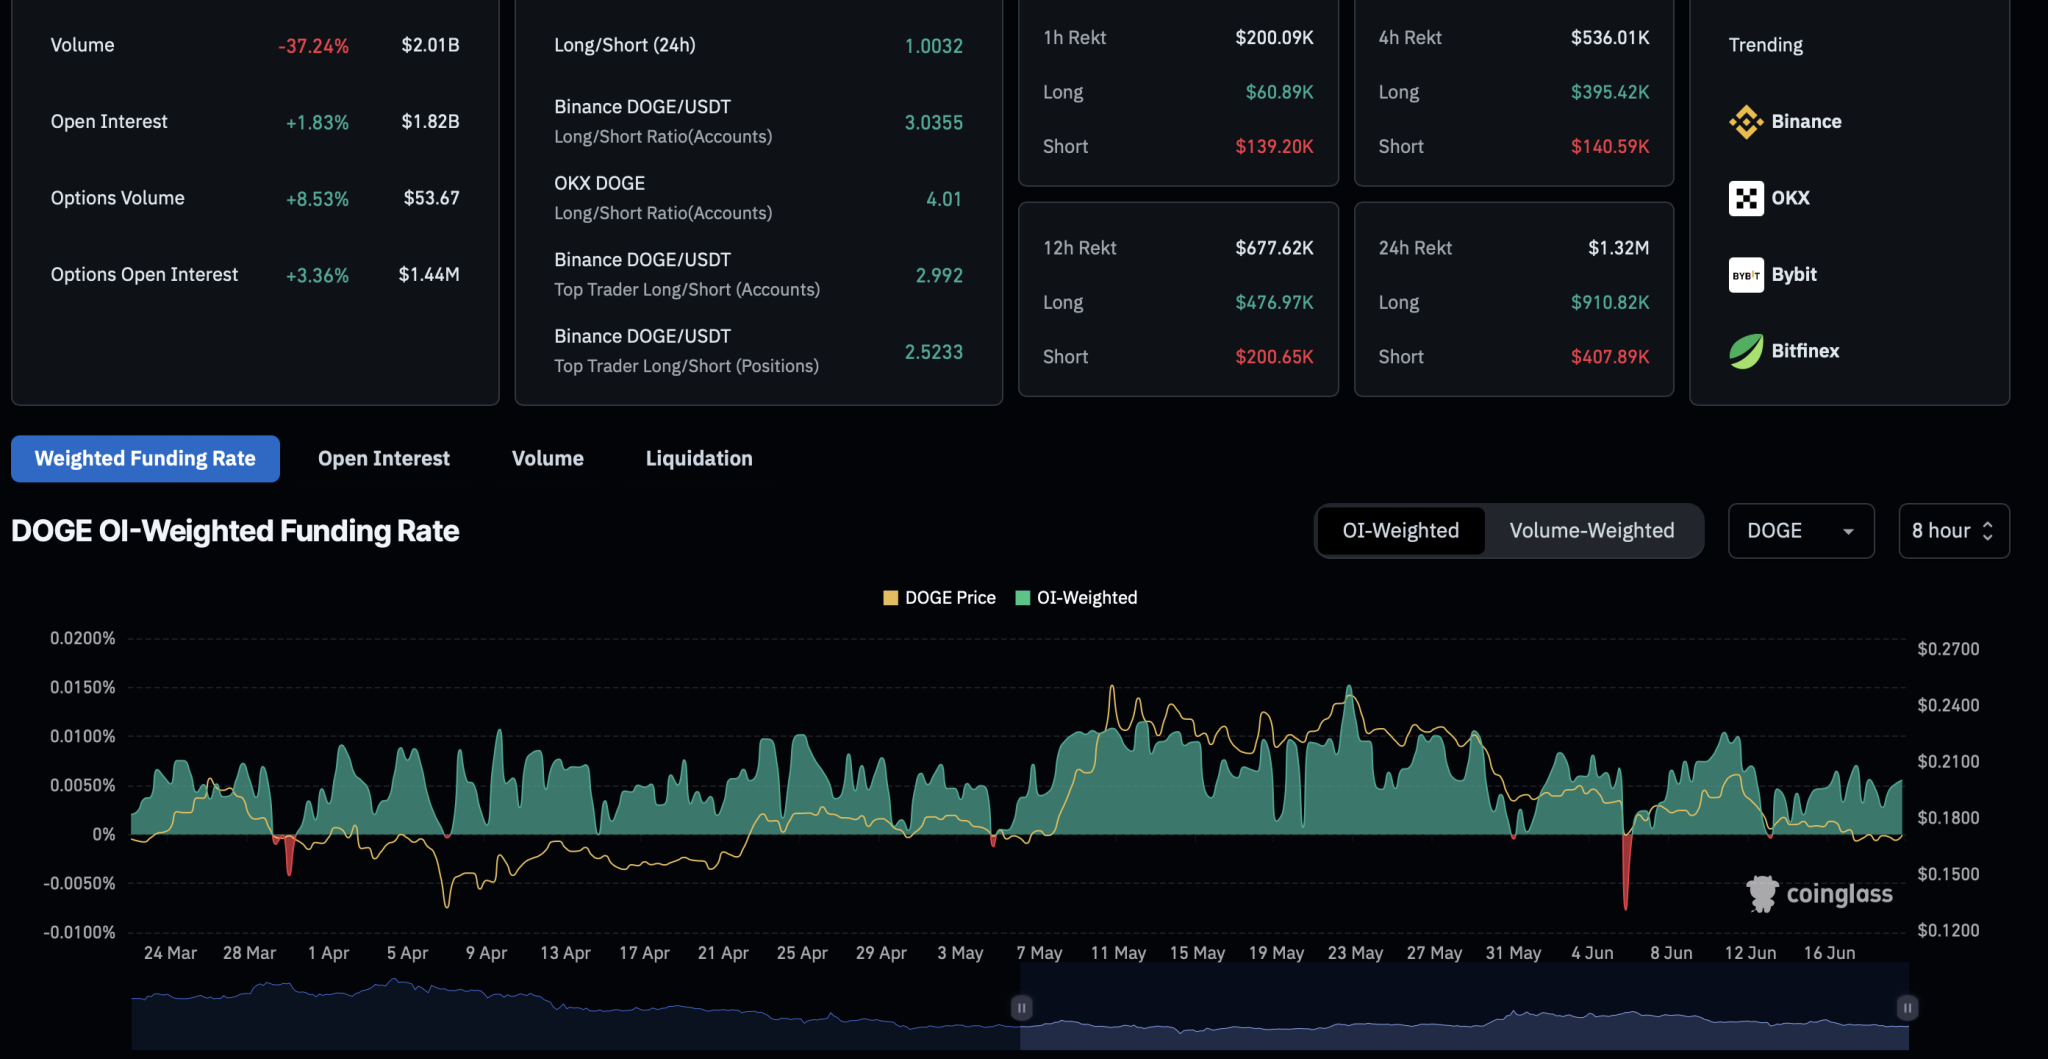
In the derivatives market, optimism around Dogecoin has notably improved as the asset establishes a strong support base. Historical price action suggests a reversal may be imminent, and recent data shows increased buying activity over the past 24 hours.
Coinglass data reveals that open interest has risen 1.83%, reaching $1.82 billion. Additionally, the funding rate has spiked to 0.0055%.

Despite the long/short ratio remaining neutral, long liquidations have nearly doubled those of shorts: $910K vs. $407K. This indicates that traders are leaning toward a bullish outlook.

Dogecoin Derivatives

Ethereum Bullish Foundations Strengthen with 800K–1M New Wallets Created

Ethereum prices hold steady at $2,500 while network growth, whale accumulation, and ETF inflows hint at a bullish breakout.

As the broader crypto market maintains a sideways trend, Ethereum holds ground at $2,500. Despite quiet price movement, the utility and network growth, and increased whale support signal a potential bull run ahead.

Ethereum Network Growth

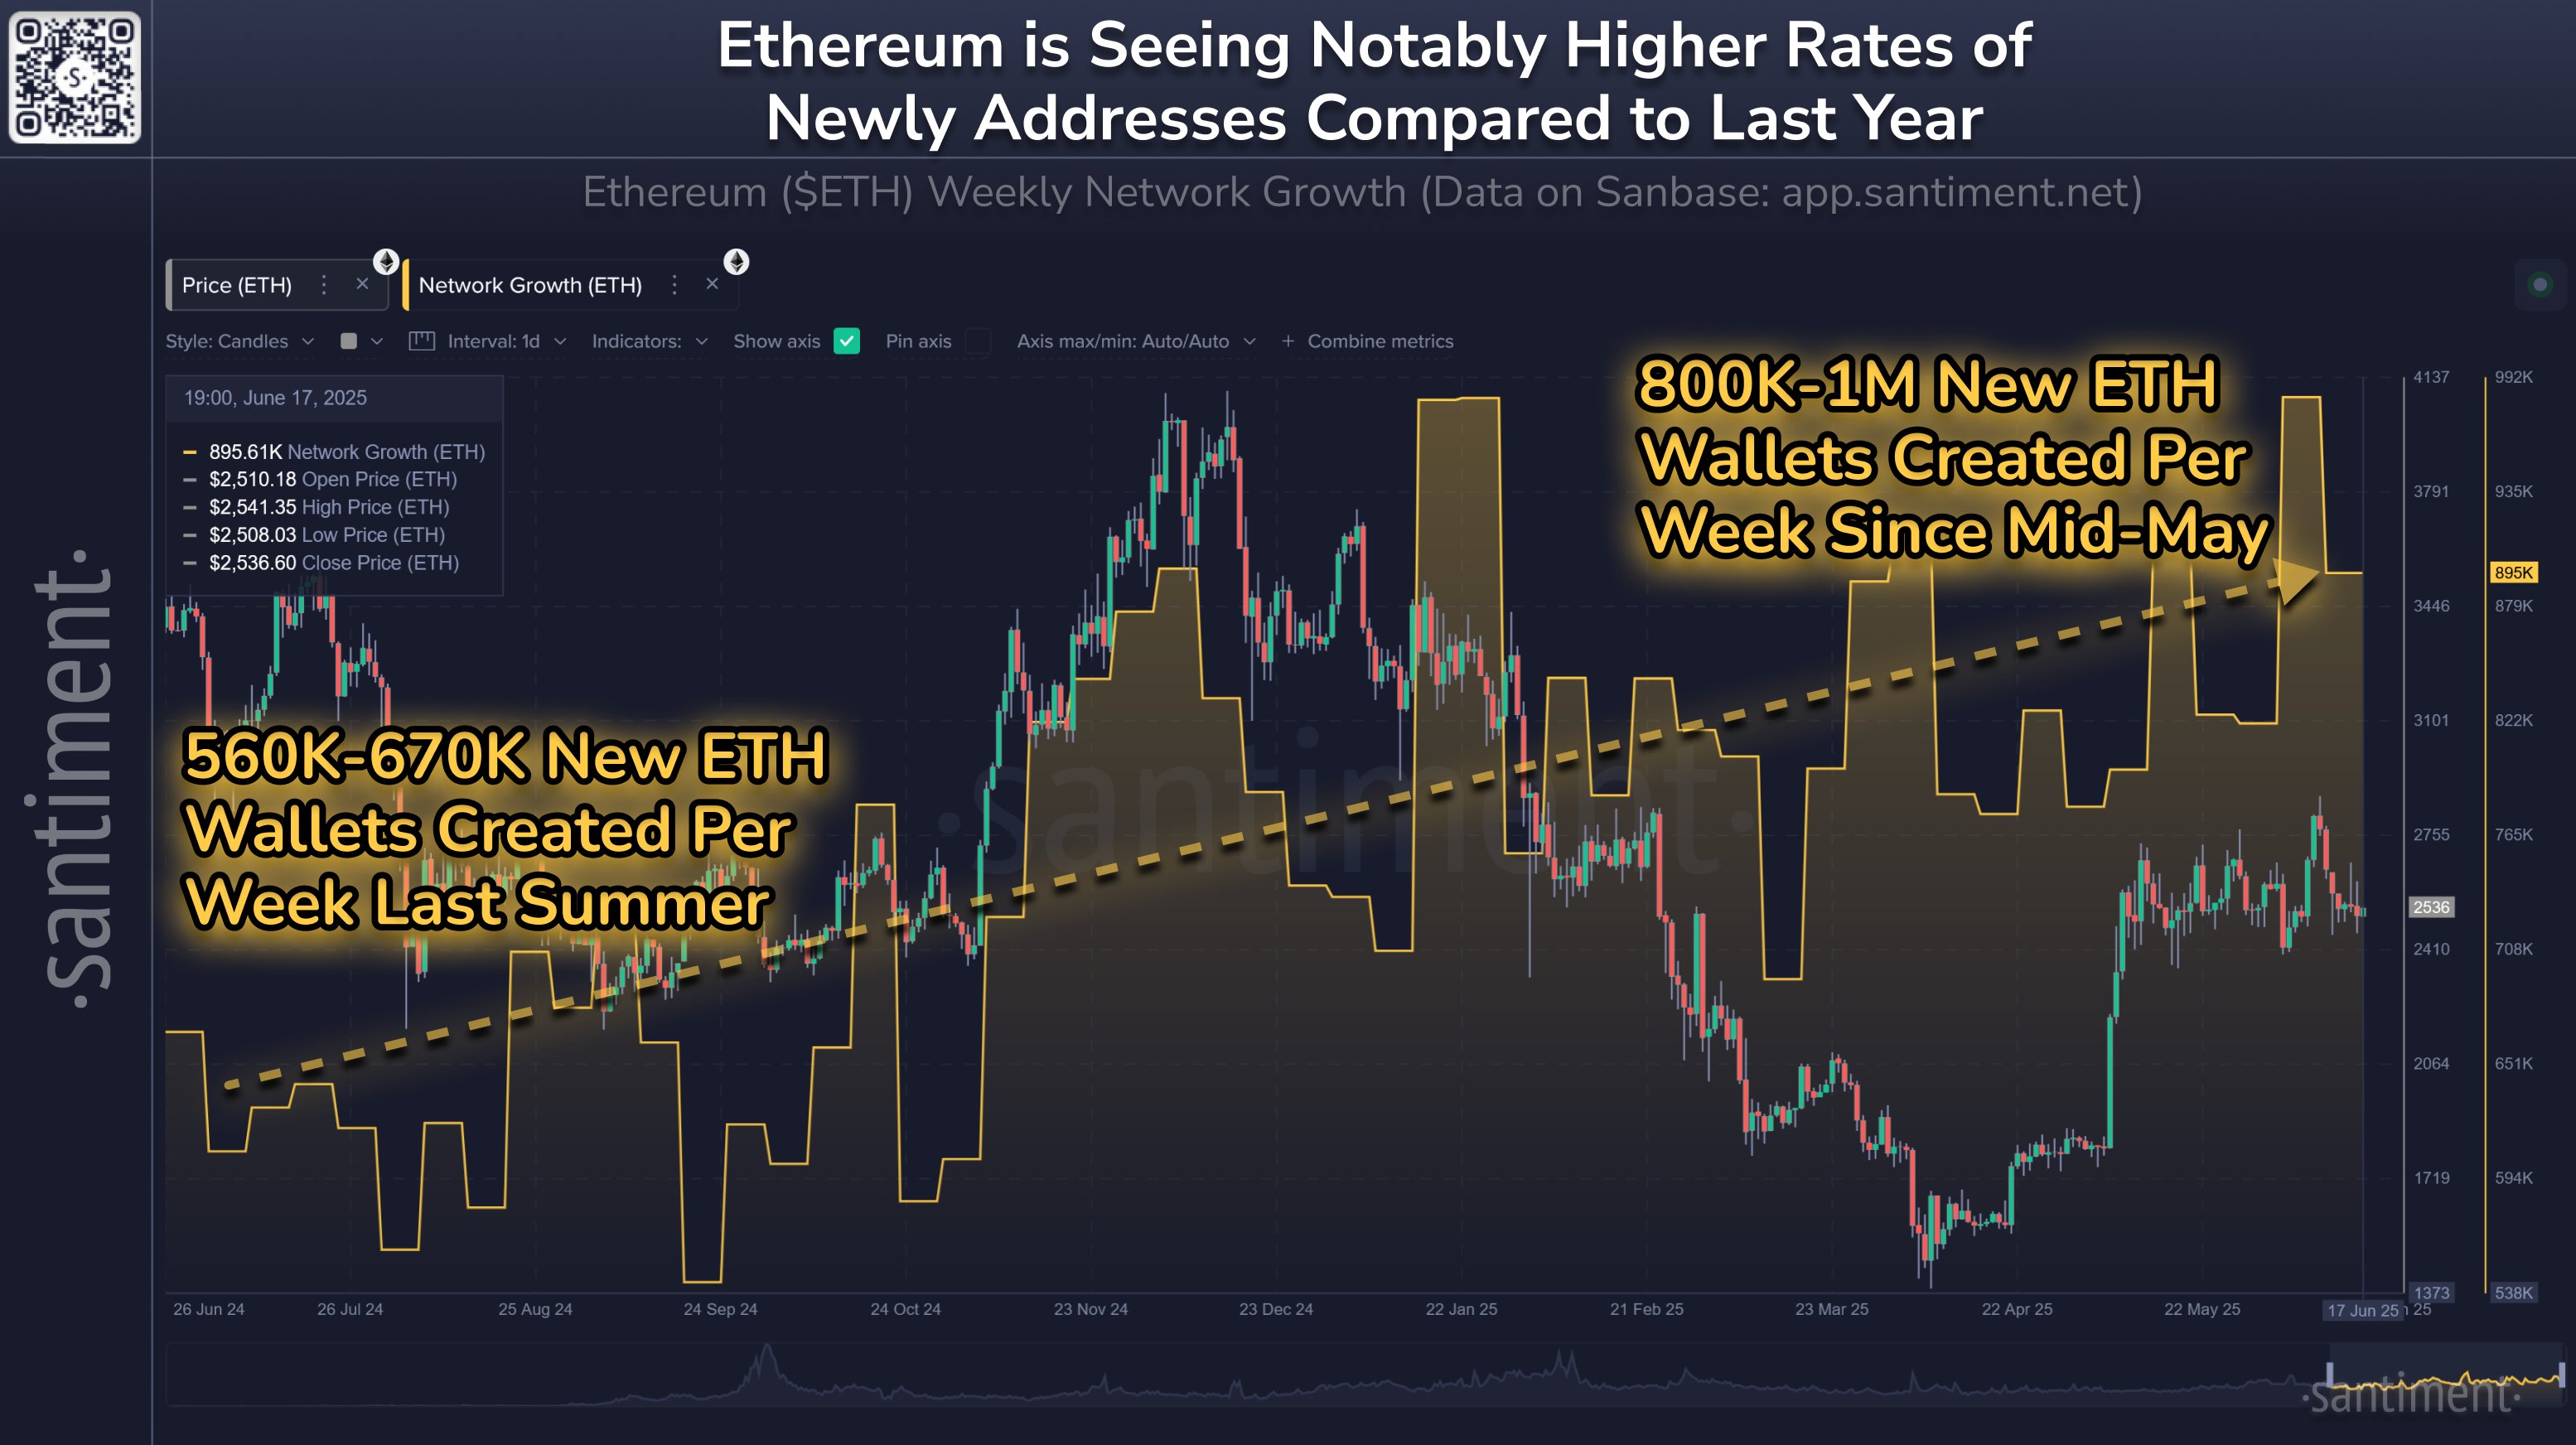
In a recent tweet, Santiment, the on-chain analytics platform, highlighted Ethereum’s increased utility and network growth. The number of new weekly Ethereum addresses created has surged from 560k–670k last summer to 800k–1 million since mid-May. With more addresses being created on Ethereum, the fundamentals flash a bullish sign.

Image

Whales and Institutions Acquire More Ethereum

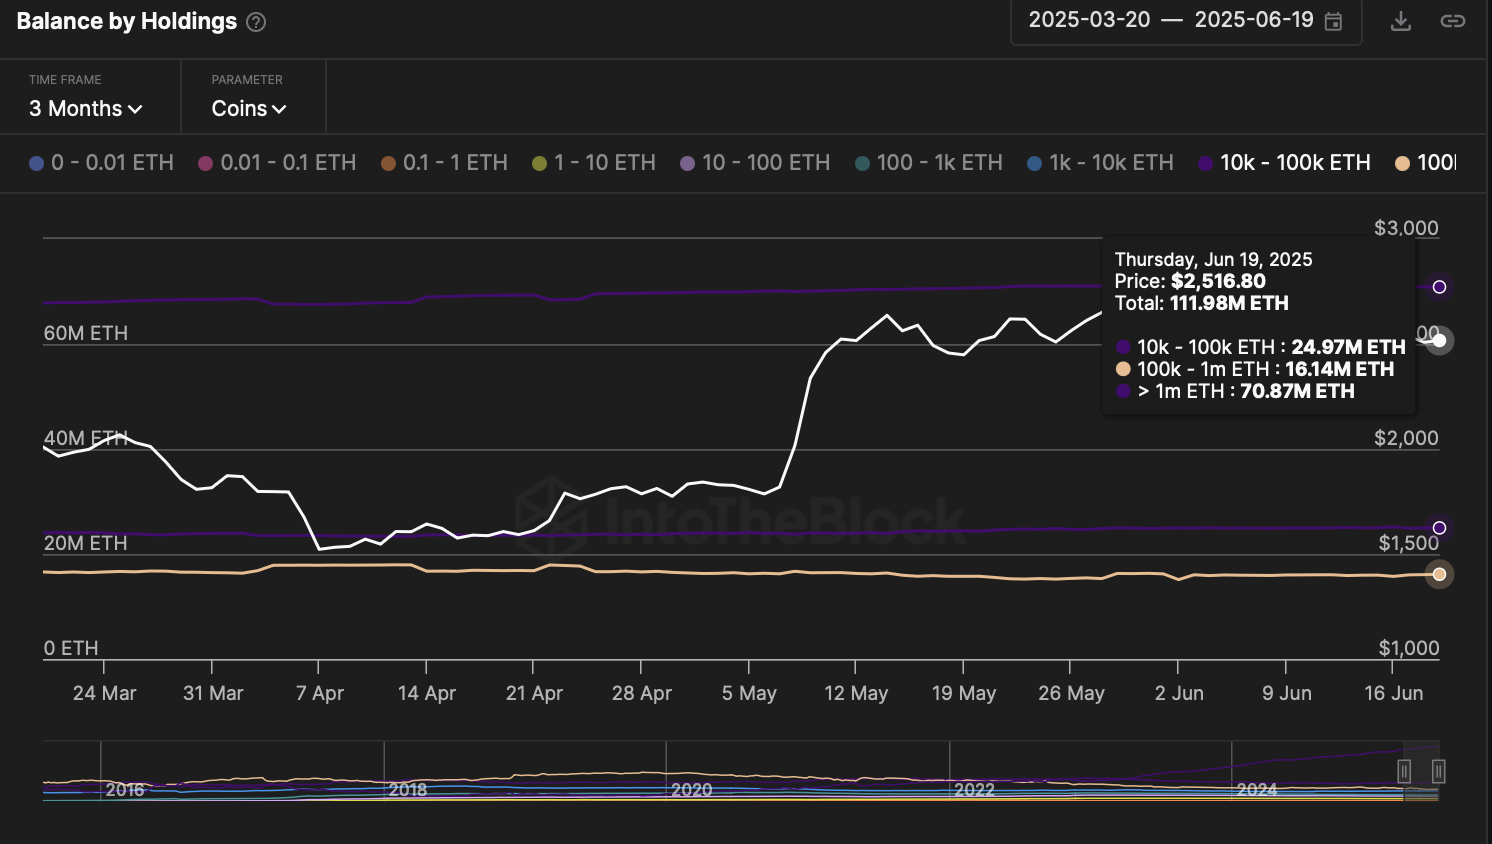
Amid the rising network activity, IntoTheBlock data highlights an increase in holdings by investors with more than 1 million ETH. Over the past three months, their combined portfolio expanded from 67.81 million ETH to 70.87 million ETH.

Remarkably, the collective holdings of investors with more than 10,000 ETH have surged 24 million tokens. With increased confidence from whales, Ethereum is likely to witness a bullish reversal.

Ethereum Balance by Holdings
Ethereum Balance by Holdings | IntoTheBlock

Alongside crypto whales, institutional support is also on the rise for Ethereum. The daily net inflow into U.S. Ethereum spot ETFs on June 18 was $19.10 million. This marks the third consecutive day of inflows after a minor outflow of $2.18 million on June 13.

Overall, the monthly inflow so far totals $860.77 million, raising the total net assets in U.S. Ethereum spot ETFs to $9.94 billion.

Ethereum Derivatives

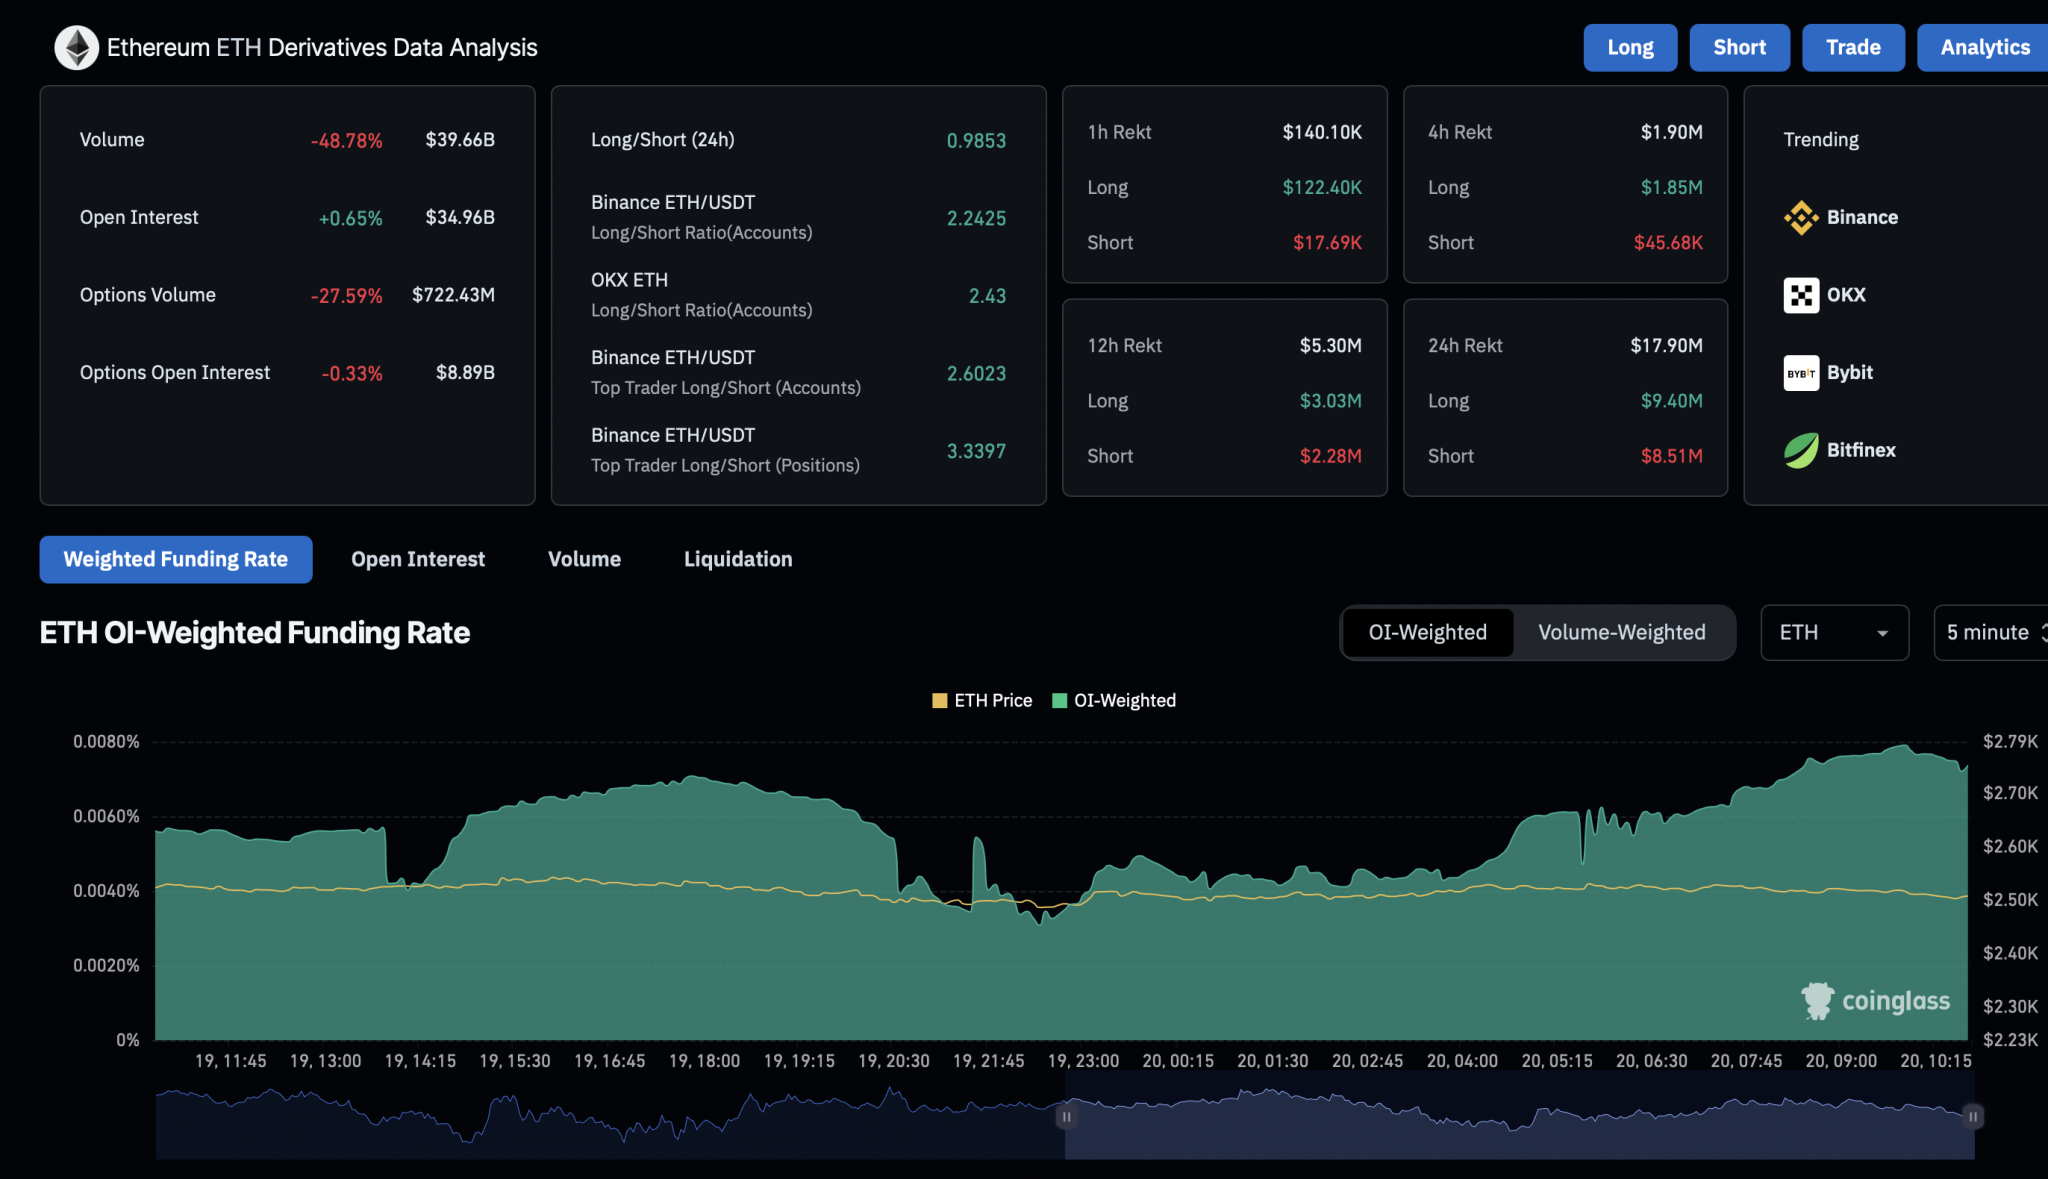
In the derivatives market, optimism remains strong as Coinglass data shows open interest at $34.96 billion, with a minor increase of 0.65%. Over the past 24 hours, liquidations are almost evenly split: long liquidations at $9.4 million and short liquidations at $8.51 million.

However, short positions still marginally outnumber longs, with the long-to-short ratio at 0.9853. Nevertheless, bullish trading activity in Ethereum derivatives continues to grow, with the open interest-weighted funding rate rising to 0.0074%.

Ethereum Derivatives

Ethereum Price Analysis

On the daily chart, Ethereum maintains a sideways trend slightly above $2,500, as noted in our previous analysis. While momentum indicators remain bearish to neutral, lower price rejection in daily candles signals the possibility of a bullish turnaround.

The immediate resistance for Ethereum lies at the 50% Fibonacci retracement level of $2,699. If Ethereum surpasses this level, the uptrend could extend toward the 61.8% Fibonacci level near the $3,000 psychological mark.

On the downside, crucial support remains at $2,395.

Ethereum Price Analysis

Dogecoin Golden Cross Could Cause Massive Move With 200-300% Gains: Details

0

Analyst Tardigrade highlights a forming Golden Cross on the Dogecoin weekly chart, a setup that has preceded major rallies in past cycles.

Dogecoin (DOGE) is trading at $0.17 today, reflecting a 0.16% price dip over the past 24 hours and a 2.77% decline over seven days. While the short-term performance shows a downward trend, technical patterns suggest the possibility of a new bullish phase.

A recent analysis by Tardigrade on X highlights a key development: the formation of a Golden Cross on Dogecoin’s weekly timeframe. Historically, such patterns have preceded major upward price movements for the asset.

Dogecoin Golden Cross Pattern

Tardigrade’s analysis focuses on the interaction between Dogecoin’s 10-week and 20-week simple moving averages (SMAs). The chart shows the 10-week SMA (purple line) nearing a crossover above the 20-week SMA (orange line).

This crossover forms what is known in technical analysis as a golden cross, often interpreted as a sign of potential upward momentum. Notably, two previous golden crosses in DOGE’s recent history resulted in sharp rallies.

Image

The first event took place in November 2023. At that time, DOGE surged from $0.06 to $0.229 by March 2024, yielding a 232.45% gain. The second Golden Cross occurred around October to November 2024. DOGE rose from $0.10 on October 14 to $0.48 by December 2024, a 313.57% increase. 

Potential Outlooks for DOGE

The historical performance following Golden Cross formations suggests possible price targets. If DOGE were to mirror previous rallies, the chart projects a potential increase of 200% to 300%. This would place the next price range between $0.51 and $0.68. 

Ownership Trends Align With Technical Developments

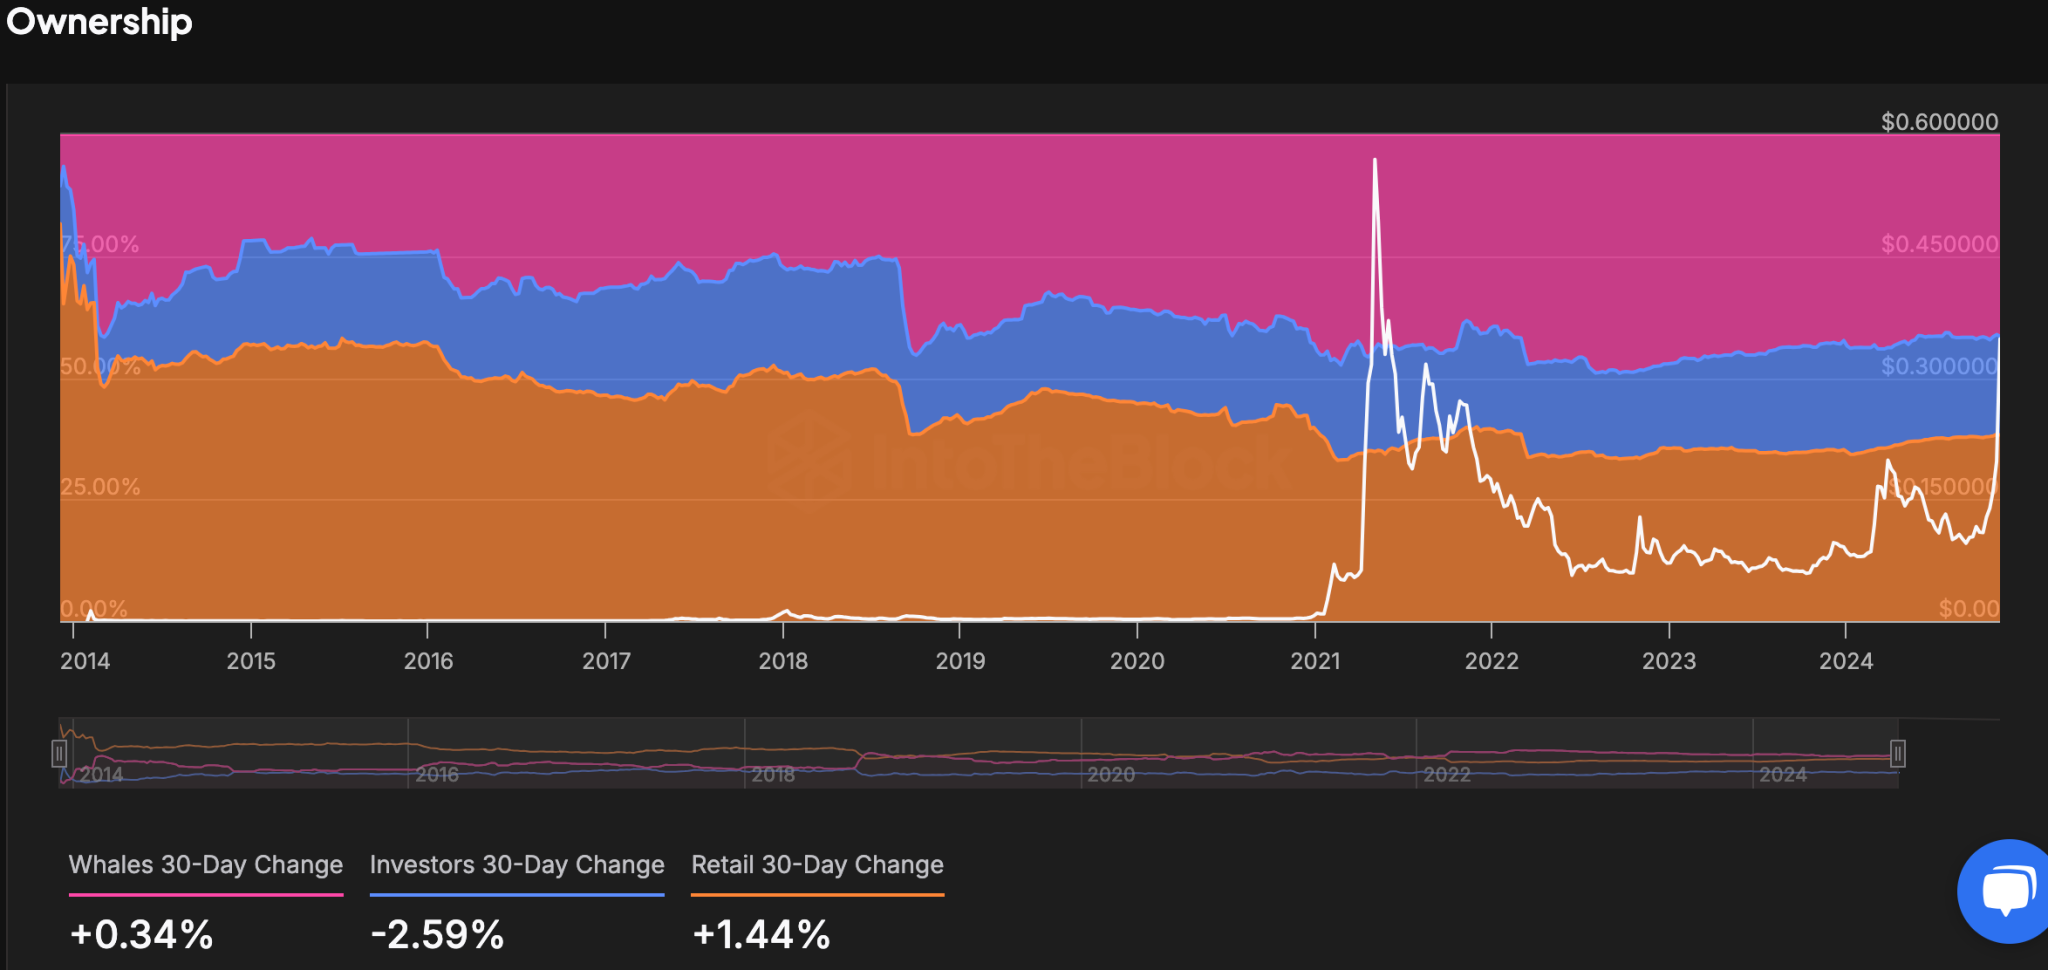
Notable movement in Dogecoin’s ownership distribution supports the chart setup. Retail investor ownership has grown by 1.44% over the past 30 days, suggesting increased interest at the grassroots level. 

Screenshot 2025 06 20T125900008
Dogecoin Historical Concentration

Meanwhile, whale accounts, large holders of DOGE, increased their holdings by 0.34% during the same period.

In contrast, mid-tier investors showed a 2.59% reduction in holdings, indicating redistribution across investor classes. The current distribution data and 30-day trend suggest a renewed bullish momentum for DOGE.

Dogecoin Could Reach $0.60 This Fall Amid Recurring Bullish Pattern: Top Analyst

0

Dogecoin could still have more in the tank, as a recurring price pattern hints at a possible price growth to greater heights this fall.

Dogecoin’s chart appears to be in bad shape compared to Bitcoin’s. While the crypto leader has consolidated between $100,000 and $112,000 in the past five weeks, DOGE is on course for its fifth consecutive weekly loss unless prices turn around before Sunday.

Furthermore, Dogecoin has corrected from its May high of $0.26, nearly relinquishing all of its 35% gain in that month. Nonetheless, investors remain confident that DOGE could still reverse its current bearish situation and target higher prices in the near term.

Four-Year Bullish Cycle Still in Play

Top analyst KrissPax noted in his June 19 X post that the four-year crypto cycle is still in play; hence, it is too early to write off Dogecoin. Remarkably, DOGE, the largest meme coin by market cap, has a history of putting on a show every bull market, rallying over 4,000% and 20,000% in the last two cycles.

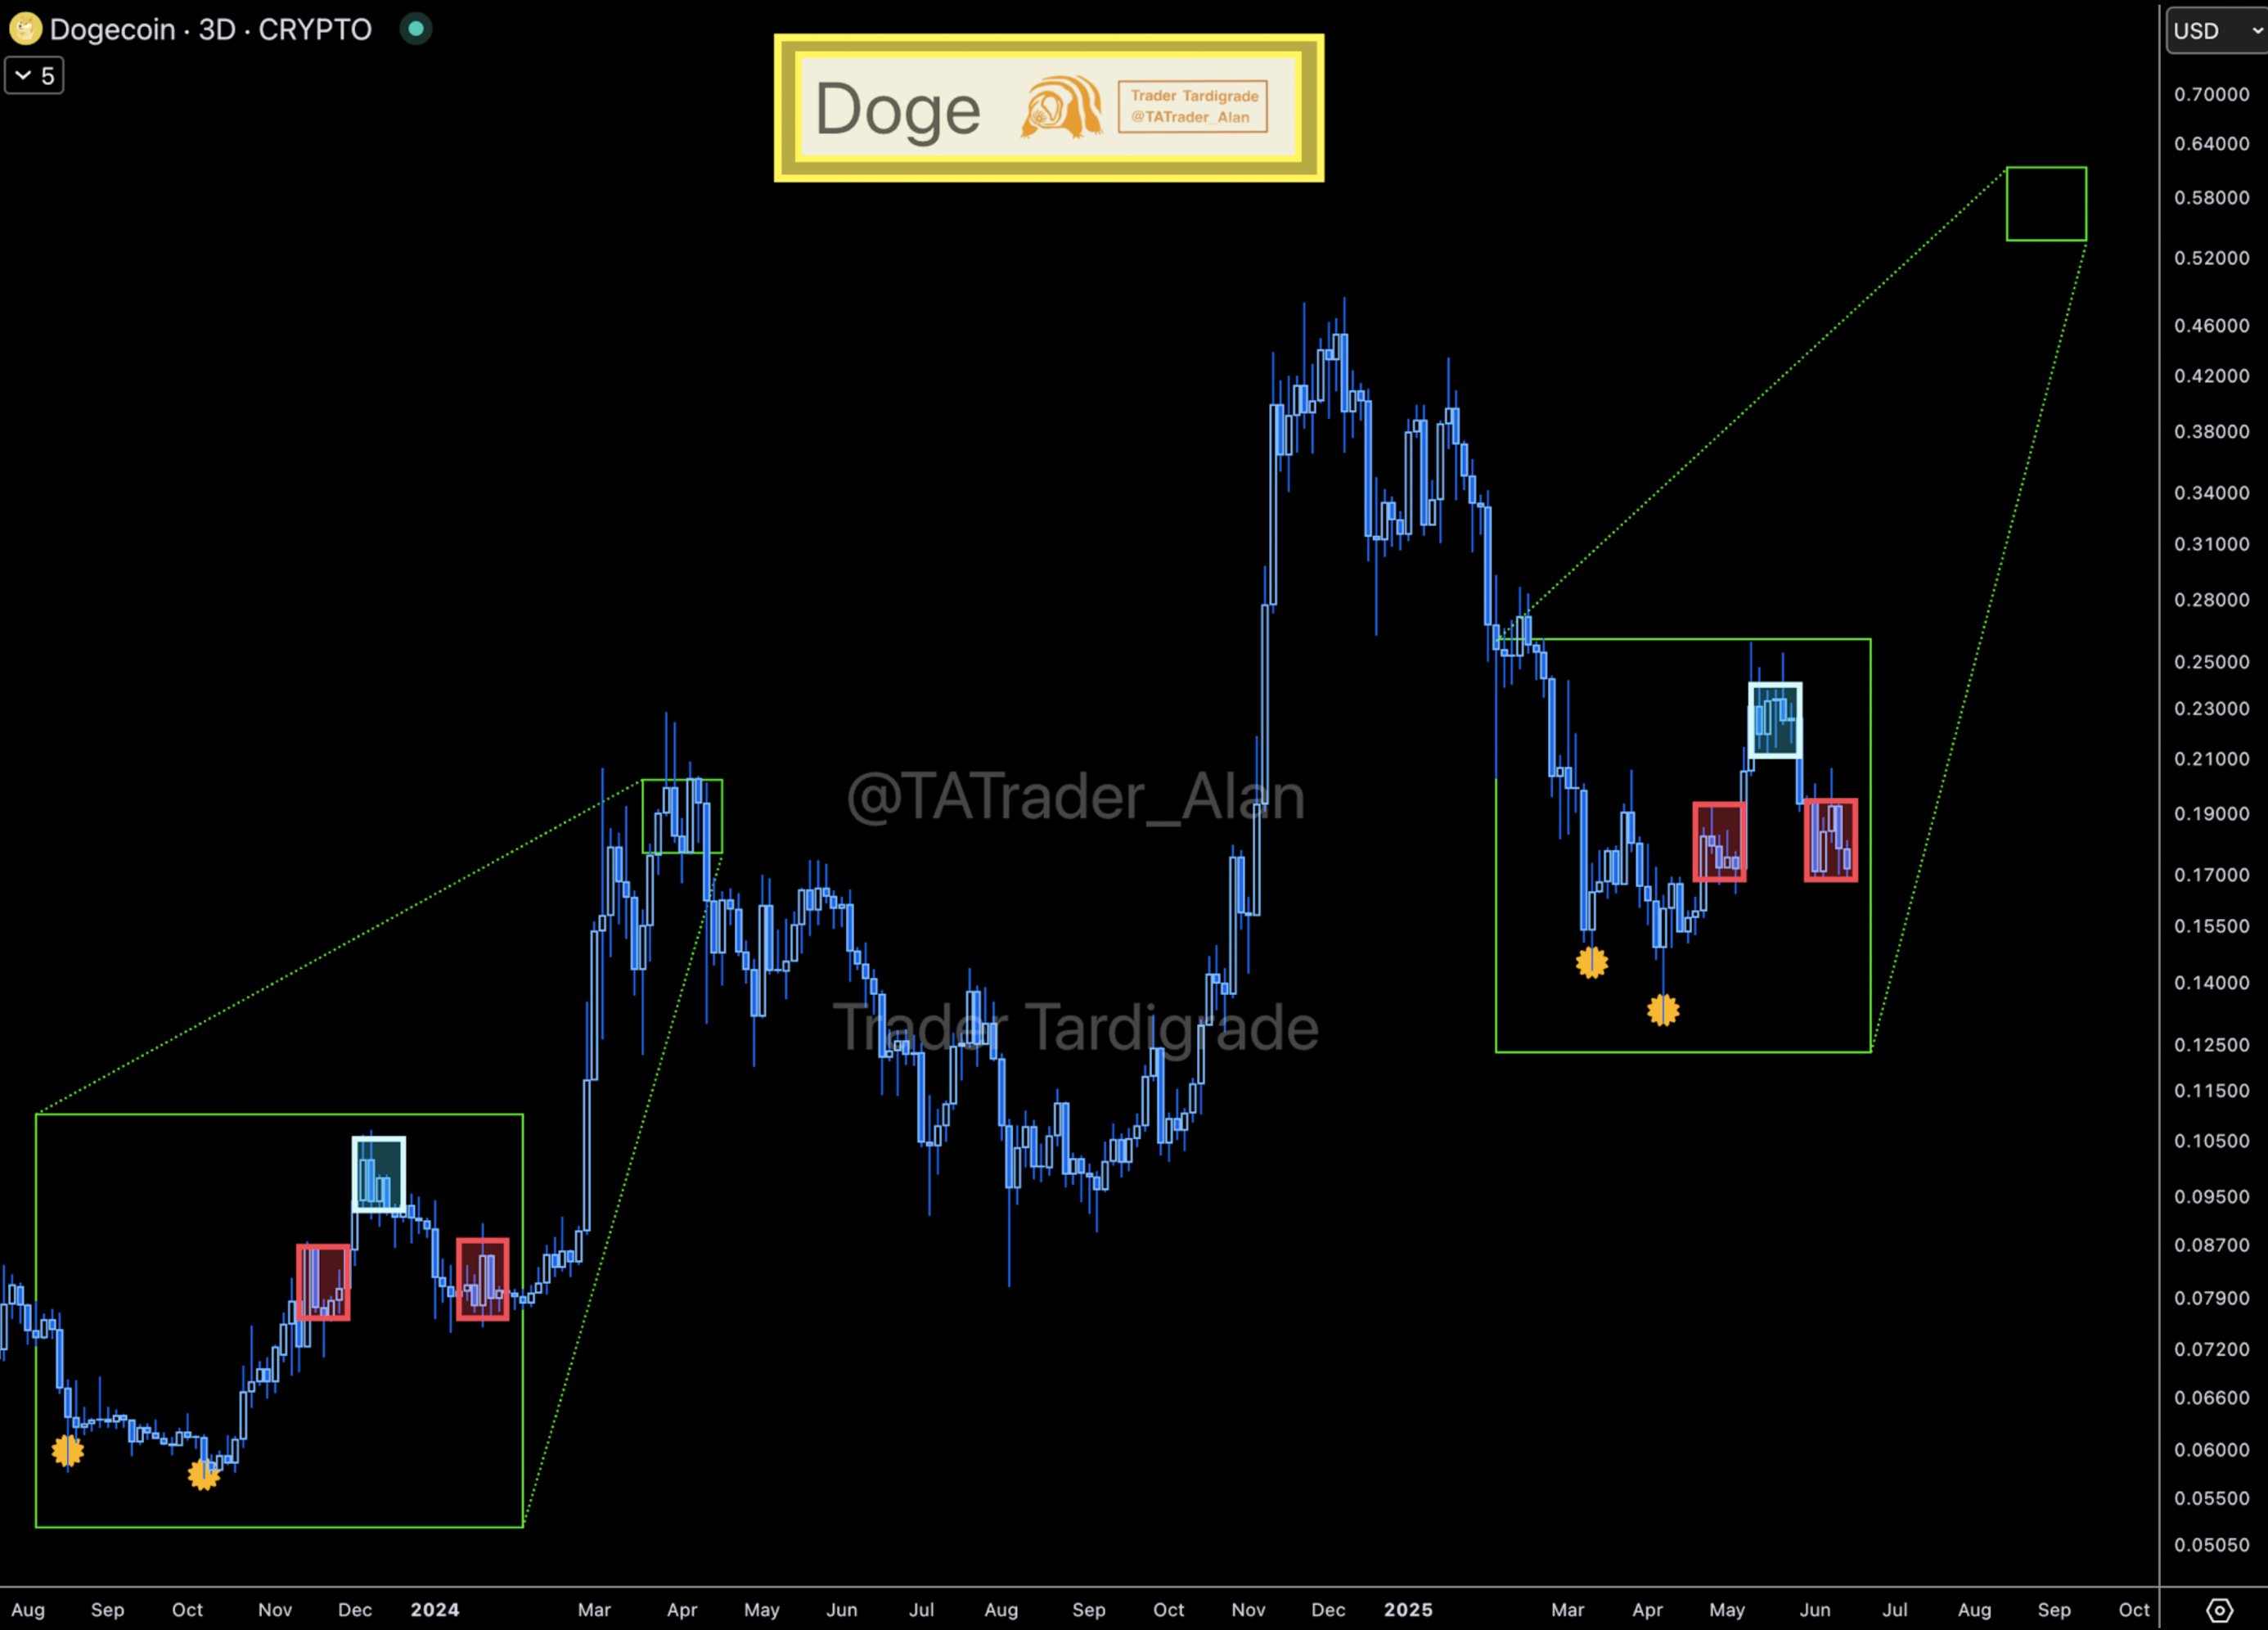
With that in mind, the Thursday commentary identified a price development that resembles another pattern from two years ago. Interestingly, this pattern led to a 303% surge from $0.057 in October 2023 to $0.23 in March 2024.

For context, this pattern involved two sets of price lows, seen in August and October 2023, followed by a pattern where Dogecoin rallies to a high. However, DOGE appreciates and cools off before and after the price high, before experiencing massive growth.

Recurring Pattern Suggests Imminent Rally

Meanwhile, KrissPax has identified a similar pattern formation in Dogecoin’s recent price action. DOGE reached the lows of $0.143 and $0.129 in March and April 2025, aligning with what was seen in August and October 2023.

Now, it has formed a similar pattern, marking an uptick to April’s high of $0.193, then consolidating before a fresh rally to May’s high of $0.260. After the top, DOGE formed a lower high at June 11’s peak of $0.206, mirroring the 2023/2024 price action. As a result, the analyst predicted a similar rally targeting a four-year high of $0.60.

Dogecoin Analysis/KrissPax

Interestingly, he boldly placed a timeline on this 253% uptrend, asserting it would happen this fall. Notably, fall, also known as autumn, is the transitional period between summer and winter, typically beginning in September and lasting until December in the Northern Hemisphere.

Other Bullish Dogecoin Outlook

Moreover, KrissPax is not the first to forecast a rally to $0.60 for Dogecoin. Whalesdesk recently asserted that Dogecoin would attain the price mark, citing a breakout from a descending triangle.

However, some analysts find the $0.60 target conservative for Dogecoin. CryptoELITES recently insisted that Dogecoin is going to $5, arguing that anyone not expecting that price does not “know anything.”

Nonetheless, Dogecoin is trading at a critical juncture, and analyst Ali Martinez suggests that a close below $0.16 would signal bearishness, while a close above $0.22 would ensure a 60% rally. DOGE trades at $0.170 at the time of writing.

2,000 XRP To Make You a Millionaire by 2040? Here’s the Math

0

While today’s market conditions make the dream of becoming an XRP millionaire seem far-fetched, some experts suggest it could still be attainable.

Most XRP investors have bigger ambitions of becoming millionaires in U.S. dollars through the coin. Discussions about becoming XRP millionaires have soared recently, with top experts weighing in on the prospects of achieving this goal. 

Discussions About Becoming XRP Millionaires 

In April, popular crypto YouTuber Austin Hilton shared two strategies to help investors attain millionaire status through XRP investments. 

The first strategy requires investors to understand the cost basis of their XRP investments and gradually increase their token holdings over time. For the second strategy, Hilton emphasized how patience can help investors achieve their goals. 

Last month, Alpha Lions Academy founder Edward Farina speculated that early investors would soon share success stories of how they became millionaires by taking major risks. 

A few weeks ago, popular market commentator Coach JV suggested that Bitcoin’s potential surge to $1 million could significantly impact XRP’s price, helping many investors to attain millionaire status. 

Cost of Acquiring 2,000 XRP 

Despite these bullish projections, it remains uncertain how many XRP tokens investors would need or how long they would need to hold them to reach $1 million. 

Consequently, we considered whether an individual could become a millionaire by holding 2,000 XRP from now until 2040. To put things into perspective, it costs $4,320 to acquire 2,000 XRP at the current price of $2.16 per token. 

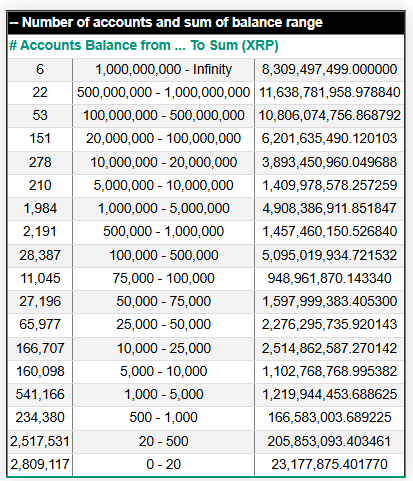
Addresses holding 2,000 XRP fall within the XRP Rich List’s category of accounts containing between 1,000 and 5,000 XRP. The data indicates that 541,166 addresses hold 1,000 to 5,000 XRP, representing 8.25% of XRP’s total on-chain wallets. 

XRP Rich List
XRP Rich List

Moreover, for the 2,000 XRP coins to be worth at least $1 million, XRP’s price must grow significantly from its current level. 

Notably, the price of XRP would need to soar 23,048% from $2.16 to $500. This indicates that your portfolio of 2,000 XRP could make you a millionaire in USD if XRP’s price spikes to $500. 

Can a 2,000 XRP Portfolio be Valued at $1M by 2040? 

The major question remains whether XRP can reach the ambitious target of $500 by 2040, turning 2,000 tokens worth approximately $4,320 today into a $1 million stake.

While cryptos have demonstrated that anything is possible, the current market conditions position the $500 price as an unrealistic target for XRP. Assuming XRP reaches the $500 target and its circulating supply of approximately 59 billion tokens remains unchanged, its market cap would skyrocket to roughly $29.5 trillion. 

This estimated valuation far exceeds the global crypto market cap of $3.27 trillion, as well as that of precious metal gold, which stands at $23.18 trillion. 

XRP’s 2040 Price Prediction 

Nonetheless, several entities still believe that XRP will surpass the $500 target by 2040, with some predicting a significant surge above the $1,000 region. 

In a previous analysis, the Crypto Basic consulted AI models Grok and Gemini to ascertain their XRP price forecasts for 2040. Notably, Grok suggested that XRP’s price could soar between $1,160 and $1,450 over the next 15 years, surpassing the $500 threshold required for a 2,000 XRP holding to reach $1 million. 

On the other hand, Gemini AI chatbot forecasted that XRP’s price could range between $76 and $1,868 by 2040, driven by a positive regulatory environment, global acceptance of the token, and favorable market conditions. 

If XRP claims Gemini’s maximum price target of $1,868, a portfolio of 2,000 tokens could be worth $3.73 million, cementing investors’ millionaire status. 

Moreover, analysts at crypto trading platform Changelly speculate that XRP’s price would range from $647 to $810 by 2040. At Changelly’s 2040 minimum target price of $647, a blockchain wallet with 2,000 XRP coins would be worth $1.29 million. Similarly, the maximum price forecast of $810 would propel the valuation to $1.62 million. 

While most analysts believe XRP might hit $500 by 2040, others do not think the coin would hit such an ambitious target. For instance, Telegaon prediction platform suggests that XRP would clinch a minimum target of $119 by 2040, with its price soaring to an all-time high of $160 later that year. 

It is worth noting that Telegaon’s 2040 prediction for XRP has been hovering around the $100 mark, as highlighted in our previous analyses. At Telegaon’s maximum target of $160, a portfolio of 2,000 XRP would be valued at $320,000, which is $680,000 away from making investors millionaires. 

GENIUS Act Further Positions Ripple to Offer Cross-Border Payment Services to US Firms Using XRP and RLUSD

As the GENIUS Act advances out of the Senate, discussions intensify about how this landmark stablecoin legislation could benefit Ripple, XRP, and the company’s RLUSD stablecoin.

Earlier this week, the U.S. Senate passed the GENIUS Act in a bipartisan vote. The move establishes a comprehensive federal framework to regulate U.S. dollar–denominated stablecoins.

The legislation encourages digital payment innovation by providing regulatory clarity for major stablecoin issuers such as Ripple, Circle, and Tether. Moreover, the Act aims to modernize domestic and international payment systems and reinforce the global dominance of the U.S. dollar.

Ripple Offering RLUSD Payments to U.S. Financial Firms

Notably, Ripple entered the stablecoin market in 2024 with the launch of RLUSD, which has quickly grown to a market cap of $415 million. This move has positioned Ripple as a major player in the regulated digital finance sector.

State-level approvals in New York and Texas have further paved the way for Ripple to offer compliant cross-border payment services to U.S. financial institutions using XRP and RLUSD.

A June 19 post on X by XRP community researcher “SMQKED” highlighted Ripple’s state-level regulatory green lights. The company holds over 50 money transmitter licenses (MTLs) across various states. These licenses legally enable Ripple to offer cross-border payment services to U.S. financial institutions using XRP and RLUSD.

The recently passed GENIUS Act now complements Ripple’s broader mission in the financial market.

More Details on How the GENIUS Act Benefits Ripple, RLUSD, and XRP

XRP community pundits have expressed various hypotheses about how the GENIUS Act could boost institutional adoption of Ripple’s RLUSD and solidify XRP’s status as a regulated utility token.

In a post on X, SMQKED explained that RLUSD meets the key requirements of the incoming stablecoin regulation, including transparent reserves and regular audits. RLUSD is backed 1:1 by USD deposits and short-term government bonds, with monthly third-party attestations ensuring transparency.

The commentator argued that as RLUSD gains institutional traction, demand for XRP will rise. Since XRP is used for transaction fees on the XRP Ledger—where RLUSD operates—these fees are burned, potentially reducing XRP’s supply.

SMQKED also suggested that the GENIUS Act better positions RLUSD and XRP to compete with central bank digital currencies (CBDCs) under a clear regulatory framework.

Interestingly, some ambitious XRP advocates, like Chad Steingraber, believe the GENIUS stablecoin bill could be the catalyst that propels XRP to his long-held $250 price target.

At the moment, the bill has now moved to the House of Representatives for further review. President Donald Trump has urged them to pass it without delay to secure U.S. leadership in the space.

Over 940K Shiba Inu Addresses Incur Losses as SHIB Continues to Dip

0

Shiba Inu is currently facing a significant hurdle that could result in further price decline. 

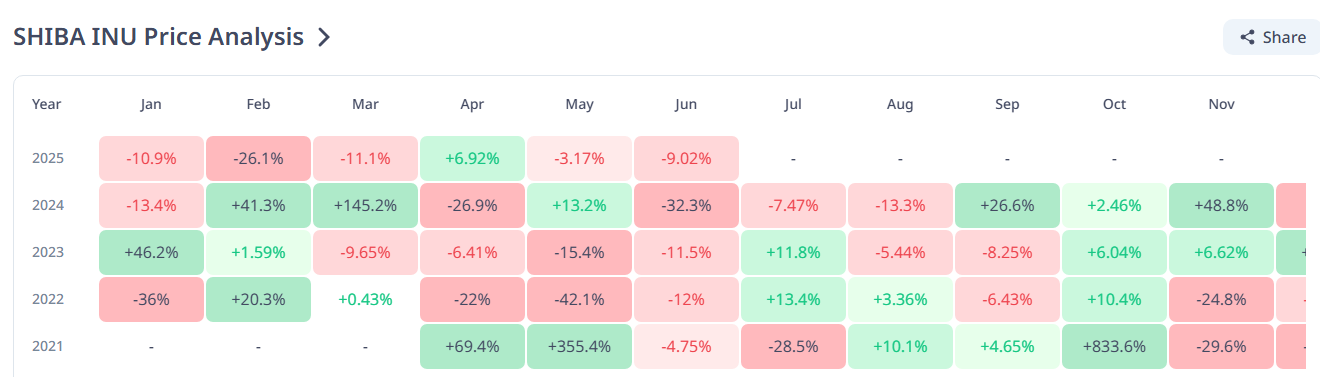
June 2025 has remained bearish for Shiba Inu, with its price declining 9.02% month-to-date (MTD). This decline might not surprise early investors as June has historically been a bearish month for SHIB. 

For context, SHIB recorded a loss of 4.75% in June 2021, followed by 12% and 11.5% declines in 2022 and 2023, respectively. Shiba Inu continued the downturn in the subsequent year, plunging about 32.3% by 2024. 

While many investors expected this month to be different due to the anticipation of the 2025 bull run, SHIB is experiencing a nearly 10% MTD decline. 

Shiba Inu Historical performance
Shiba Inu Historical Performance Chart

Most Investors Incur Losses 

Currently, SHIB is trading at $0.00001156, representing a 22.12% decline over the past month. The token has plummeted by 0.36% in the past day and 1.36% over the past week. 

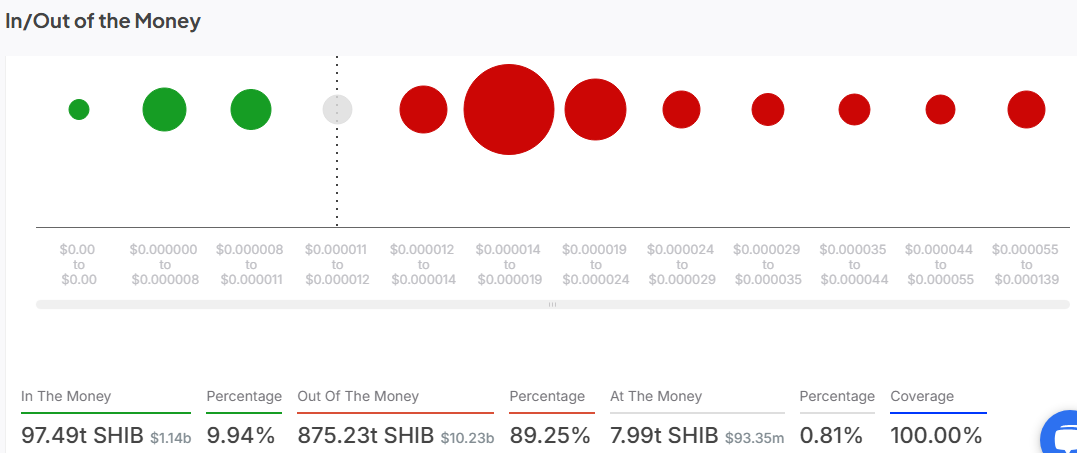
The recent downturn has impacted investors’ portfolios, with most individuals experiencing losses at the current price. According to IntoTheBlock’s In/Out of the Money chart, only a handful of Shiba Inu holders are currently experiencing investment gains. 

The data suggests that 462,750 addresses are profitable, with a cumulative holding of 97.49 trillion SHIB tokens. In contrast, around 940,450 addresses holding a combined 875.23 trillion SHIB are currently in losses. 

Additionally, only 45,340 addresses are currently breakeven, meaning they are neither in profit nor loss at the current price. Notably, the metric also comprises tokens held in Shiba Inu’s burn addresses. 

IntoTheBlock In and Out of the Money metric for SHIB

Strong Resistance Ahead for Shiba Inu 

While investors hope Shiba Inu recovers its lackluster performance, the asset faces major resistance. The coin’s immediate resistance zone lies within the $0.000012 to $0.000014 price range, where around 100,379 addresses hold 75.47 trillion SHIB.

While this supply zone might be easier to overcome, the next resistance could pose a significant challenge for Shiba Inu. 

The next resistance level is around the $0.000014 to $0.000016 price region, where about 177,210 addresses hold 527.83 trillion SHIB tokens.  

On the other hand, the next available support for SHIB is situated in the $0.000008 to $0.000011 price mark, where 210,070 addresses acquired 43.17 trillion tokens.

If bears breach this support, the next available support lies around the $0.000007 price mark, where 53.22 trillion SHIB tokens are held across 190,200 addresses. 

In the meantime, investors remain confident in Shiba Inu, with most holding the token for the long term in anticipation of a price surge.

IntoTheBlock data shows that 1.13 million addresses have held 782.86 trillion SHIB tokens for over a year. In comparison, 284,300 addresses hold 174.71 trillion tokens between one and twelve months. 

Analyst Says Cardano May Retest Broadening Wedge Channel Low Before Targeting $2.40

0

Analyst highlights a potential Cardano pullback to key support within a broadening channel before a continuation of the upward movement.

Notably, Cardano is trading at $0.6042 today, reflecting a minor 0.32% increase on the day, but a 5.56% decline this week. Meanwhile, chart patterns and indicators shared by market technician Bitcoinsensus point to an upcoming breakout. 

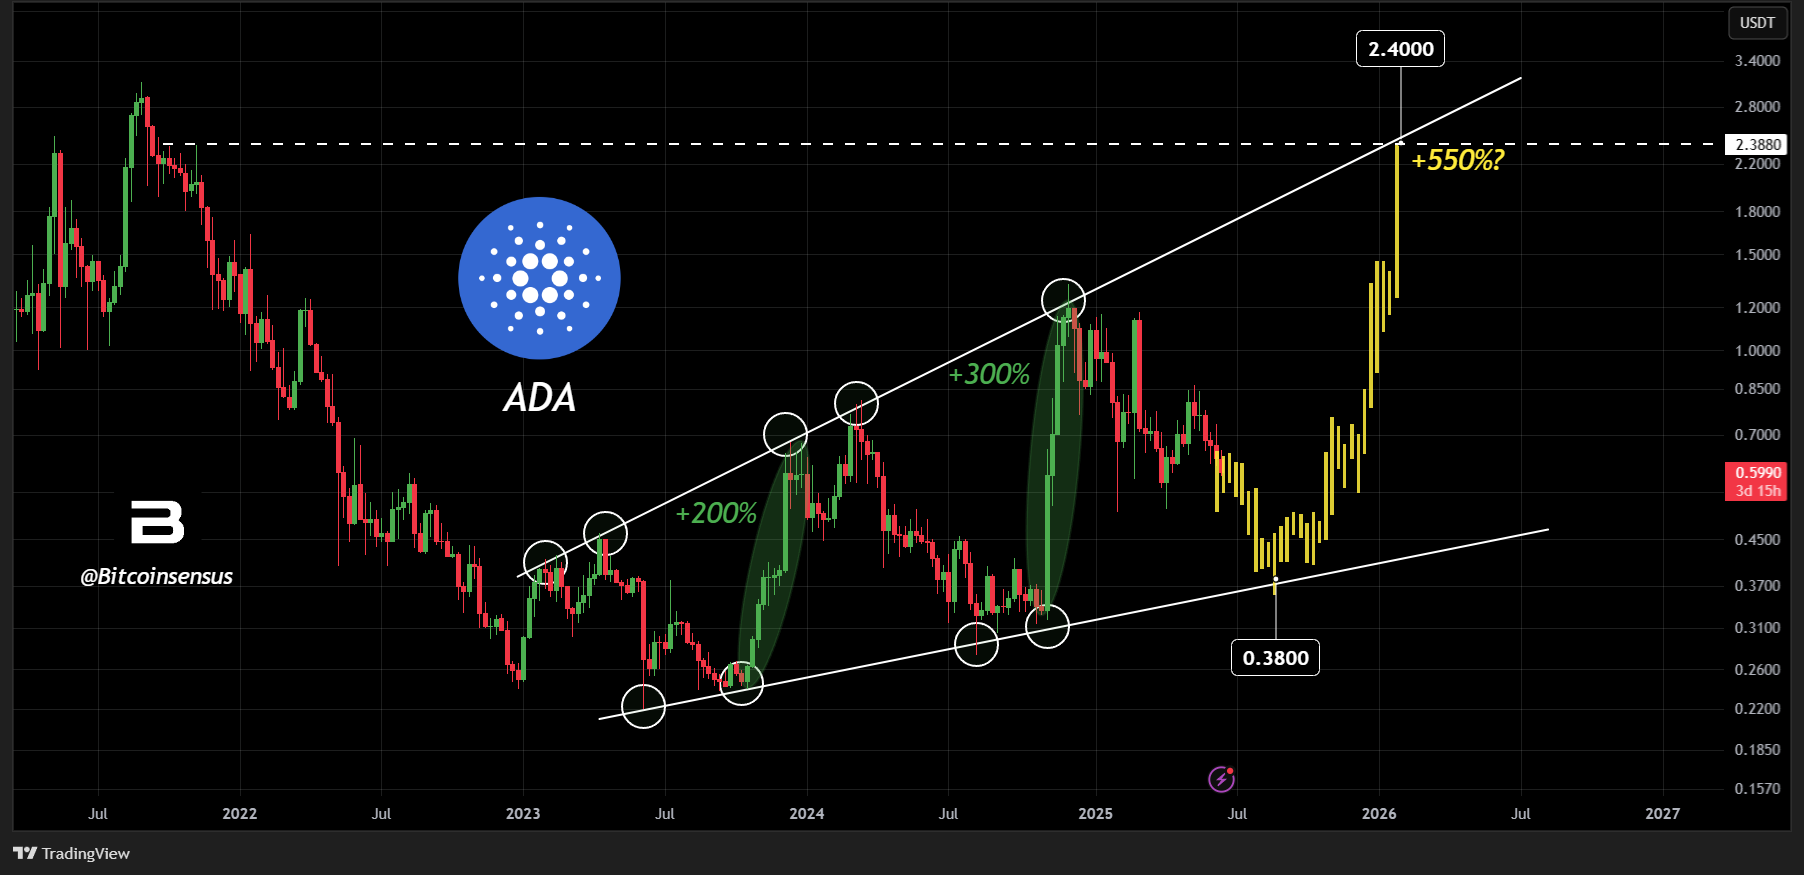
A recent technical analysis by Bitcoinsensus highlights a potential bullish breakout for Cardano. The outlook centers on a long-term ascending broadening wedge pattern. According to the analyst, the price action within this formation continues to reflect strong structural support, even after multiple retracements. Key rallies and pullbacks have consistently aligned with the wedge’s boundaries, building a case for a larger move in the near term.

Image

First and Second Rallies Define the Wedge Pattern

The structure first gained significance after ADA’s price bounced from the wedge’s lower boundary. Before that, two rejections occurred at the upper trendline. The first rejection came near $0.41 in early February 2023. A second rejection followed at approximately $0.45 on April 16, 2023. Following those tops, Cardano retraced, but the lower boundary offered a reliable defense.

In mid-October 2023, ADA reached a low of around $0.24. Then again, in the latter part of November of that year, the price touched $0.35. In both cases, the lower trendline remained intact, preventing further declines. After this double bottom, a notable 200% price surge took ADA to around $0.66 by mid-December 2023.

Subsequently, ADA formed another top at $0.77 in March 2024. However, the pattern remained intact as the price reversed again, dropping to around $0.27. The analyst notes that this level marked another successful test of the wedge’s lower limit. This move paved the way for the second major rally within the formation.

300% Advance Confirms Structural Strength

The following surge drove Cardano up by 300%, culminating in a price of $1.32 on December 7, 2024 amid the latest market-wide rally from Q4 2024 to Q1 2025. This movement occurred directly after the third major test of the lower wedge boundary. The consistent reaction to these technical zones supports the broader pattern’s validity.

Throughout this period, the analyst maintained focus on how each rally and retracement stayed within the wedge’s defined trendlines. These repeated moves underscored the relevance of the pattern in guiding price action. Additionally, the sequence of rallies appeared to gain in size, from +200% to +300%, strengthening the wedge’s bullish bias, according to the data reviewed.

Next Support Retest and Potential Upside Target

Following the second rally’s peak at $1.32, Cardano faced a pullback, which has persisted until now. The analysis expects the pullback to continue until Cardano drops to the lower wedge boundary near $0.38. This expected drop would mark yet another support test, consistent with previous price behavior inside the pattern.

After that potential retest, the projection points to a long-term upside target of $2.40. This represents a 550% increase from the estimated support level.

Further Signs of Bullish Potential

Elsewhere, analytical account Rose Premium Signals previously identified a potential triple-bottom formation on Cardano’s chart, signaling a possible bullish reversal if key support holds. 

In addition, a falling wedge pattern has emerged, with price failing to breach the upper trendline at $1.30 on December 2 and $1.17 on March 3. If ADA breaks above the wedge, key upside targets include $1.0057, $1.2114, and $1.4329.

Bitcoin Whales Accumulate While Retail Sells: Here’s What It Means for Prices

0

The number of Bitcoin whale wallets has been on the rise in the past ten days, with a converse scenario seen among retailers, a historical bullish indicator.

Market intelligence platform Santiment highlighted this diverging market sentiment in a tweet on Thursday, as Bitcoin continues to hover around $105,000. Bitcoin started the week on a positive note, rallying to $109,000, but has quickly reversed, with current corrective momentum pushing prices to $103,402 at some point.

Whales and Retailers Share Diverging Sentiments

Meanwhile, Santiment identified that large and small Bitcoin holders are handling the recent dip differently. One group is buying more, and the other is paper-handing their BTC stash, but both hint at the market’s next move.

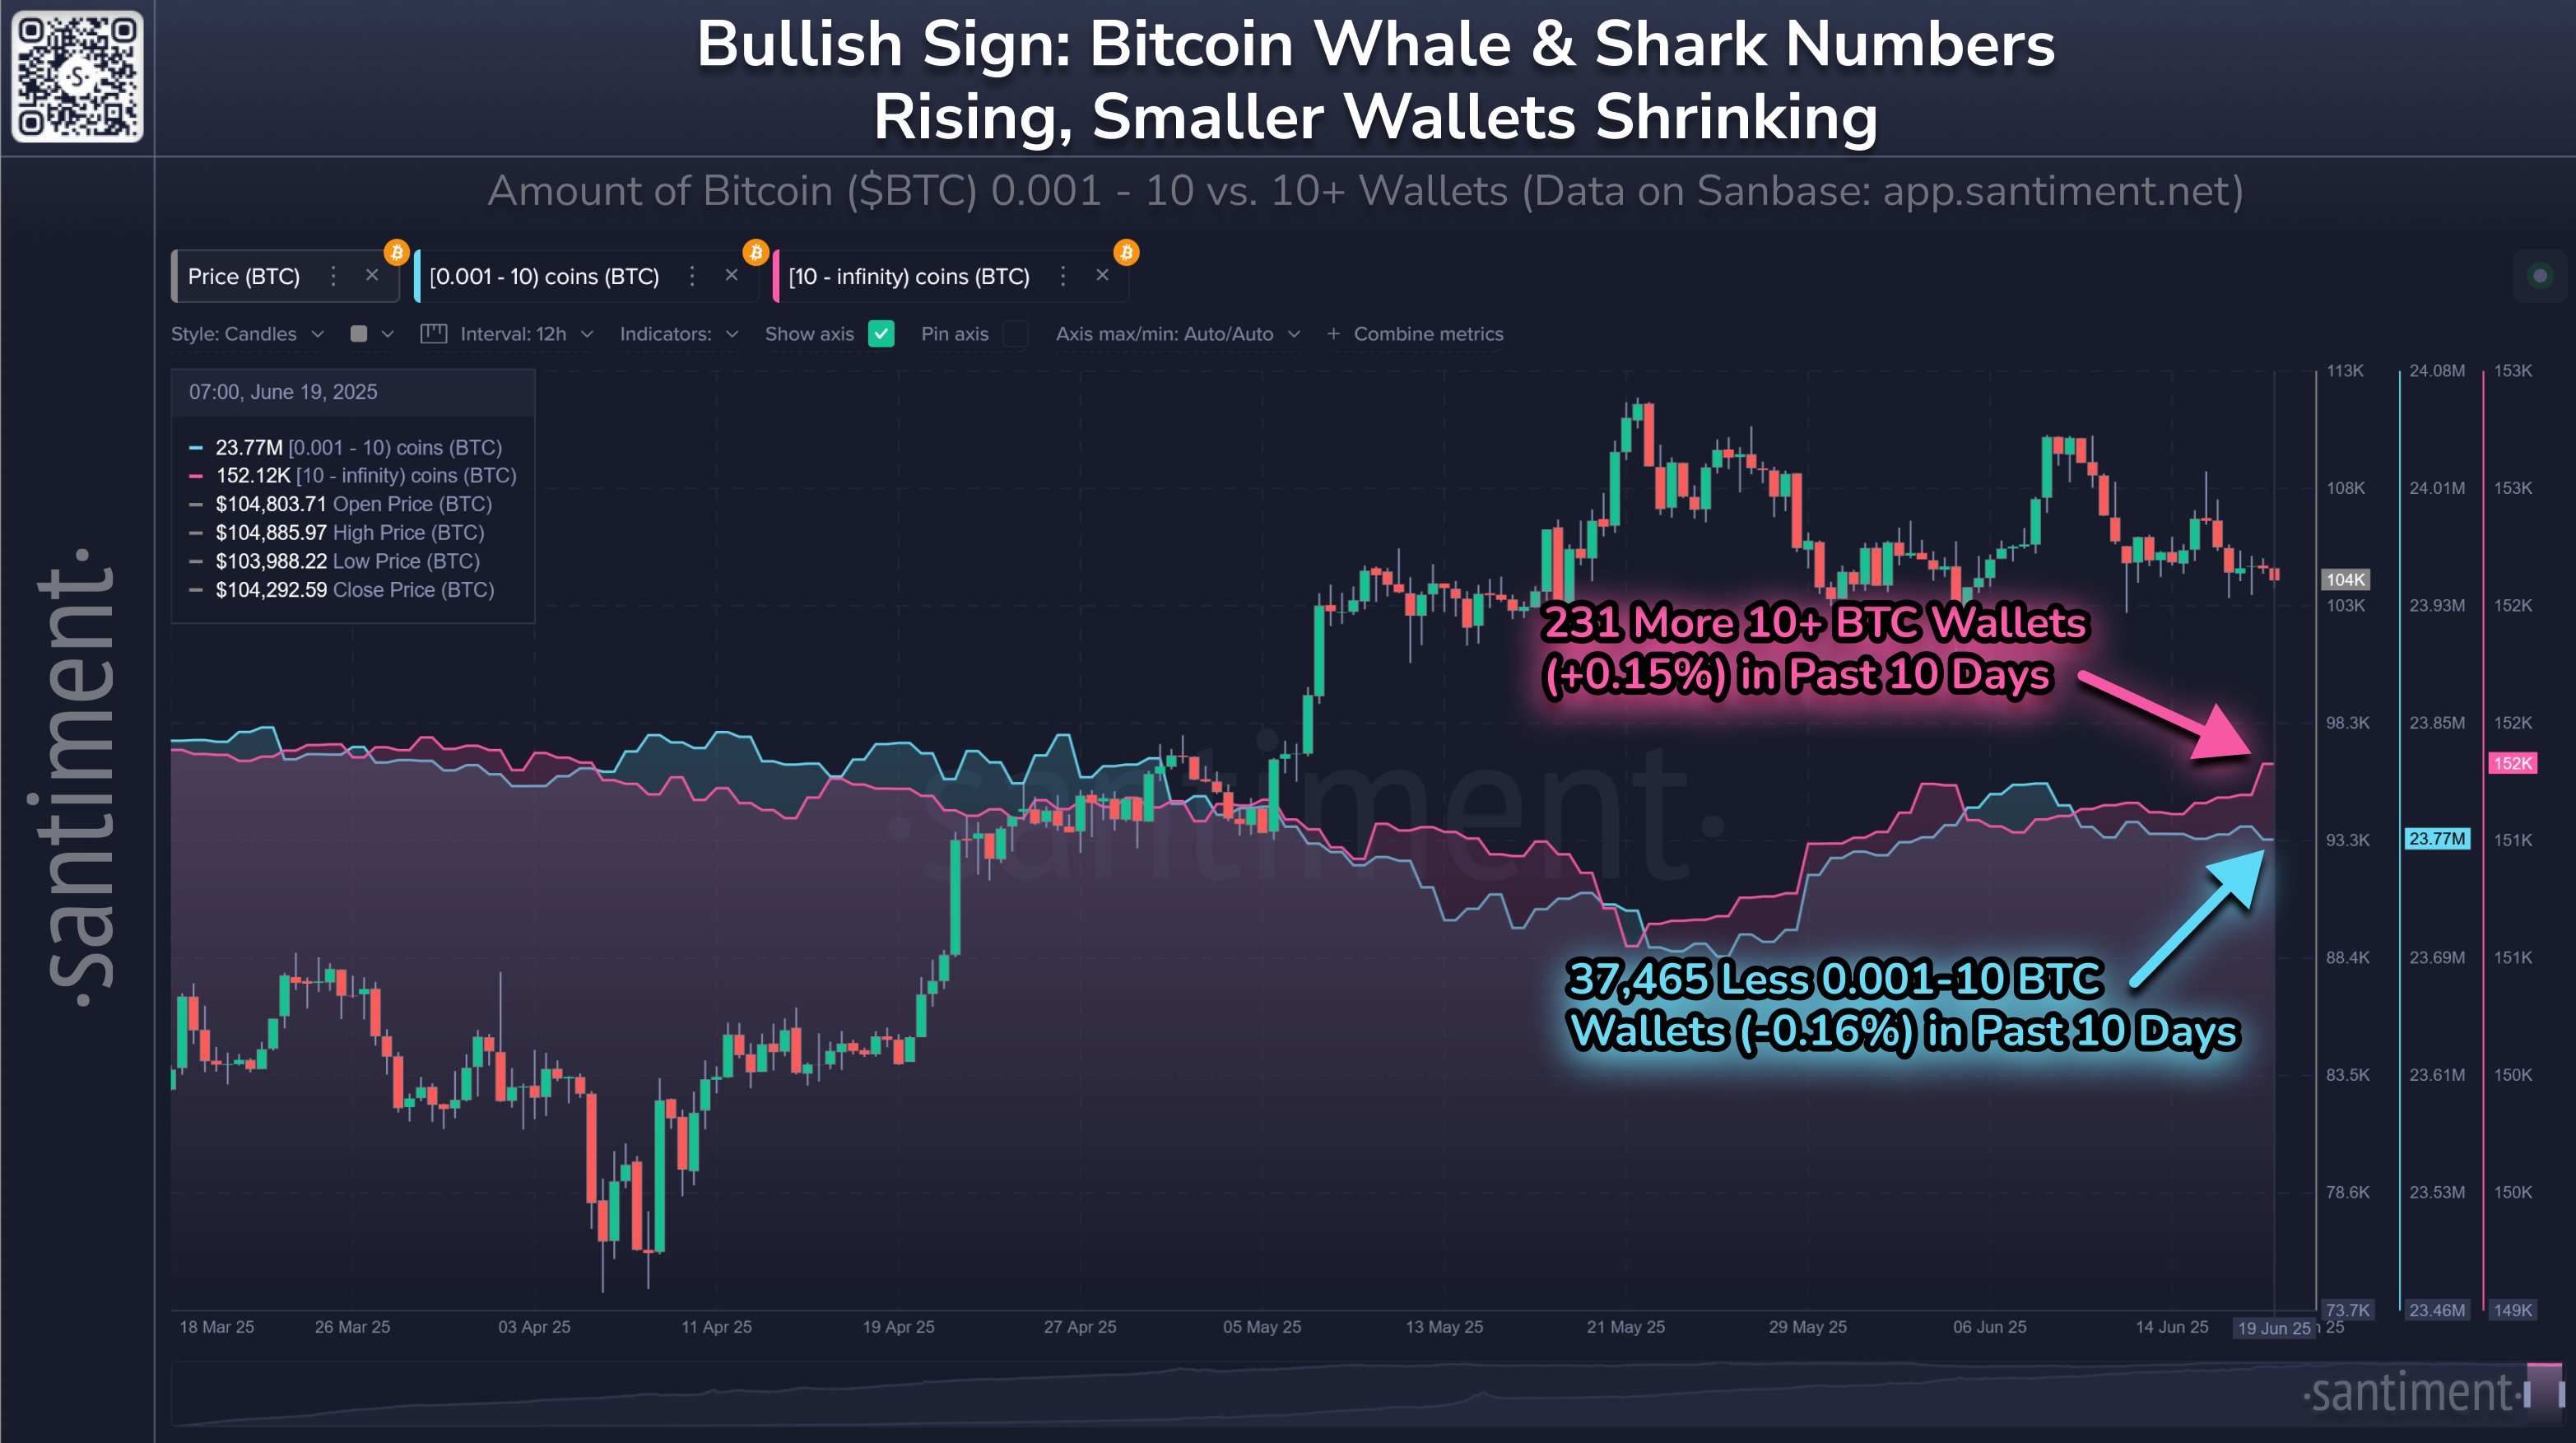
Specifically, whale wallets holding at least 10 BTC ($1.05 million) have increased by 231 in the past ten days, indicating that large holders are leveraging the dip to accumulate the crypto firstborn. However, retailers are FUDing out of their Bitcoin holdings, as addresses holding between 0.001 and 10 BTC have reduced by a staggering 37,465 (-0.16%) in the same timeframe.

Bitcoin Whale and Retail Network Activities in the Past 10 Days/Santiment

This suggests that Bitcoin is being exchanged between individuals and whales, as large holders scoop up the bitcoins that retailers are selling. Notably, Santiment has hinted at what this may mean for Bitcoin’s price.

What It Means for Bitcoin’s Price

The on-chain analytical firm highlighted that this indicates that whale and shark wallets are growing while smaller wallets are shrinking. Additionally, it suggests that large holders remain confident in Bitcoin’s near and long-term bullish momentum, while retail investors are panicking amid the recent drawdown.

Historically, this diverging sentiment often precedes bullish reversals. Santiment emphasized that it was the right combination for positive momentum to return to the crypto market. 

Historical Performance Supports Bullish Outlook

Moreover, Bitcoin is still in a bull market, and historical data suggest that there is still time. A recent report from The Crypto Basic highlighted that while Bitcoin may be in its last lap, it still has time for more upside, as identified in its historic cycles and timeline.

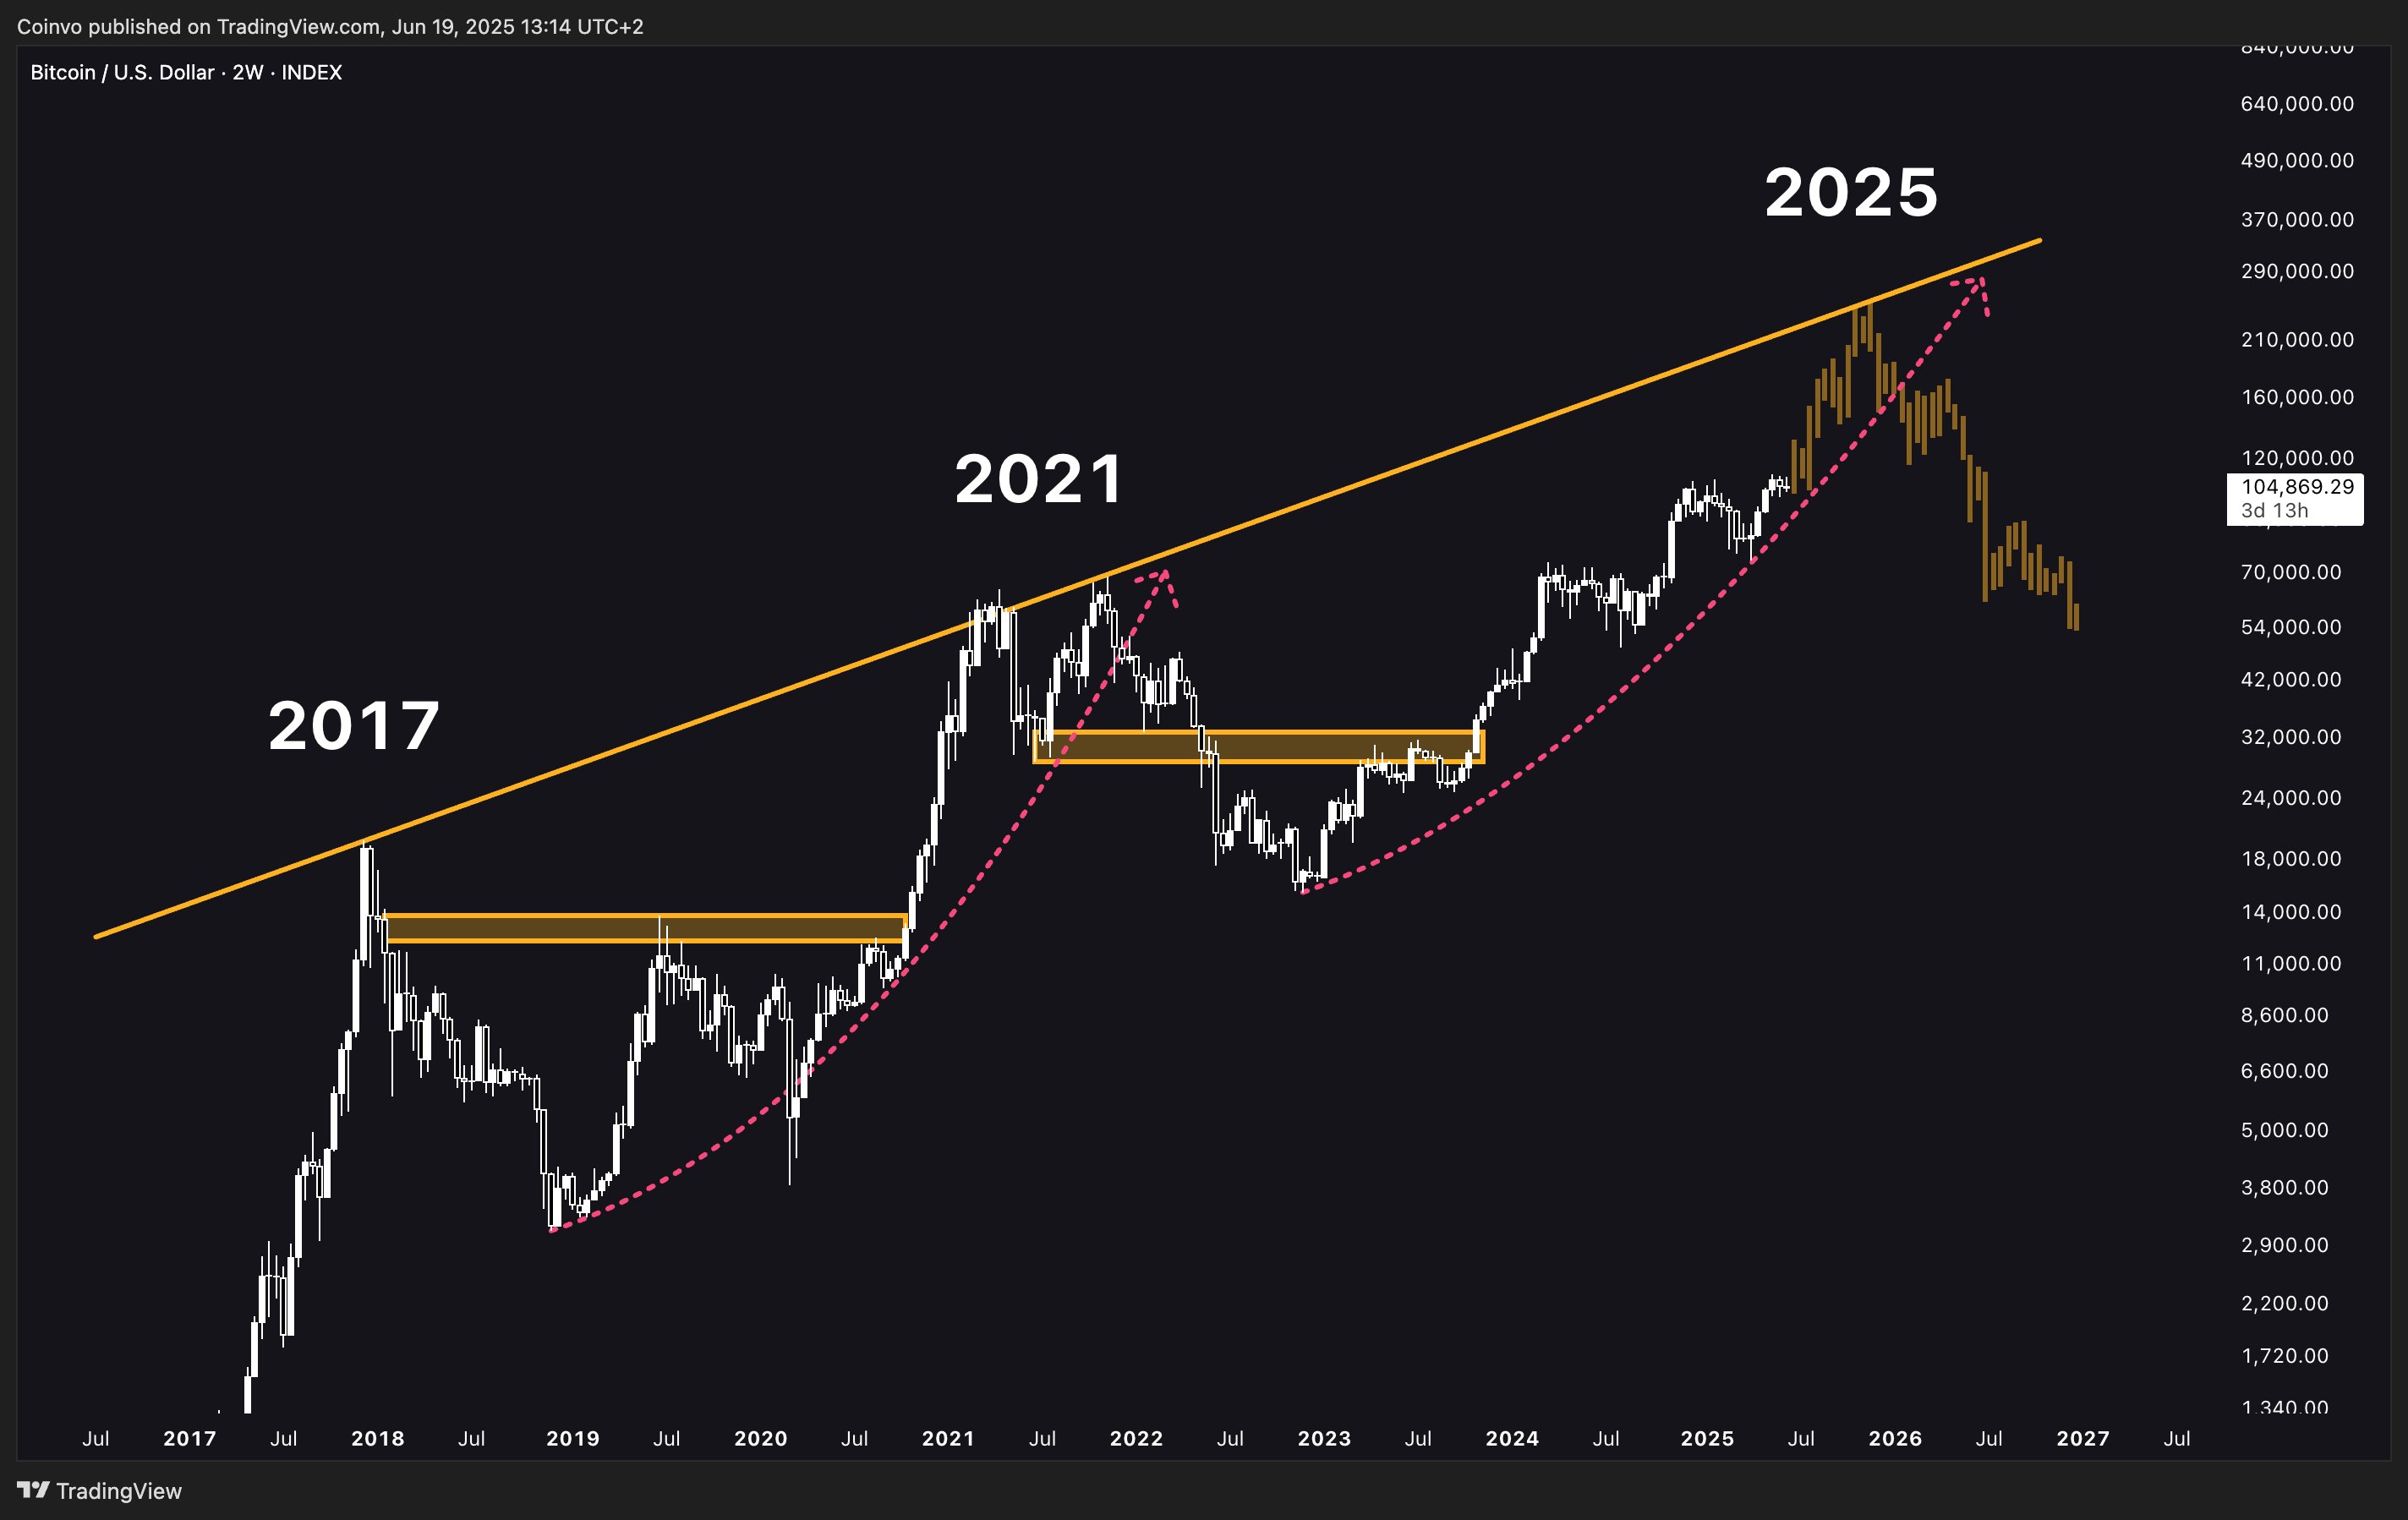
Furthermore, an analysis by Coinvo has projected a rally to $290,000 by the end of 2025, “if everything goes according to plan.” The commentary also drew inspiration from Bitcoin’s usual uptick to an ascending trendline in each of its last two cycles and the possibility that BTC would continue the trend this cycle.

Bitcoin Analysis/Coinvo

At the time of writing, Bitcoin trades at $105,524, 174% away from the $290,000 target.