Home Blog Page 669

Ethereum Holds $2,500 Amid Middle East Tensions: Is a Reversal Ahead?

Ethereum holds above $2,500 as institutional inflows rise and bulls defend key support at $2,395. Will ETH retest $2,699 next?

The broader crypto market remains muted as tensions in the Middle East escalate. Ethereum holds ground around $2,500, with lower price rejections suggesting bullish support at lower levels. Amid these conditions, will institutional support revive a bullish trend in Ethereum?

Ethereum Price Analysis

On the daily chart, Ethereum’s price shows a declining trend from last week. It is currently subsiding slightly above the 38.20% Fibonacci level at $2,395. At present, Ethereum trades at approximately $2,522.

Ethereum price chart

The lower price rejections, evident in the long wicks of the daily candles, suggest bullish support at lower levels and increase the possibility of a trend reversal.

Additionally, the support level at $2,395 has remained intact since early May, further increasing the chances of a reversal and supporting the upside potential. However, momentum indicators present a contradictory view.

The declining MACD and signal lines are approaching the zero line, signaling a surge in selling pressure. Meanwhile, the daily RSI remains flat at the midpoint level.

A potential reversal in Ethereum could test the 50% Fibonacci level at $2,699. However, a close below the 38.20% Fibonacci level could extend the decline toward the $2,000 psychological mark.

Institutions Still Acquiring Ethereum

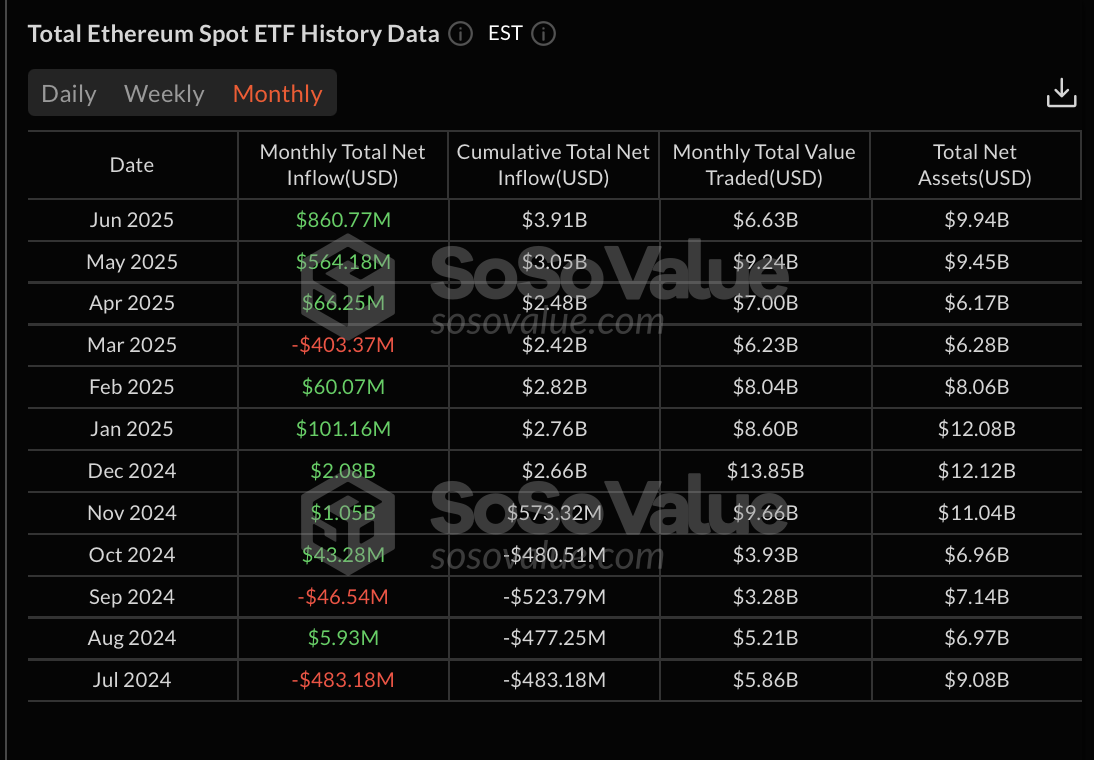
Despite the recent fall in Ethereum, institutional support continues, with only a minor outflow of $2.18 million recorded on June 13 over the past five weeks. According to SoSoValue data, U.S. Ethereum spot ETFs recorded a total net inflow of $11.09 million on June 17. The trend continued on Wednesday with a $19 million inflow.

Overall, the monthly inflow for June so far amounts to $860 million, the highest in 2025. Therefore, with rising institutional support, demand could soon translate into a spot-priced rally in Ethereum.

Total Ethereum Spot ETF History

Ethereum Derivatives

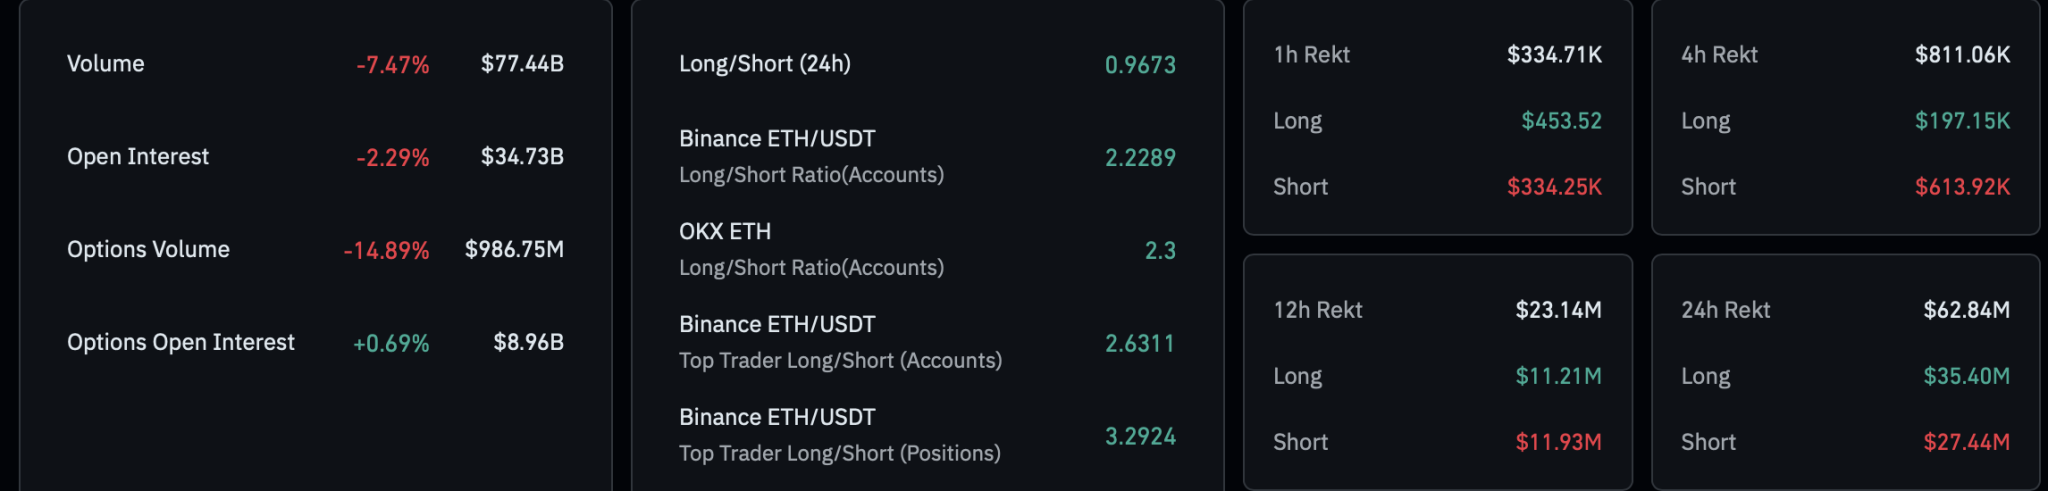
CoinGlass data shows a decline in bullish activity in the Ethereum derivatives market, with open interest down 2.29% to $34.73 billion. The increased liquidation of bullish traders over the past 24 hours appears to have triggered a capital withdrawal from Ethereum derivatives.

Data shows that $35.40 million worth of long positions were wiped out in 24 hours, compared to $27.44 million in short liquidations. This results in a long-to-short ratio of 0.9673, suggesting a marginally higher number of active short positions.

ETH Derivatives
ETH Derivatives

If You’re Not Expecting Dogecoin at $5, You Don’t Know Anything: Analyst Says

0

An analyst has reiterated the possibility of a Dogecoin rally, stating that those who aren’t expecting it to reach $5 “probably don’t know anything.”

Dogecoin (DOGE) is trading at $0.1698, reflecting a slight decline of 0.34% over the past 24 hours. This marks a larger 10.52% decrease over the past week. Despite this downturn, some analysts see potential for higher prices based on historical chart patterns.

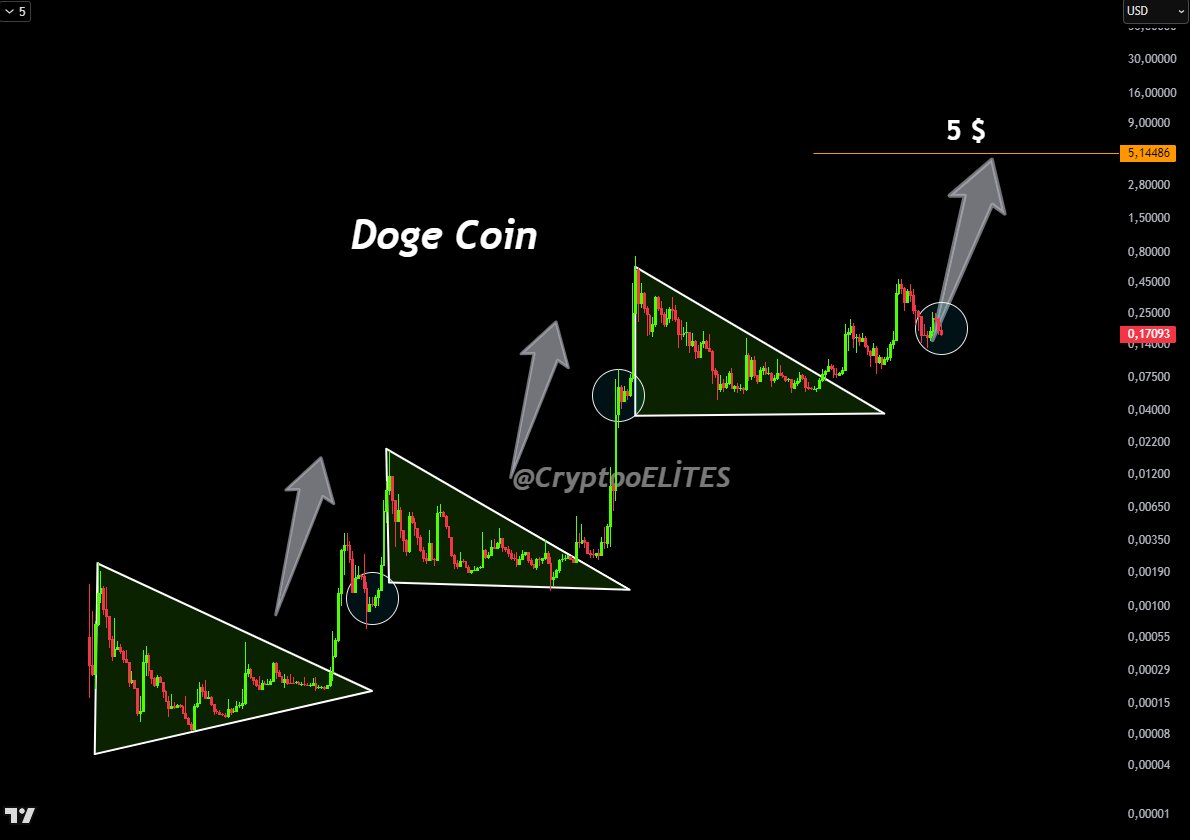
For instance, Crypto Elites has drawn attention to the historical patterns of Dogecoin’s price action, particularly focusing on symmetrical triangle formations. These patterns, which typically indicate periods of consolidation, have historically preceded significant price breakouts.

Crypto Elites’ Symmetrical Triangle Analysis

The first notable triangle in Dogecoin’s history appeared in early 2016, when DOGE traded at a mere $0.0001. After consolidating within this symmetrical triangle, Dogecoin experienced a breakout in late 2017, propelling the price from $0.008 to $0.017 by January 2018. This marked the beginning of a bullish trend for the cryptocurrency.

The second triangle formed in December 2020 after Dogecoin’s price dropped below $0.002. After a lengthy consolidation phase, the cryptocurrency broke out in 2021, soaring to $0.080 by February.

Although there was a pullback afterward, which saw the price dip to around $0.052, Dogecoin quickly regained momentum and surged to $0.73 by May 2021, continuing the upward trend.

Image
Dogecoin Price Chart

The Current Triangle and Future Projections

The third symmetrical triangle began forming around mid-2022, when Dogecoin’s price bottomed out at approximately $0.05. The breakout occurred in early 2024, as Dogecoin’s price reached $0.22 by March 2024.

Following this breakout, there was another consolidation phase, but the cryptocurrency once again surged, reaching above $0.48 by December 2024. However, since then, the price has fallen back to around $0.17, although signs of recovery are emerging.

Crypto Elites has continued to emphasize a bullish outlook for Dogecoin, suggesting that a price of $5 is within reach. He boldly asserted that those not anticipating a move to $5 “probably don’t know anything.”

Notably, Dogecoin would need to increase by 2,847% to reach $5 from its current price of $0.17. Moreover, this price level would equate to a market cap of around $750 billion.

ADX and LMACD Indicators Suggest Diverging Paths

Meanwhile, another analyst, Tardigrade, has compared Dogecoin’s current ADX (Average Directional Index) pattern to that observed in 2019 and 2020, before the cryptocurrency’s major rally. A similar setup appears to be unfolding in 2024–2025, with the ADX pattern showing a series of peaks followed by a dip.

As of now, the ADX is rising again, and analysts suggest it could signal a more conservative rally to $4.50.

However, not all indicators point towards a bullish future for Dogecoin. Technical analyst Tony Severino pointed out that Dogecoin’s one-month LMACD (Logarithmic MACD) shows weak momentum.

This indicator measures momentum shifts and indicates that DOGE is experiencing a continued downtrend. Severino compares the current LMACD to the one seen in 2017 and 2022 when the cryptocurrency faced periods of declining momentum. As of now, the LMACD remains negative, suggesting the possibility of further weakness in Dogecoin’s price movement.

Bitcoin In the Final Lap but Not Done Yet: Top Analyst Explains Why

0

Amid growing speculations that Bitcoin may have topped this cycle, a top analyst has suggested otherwise, insisting that BTC has more upside.

Bitcoin is down a mere 6.4% from its all-time high of $112,000, and tongues are already wagging about a possible top. A recent analysis suggested that the crypto leader has reached its peak price for this cycle, citing several factors, including a weakening relative strength index (RSI).

Bitcoin Not Done Yet

However, a Wednesday commentary from experienced market analyst Titan of Crypto suggests otherwise. In the June 18 post, he highlighted that while Bitcoin is in the final phase of its bull cycle, it has more uncharted territories to conquer.

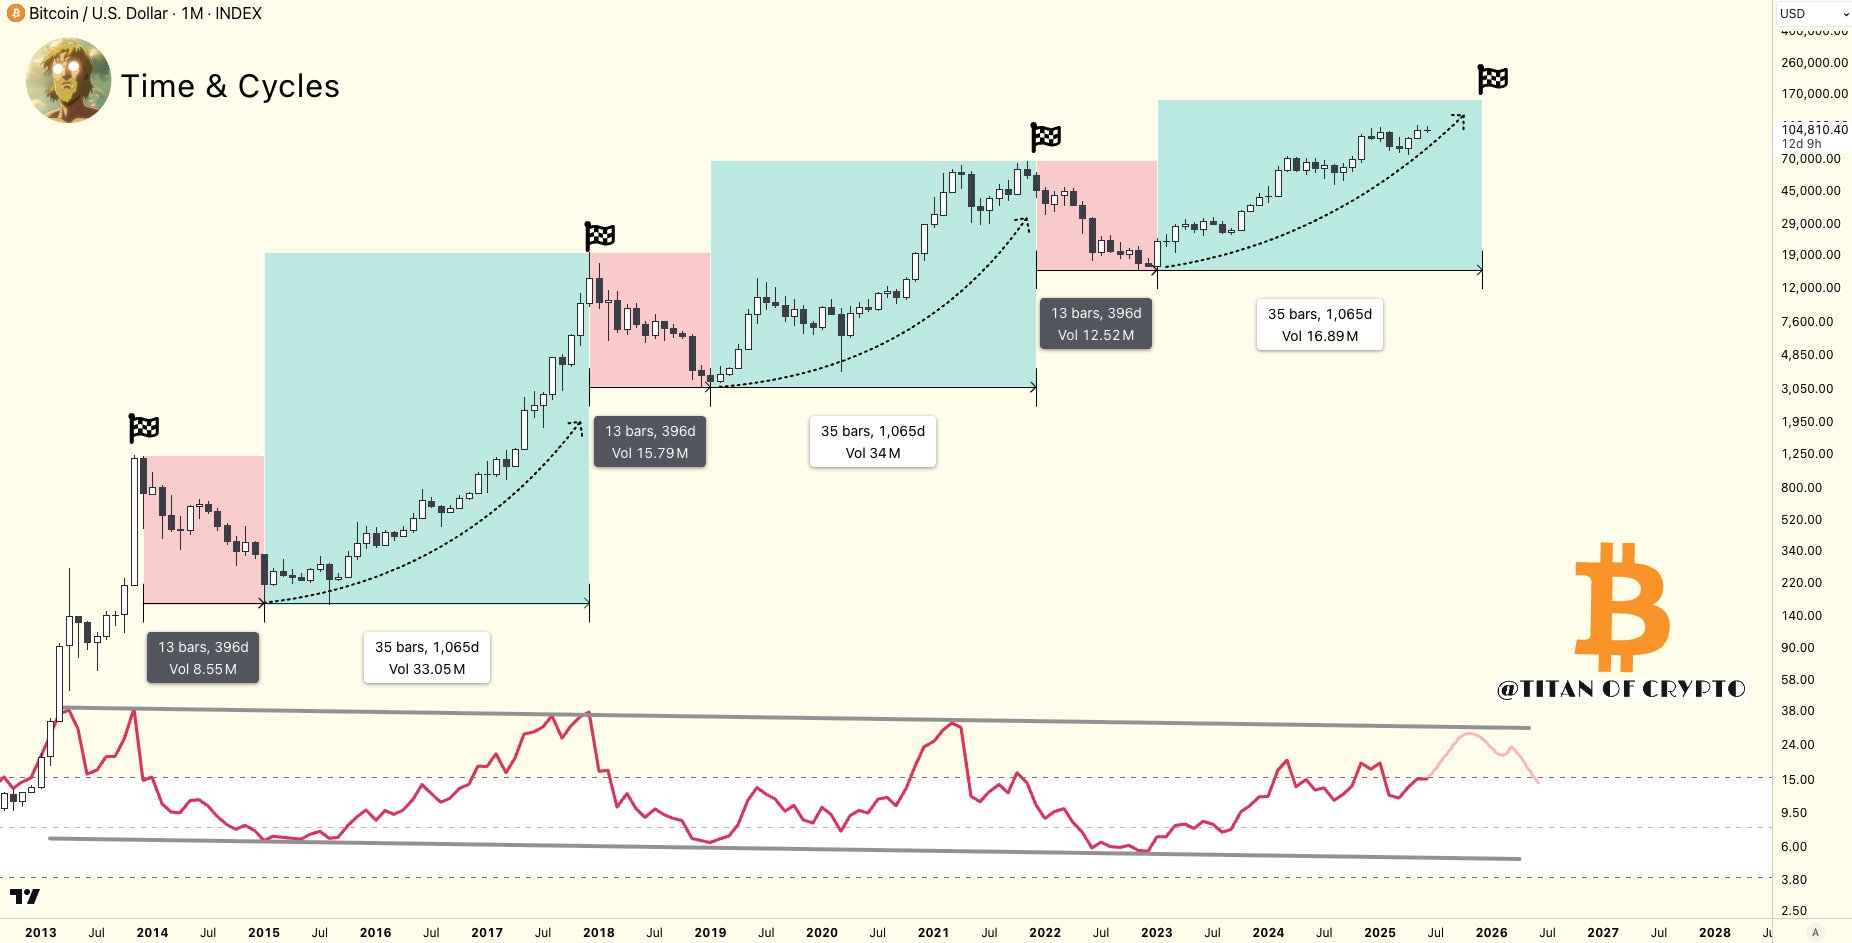
To add context, the watcher shared a 1-month Bitcoin chart showing Bitcoin’s price action in the last two bull cycles. The chart highlighted a clear fractal pattern in Bitcoin’s cyclical price movement, divided into one year of intense corrections followed by three years of parabolic expansion.

Bitcoin Historical Cycle | Titan of Crypto

Interestingly, as highlighted in the chart, Bitcoin’s cycles have followed a clear pattern. For instance, between 2014 and 2015, BTC saw 13 bars (396 days) of a bearish cycle, which aligned with its steep decline from a high of $1,242 to as low as $162.

Meanwhile, momentum picked up at the beginning of 2015, with prices gradually recovering over a 35-bar (1,065-day) period to reach their high of $19,804 in December 2017.

Interestingly, after this period of recovery and eventual bull run, another 13-bar (396-day) correction resumed, followed by the same 1,065 days of bullish uptrend to 2021’s high of $69,000.

Different Cycle, Same Pattern

Titan of Crypto shared that the systematic price development has endured for the third cycle running. After correcting 76% from 2021’s high to $16,240 in December 2022, its bullish phase kicked in in January 2023.

Currently, this parabolic expansion is in the 29th bar, with each month representing one bar. While its price has rallied 534.5% from January 2023’s opening to its current price, history suggests there could be more.

Furthermore, with the bullish phase of the last two cycles peaking after 35 bars, Bitcoin still has at least five more bars to go. This means that Bitcoin has until November this year, which is approximately 165 days from now, to continue its bullish uptrend.

Remarkably, Titan of Crypto did not mention a specific target this cycle. However, an earlier analysis predicted that it could soon rally to $137,000, citing a possible wedge breakout.

A Different Bull Cycle?

While analysts continue to bank on past data to predict Bitcoin’s near-term trajectory, some have suggested that this cycle could be different. Specifically, Michael Saylor suggested that crypto winter is way behind Bitcoin, predicting an extended bullish run to between $500,000 and $1 million before any notable correction.

Binance’s co-founder, Changpeng Zhao, and Brandon Green also agree, predicting a similar price outlook for Bitcoin. The latter tapped the growing institutional influence in Bitcoin and an impending supply shock to spur this explosive move.

Here’s How Many Days XRP Has Remained Above $0.50

0

XRP price has remained above a previous consolidation range for over half a year, confirming its recent growth momentum.

Amid the market turbulence, the XRP has persistently ranged along $2. This price action becomes even more discouraging when compared to Bitcoin (BTC). For perspective, Bitcoin has continued to reach new all-time highs since April. In contrast, XRP has failed to even reclaim the $3.4 yearly peak from January 2025.

Despite this gloomy price action, XRP’s current position still represents a massive improvement from previous prices. Specifically, the $0.5 price level, which XRP battled for several years, appears to be gradually now morphing into oblivion.

XRP’s Rollercoaster Ride Around $0.5

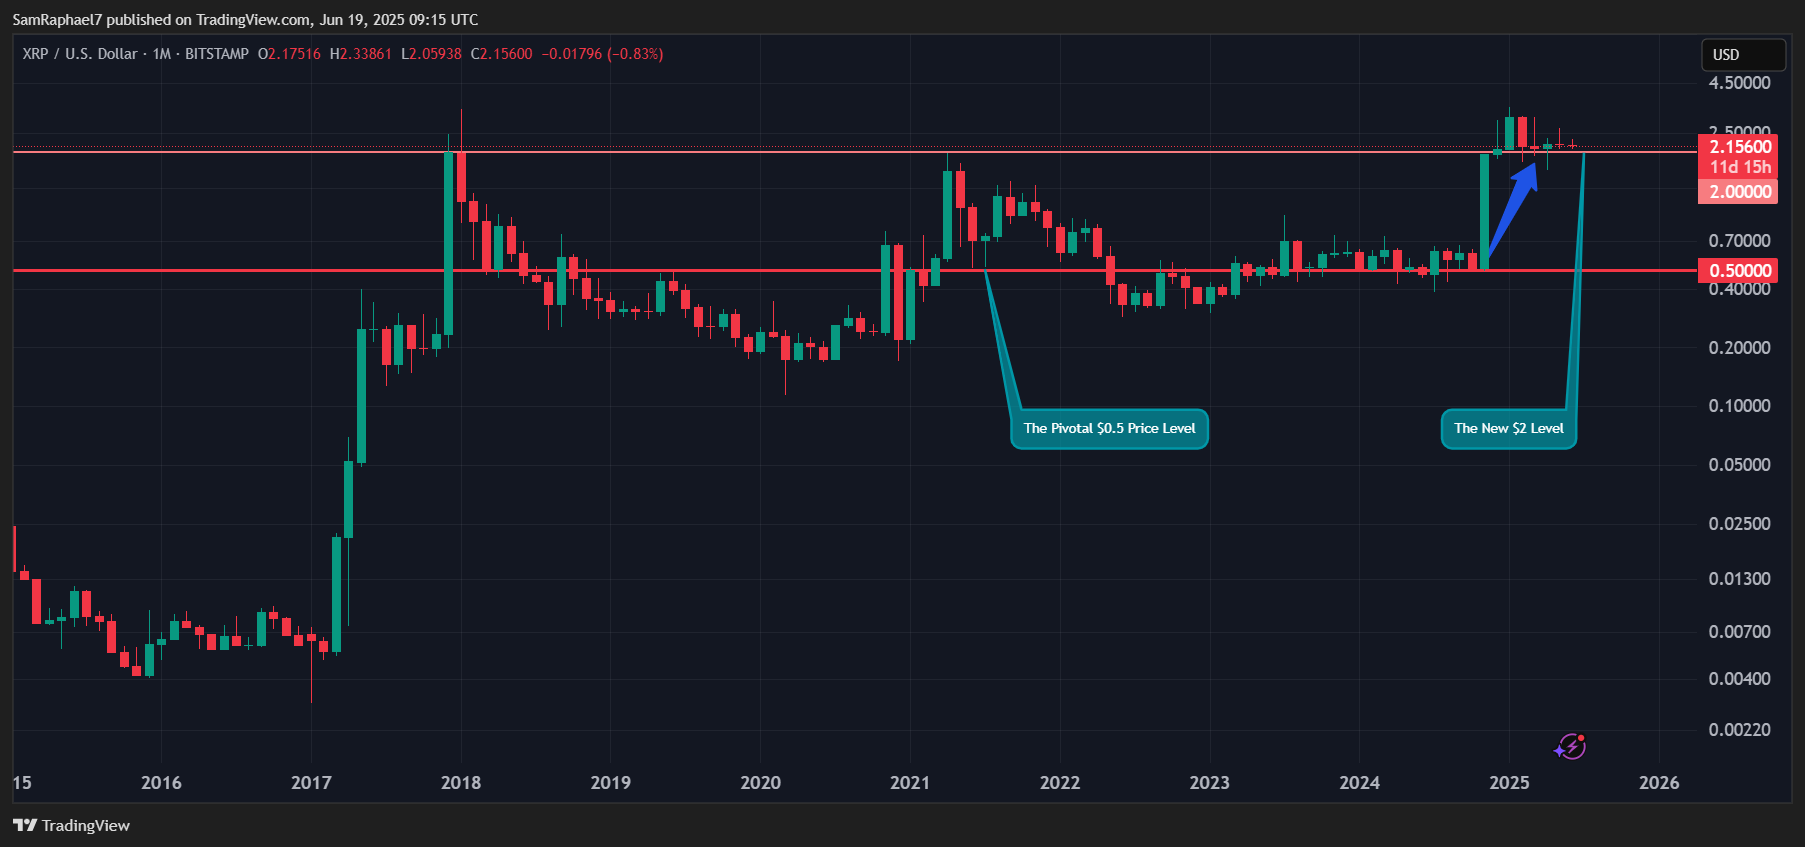
Notably, XRP first touched the $0.5 price during the uptrend in December 2017. At the time, the level represented resistance and a new high for XRP. After XRP conquered $0.5 and soared to $3.8 by January 2018, the decline that followed pushed prices back to $0.5.

From March to June 2018, XRP leveraged $0.5 as support, often dropping to this level and then bouncing back. However, between July 2018 and June 2019, $0.5 flipped to resistance, with XRP repeatedly retesting the price level in order to break out of the prevalent bearish trend.

From July 2019, XRP slipped further below $0.5, even hitting as low as $0.11 by March 2020. Meanwhile, from November 2020, it started retesting $0.5 again, eventually breaking above it by April 2021 to reach the $1.96 peak at the time.

Following a correction from this peak, XRP again dropped toward $0.5 as support in June 2021 and then breached below the level by May 2022 amid the Terra collapse. A year later, XRP reclaimed $0.5 on the back of the July 2023 upsurge from Judge Torres’ ruling in the SEC vs. Ripple case.

XRP Appears to Have Now Decisively Transcended $0.5

Nonetheless, the run was unsustainable, and as XRP dropped in August 2023, it resumed its retest of $0.5 as support. This continued until November 2024, when XRP decisively broke above $0.5, conquering both the $1 and $2 psychological levels in the months that followed.

XRP 1M Chart
XRP 1M Chart

Now, despite the ongoing market uncertainty, XRP has stayed far above the $0.5 level for the longest period ever. Specifically, the last time XRP saw $0.5 was on Nov. 5, 2024. This indicates that it has not revisited the $0.5 mark for 226 days, a new milestone.

Most recently, XRP has been retesting $2, as the price mark repeatedly flips between resistance and support, with a previous report from The Crypto Basic calling $2 the new $0.5 level. Notably, this is a bullish development for XRP, as it is a confirmation that it has grown beyond its past levels.

As XRP now consolidates around $2, several analysts believe it is only a matter of time before it also transcends this region. For one, market analyst EGRAG believes a run toward the $20 range is imminent. Earlier this week, he predicted the XRP cycle top to be around $24. Interestingly, XRP critic Davinci Jeremie also sees XRP reaching $24.

Bitcoin Could Reverse to $80K Range Amid Diamond Top Formation

0

A Diamond Top pattern has formed on the Bitcoin daily chart, signaling a potential bearish reversal to crucial support.

Bitcoin has shown sharp price swings over the past week, maintaining levels above $104,000 after an earlier push past $108,000. Despite the strength, it has failed to stay above that mark, pointing to heavy resistance. 

Amid this waning strength, the recent formation of a Diamond Top pattern on the 1-day chart has brought renewed attention to a possible shift in trend.

Diamond Top Pattern Signals Potential Reversal

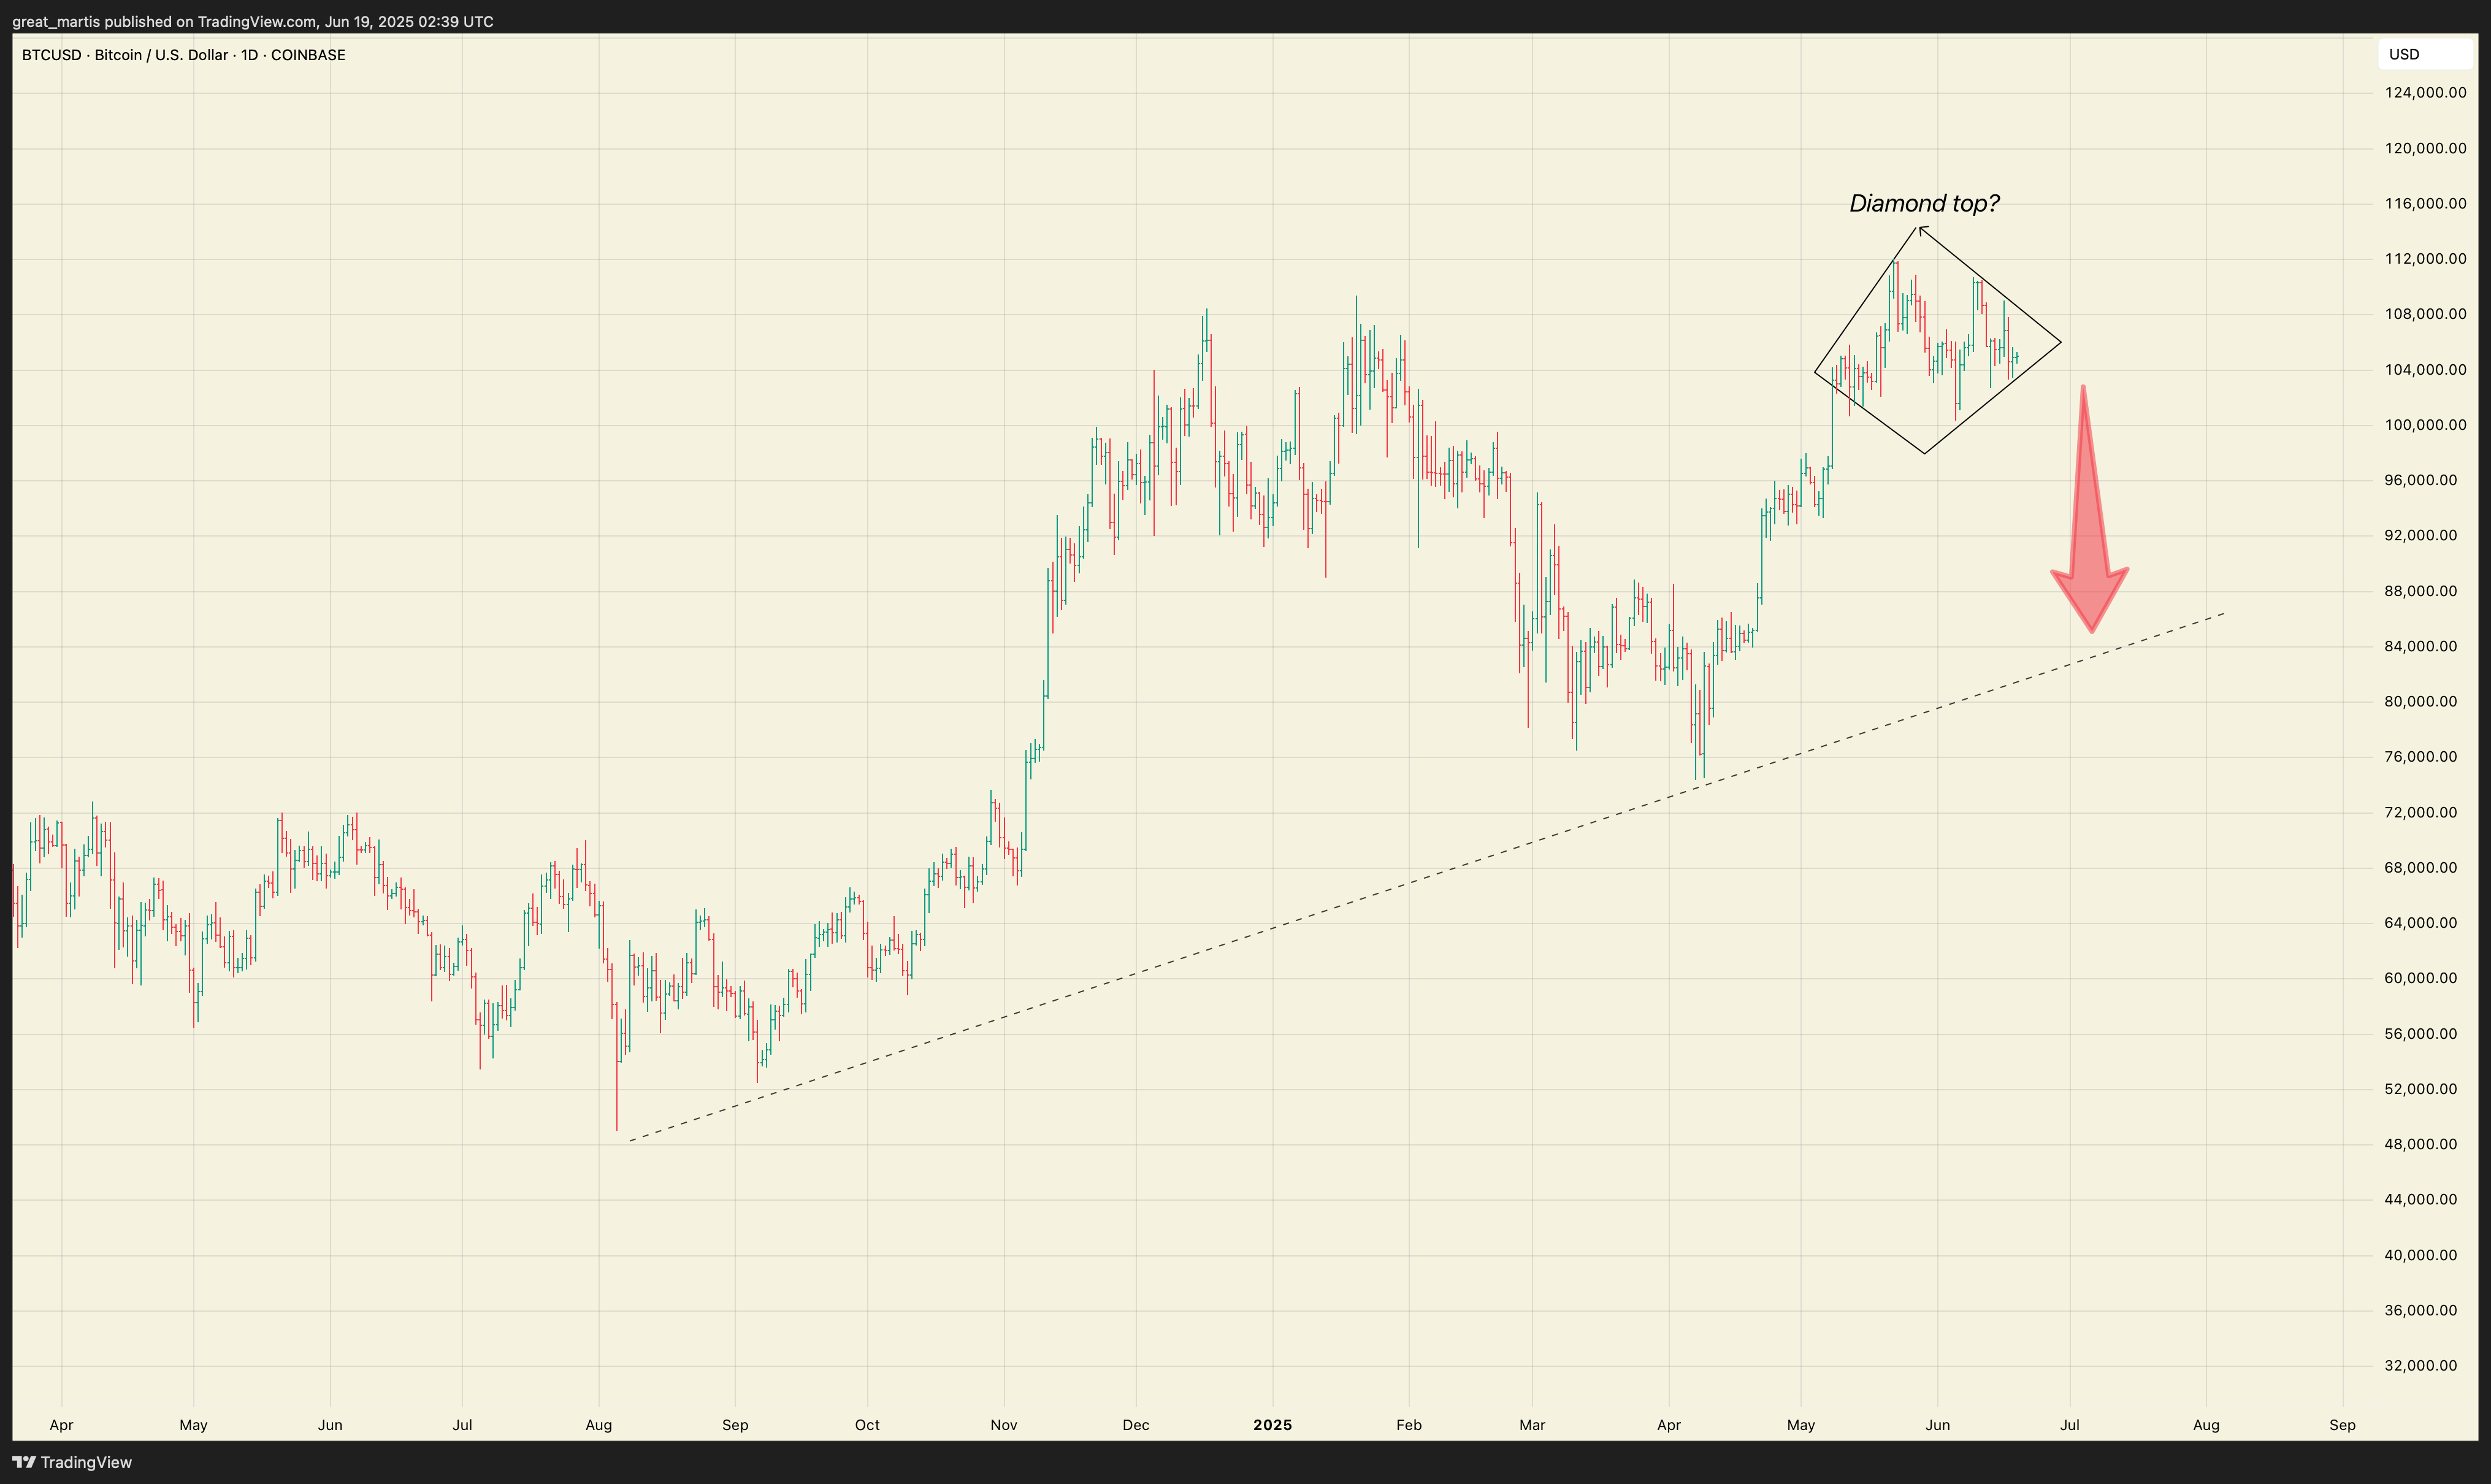
Analyst The Great Martis, posting on X, identified a Diamond Top pattern, a technical formation typically seen during a slowing rally. The pattern began developing after Bitcoin climbed from $98,000 on May 8 to above $103,000. Since then, the price action has remained mostly constrained within the diamond boundaries.

Image

Attempts to break out continued, with Bitcoin pushing near $111,998 on May 22. However, trendlines forming the diamond pattern limited this upward move. Subsequently, by June 5, the asset had dropped to $100,445, only to bounce back as the lower boundary held firm.

Another surge followed on June 9, briefly pushing the price above $110,000. A drop to $102,740 came after escalations in the Middle East conflict, yet the diamond trendline continued to act as support.

Trendline From 2024 Still Providing Support

Meanwhile, parallel to the diamond formation, a dashed ascending trendline that began forming in August 2024 remains intact. This trendline has offered reliable support throughout the ongoing uptrend. 

It first held on Sept. 6, 2024, when Bitcoin fell to $52,500 and again on April 9 during a pullback to $74,400. If Bitcoin breaks below the Diamond Top support, this long-term trendline is expected to be the next technical level to watch, as it now sits around the $80,000 price mark.

On-Chain Metrics Show Signs of Overheating

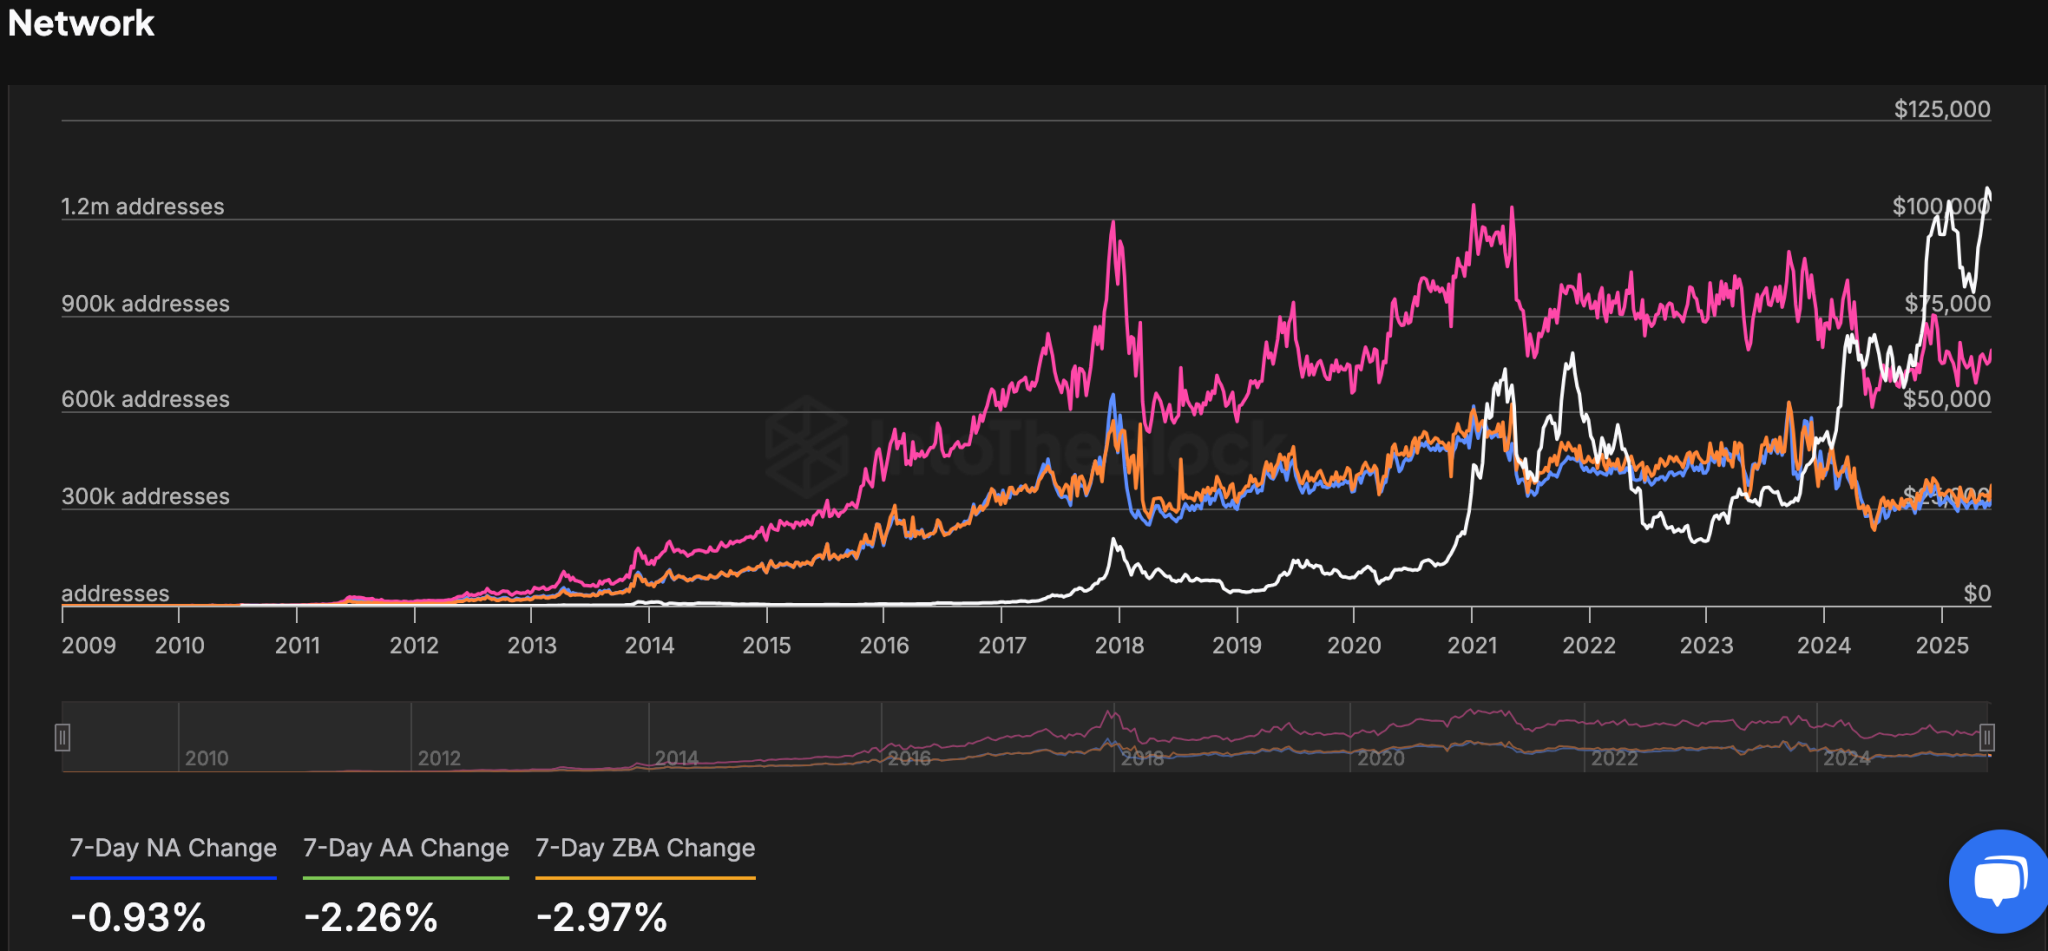
Bitcoin Network data over the last seven days reveals further signs of a slowdown. New Addresses fell 0.93%, while Active Addresses dropped 2.26%.

Screenshot 2025 06 19T115102305
Bitcoin Daily Active Addresses

Moreover, Zero Balance Addresses, which typically reflect new wallet creation, also declined by 2.97%. These figures suggest reduced participation on the network.

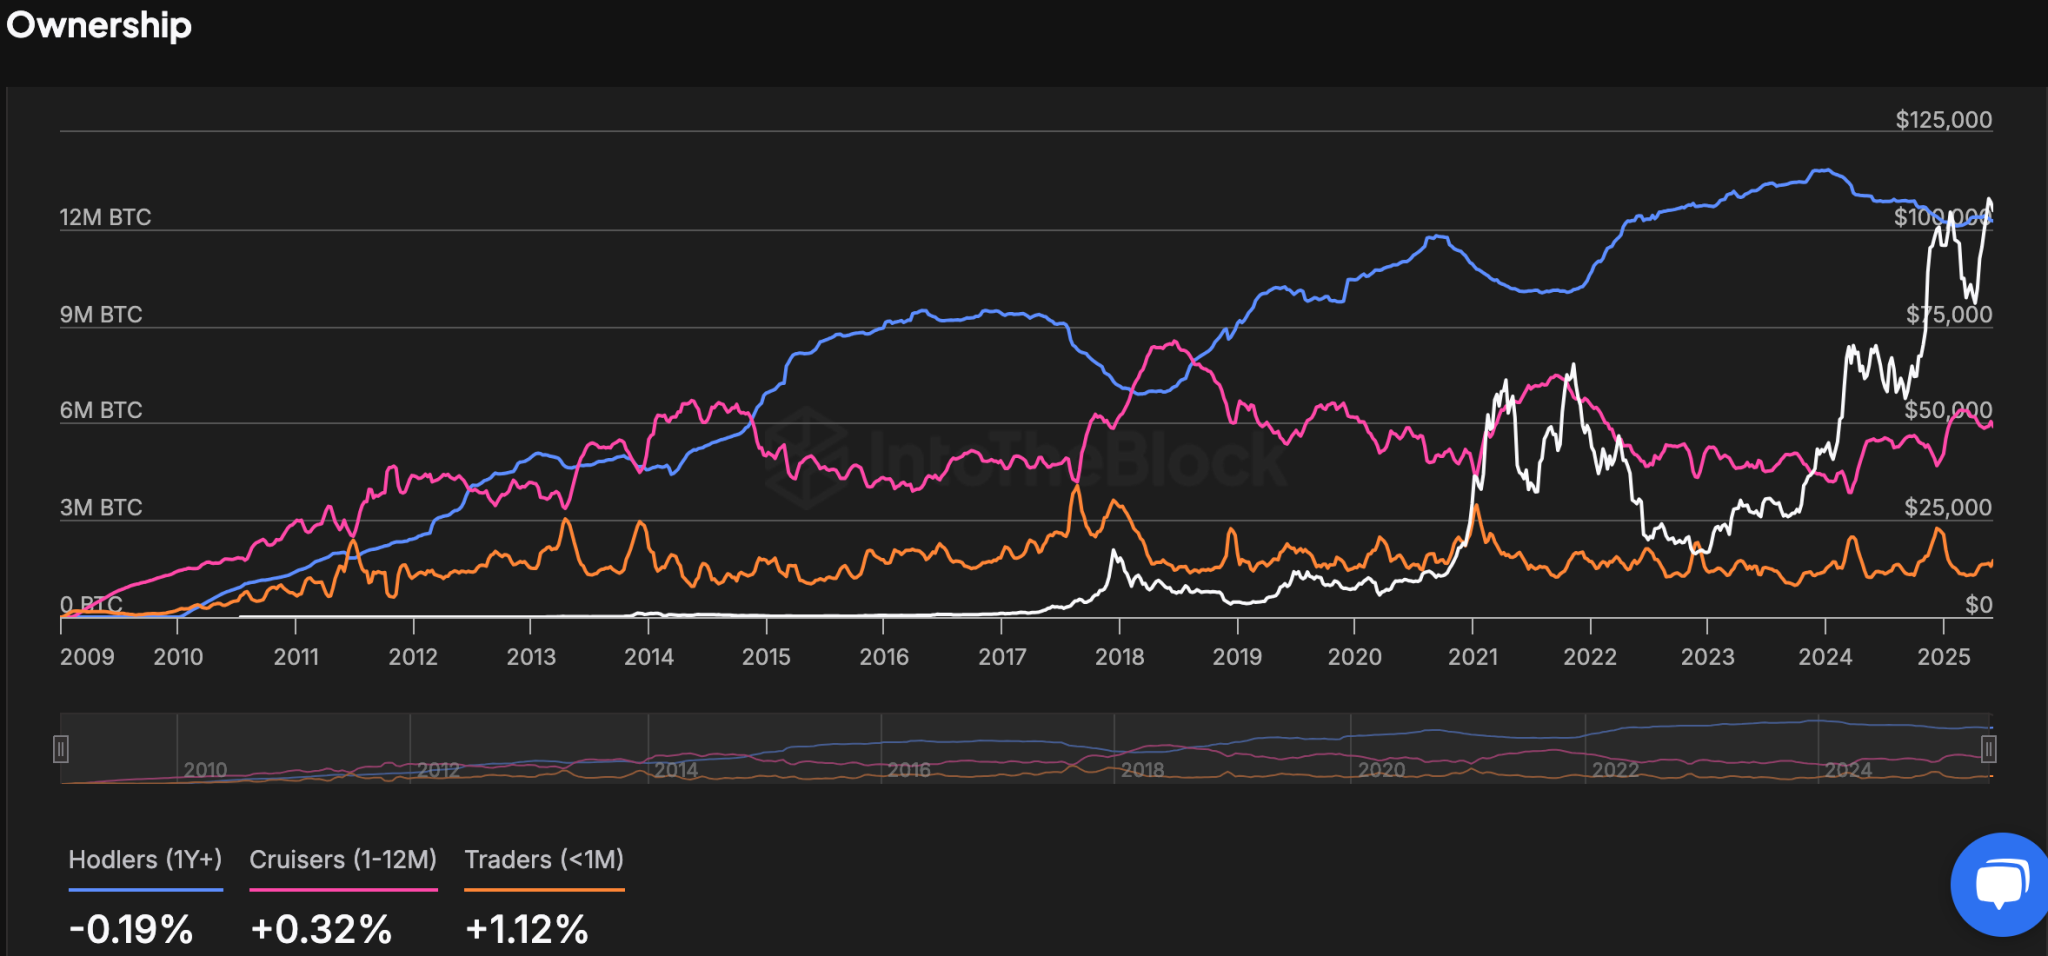
Ownership data adds more detail. Bitcoin held by long-term holders—classified as Hodlers (1+ years)—decreased by 0.19%.

Screenshot 2025 06 19T115146092
Bitcoin Holder Balance by Time Held

In contrast, Cruisers (1–12 months) saw a mild increase of 0.32%. Most notably, the share of BTC held by short-term Traders (less than one month) jumped 1.12%, reflecting increased activity among newer market participants.

A high influx of short-term traders often marks the late stage of bull runs, when fear of missing out kicks in. This is a strong signal of overheating for Bitcoin.

Michael Saylor: Only One Nation Can Control 20% of Bitcoin — It Should Be the U.S.

0

At the 2025 Conservative Political Action Conference, MicroStrategy founder Michael Saylor shared his vision for the United States to secure a dominant position in the global Bitcoin network.

According to Saylor, there is only room for one nation to control 20% of the Bitcoin network, and that should be the United States of America. This strategy, he argued, would not only strengthen the dollar but also offer a unique opportunity to erase the national debt.

Bitcoin as the Future of Property Ownership

Saylor emphasized that Bitcoin represents more than just a digital currency. To him, it is a new form of property.

Unlike physical assets like land or oil, Bitcoin is a commodity without an issuer. No entity, whether a nation, company, or individual, can alter or corrupt Bitcoin. According to Saylor, this makes Bitcoin an unstoppable force that has reached “escape velocity.”

With over two trillion dollars invested in the Bitcoin network, it has become a stable, secure, and decentralized asset.

Saylor highlighted that, similar to the U.S. acquisition of Alaska for a mere $6 million, securing a substantial portion of Bitcoin could lead to massive financial returns. He pointed out that owning Bitcoin would position the U.S. to not only neutralize its national debt but also solidify its financial future.

The potential economic benefits could range from $50 trillion to $80 trillion, according to Saylor’s projections.

The Road to U.S. Bitcoin Acquisition

Saylor also outlined a potential timeline for the U.S. to secure its Bitcoin reserves. He anticipates that within 12 months, the U.S. could begin acquiring up to 20% of the Bitcoin network. 

The challenge, however, lies in building a political consensus. Saylor believes that the White House, Congress, and other key stakeholders will unite to realize this vision, ultimately enriching the nation through Bitcoin ownership.

While the U.S. currently holds diverse assets, including gold, oil, and minerals, Bitcoin would represent a new and transformative addition to the national reserve. According to Saylor, Bitcoin’s unstoppable nature makes it the ideal asset for this purpose, providing a robust form of economic security for the country and its citizens.

China or Russia Could Threaten the US Position on the Global Stage

Furthermore, Saylor stressed the importance of Bitcoin in maintaining American economic dominance in cyberspace. He suggested that if the U.S. controls a significant portion of the Bitcoin network, it could set the stage for its allies to follow suit.

Conversely, he warned that failure to act quickly could result in other nations, such as China or Russia, taking control of Bitcoin, threatening the U.S.’s position on the global stage.

In the long term, Saylor argued, Bitcoin could be the key to maintaining U.S. power and influence in the digital age. It could serve as economic armor, offering citizens financial independence and protection against government interference.

Michael Saylor has also shown openness to providing guidance to Pakistan regarding its approach to Bitcoin reserves. This follows a crucial meeting with the country’s top finance officials, during which Bitcoin’s role in national financial strategies was discussed.

Pundit Says XRP Ledger is Coming for DTCC’s $100T: Here’s Why

Influential figures in the XRP community are seeing a potential path for XRP within the DTCC’s $100 trillion infrastructure.

For context, the Depository Trust & Clearing Corporation (DTCC) officially surpassed $100 trillion in assets under custody on Wednesday, June 18, setting a new record. This figure reflects strong growth across asset classes from 2020 to 2025, including a 49% rise in equities and a 2x in ETF holdings to $11 trillion.

DTCC’s central securities depository, DTC, plays a critical role in U.S. capital markets by safeguarding securities, processing transactions, and supporting asset servicing for over 1.44 million securities across 170+ countries.

Ripple’s Acquisition of Hidden Road Ties XRP Ledger to DTCC Ecosystem

While DTCC celebrates record-breaking figures, Ripple is quietly positioning itself within this infrastructure. In a post on X, prominent XRP community voice Chad Steingraber remarked that the XRP Ledger (XRPL) “is coming” for DTCC’s $100 trillion fund. Notably, a major factor influencing this bold perspective is Ripple’s underground connection to the system.

In March, Hidden Road became a participant in the DTCC’s Netting System, gaining the ability to clear and settle U.S. Treasury trades.

A month later, Ripple announced acquiring Hidden Road for $1.25 billion. Hidden Road has since confirmed it will use the XRPL for parts of its prime brokerage settlement flow. This potentially brings XRP and its network into the heart of global securities clearing.

XRP’s Role in Settlement and Fee Infrastructure

With XRP acting as the native bridge asset on the XRPL’s built-in decentralized exchange, every settlement on the ledger generates demand for XRP. This positions the asset as a utility token within financial flows, especially as more volume routes through the XRPL.

Meanwhile, Ripple’s stablecoin RLUSD is also part of the equation. Specifically, RLUSD will serve as collateral on Hidden Road’s platform, while XRP will serve as the gas fee asset for XRPL infrastructure.

Community Reacts to Hidden Road and $100T Vision

The XRP community views Ripple’s DTCC-linked expansion as a significant step toward global dominance in settlement infrastructure.

Ripple revealed that Hidden Road used to handle $1.5 trillion annually, but the process suffered from inefficiencies. The integration of the XRPL aims to resolve these issues by reducing settlement times from three days to near-instant.

As Hidden Road integrates into a system that processes over $100 trillion in assets, the pathway for the XRPL to scale into real-world finance is becoming clear.

For many XRP proponents, this confirms a long-term vision in which XRP becomes essential to moving value across high-level financial markets. Some even envision a future where XRP rises from its current $2 value to as much as $10,000 to efficiently serve the high-value market. However, such extreme price predictions remain highly speculative.

Merging XRP and Cardano Would Create an Unstoppable Force: CryptosRus Founder

0

George Tung, the founder of CryptosRus, has praised XRP and Cardano, emphasizing how the two projects could create an unstoppable force.

According to him, XRP and Cardano boast the strongest communities in the crypto industry, highlighting the dedication of each project’s supporters.

XRP and Cardano Have the Strongest Communities

His assertion aligns with the commitment demonstrated by XRP and Cardano community members across social media platforms. Both projects’ communities comprise active developers, influencers, and investors. 

Moreover, Tung also emphasized that both crypto projects have the strongest holders in the industry. His commentary suggests that XRP and ADA investors are willing to hold the tokens irrespective of market dips. 

This was evident during the 2020/2021 market cycle after the SEC charged Ripple with violating federal securities laws, which negatively impacted XRP’s price. Although several investors liquidated their XRP holdings after the lawsuit, many have remained loyal to this day.

An Unstoppable Force

Notably, Tung emphasized that combining the XRP and Cardano projects would create an unstoppable force in the crypto market, given the size and dedication of both communities. 

He asserted in response to renewed ties between the Cardano and XRP ecosystems. Recall that both communities had been at odds for years, stemming from the SEC’s decision to grant Ethereum a “free pass.” 

While Cardano founder Charles Hoskinson pushed against the narrative, he faced resistance from XRP proponents. Meanwhile, Hoskinson ended the hostility last year. He apologized to XRP enthusiasts and proposed several initiatives that would benefit both projects. 

Since then, Hoskinson has been pushing for the potential launch of Ripple USD (RLUSD) stablecoin on Cardano. He is currently discussing with the Ripple team to add Cardano to the list of supported networks for RLUSD. 

In the meantime, he has unveiled several initiatives for the XRP ecosystem. Notably, XRP holders will be eligible for the upcoming Midnight airdrop, which will distribute two tokens, NIGHT and DUST, to 37 million crypto wallets. 

Moreover, Hoskinson announced that XRP will be integrated into Cardano’s light wallet, Lace. This would enable Lace users to store, send, and receive XRP alongside ADA, underscoring the wallet’s multi-chain prowess. 

Furthermore, the Cardano founder proposed leveraging Midnight as the DeFi layer for XRP, allowing XRP holders to earn better yields. At the moment, these proposals are still hanging. 

Nonetheless, Tung believes combining XRP and Cardano will create an unstoppable force in the industry, citing the strengths of both projects’ communities and investors. 

Robert Kiyosaki Says Poor Focus on Price While Rich Look at Quantity, Projecting Bitcoin to $1M by 2030

0

Financial author Robert Kiyosaki has again projected a long-term bullish outlook for Bitcoin while highlighting how the wealthy and poor think.

A few weeks after stating that those who don’t own Bitcoin are losers, Kiyosaki has again identified another mental disparity between the poor and the rich. In a tweet on June 18, the prominent author compared quantity to price and how one’s focus on either would determine one’s financial outcome.

Price Vs Quantity

Having already established that the rich invest in Bitcoin, gold, and silver, while the poor save in “fake” fiat currency, he highlighted another trait that differentiates both factions. According to him, the poor focus on an asset’s price while the wealthy fixate on the quantity they hold.

Although he noted that prices are important, the “Rich Dad Poor Dad” author emphasized the need to prioritize the quantity of Bitcoin, gold, or silver that one has. He suggested that the more of these assets an investor is determined to acquire, the greater their chance of achieving financial freedom.

“While I watch the price of Bitcoin, I focus on how many Bitcoins I own,” Kiyosaki said.

Meanwhile, Kiyosaki revealed that he bought his first Bitcoin at $6,000 and has not looked back since then. Although he did not provide further context on the amount he holds, he wished he had more “fake money” to buy more Bitcoin.

Remarkably, Bitcoin has increased extensively from its first purchase, rallying a staggering 1,646% to its current price. Little wonder, Kiyosaki noted earlier, that Bitcoin made him rich.

Bitcoin Going to $1M By 2030

Furthermore, the financial guru asked a pressing question: “How many ounces of gold, silver, and Bitcoin do you own?” Kiyosaki insisted that the wealthy will be those with the largest stash of Bitcoin, emphasizing the need to consistently expand one’s holdings.

Moreover, Kiyosaki noted that there is a chance that Bitcoin could be trading at $1 million per coin by 2030. Interestingly, he and other industry leaders share the same outlook.

For instance, Binance’s CZ, Ark Invest’s Cathie Wood, and JAN3 CEO Samson Mow have all predicted that Bitcoin would attain a seven-figure valuation, with some expecting it sooner than others.

As a result, Kiyosaki urged those looking to get rich to buy more Bitcoin and focus on how many they own rather than its rapidly changing price. To conclude, the author noted that the quantity you own is more important to your future than Bitcoin’s current price.

At the time of writing, Bitcoin trades at $104,782, nearly 91% away from Kiyosaki’s $200,000 price target by the end of 2025 and 854% off the $1 million valuation projected by 2030.

Analyst Says You Won’t Regret Buying Shiba Inu as You Will Not See SHIB at This Price Much Longer

0

Analyst says you won’t see Shiba Inu at this price much longer, calling attention to an approaching key support and potential for price rebound.

Shiba Inu (SHIB) has shown recent stagnation, with its price hovering between $0.00001142 and $0.00001229. Currently priced at $0.00001164, SHIB has experienced a decline of 1.02% in the past 24 hours and a 9.33% drop over the last seven days. 

Despite the bearish trend, pseudonymous market analyst “Pepe is Friend” suggests that SHIB is nearing an important support zone, potentially setting the stage for a price rebound.

Key Support and Resistance Zones Identified

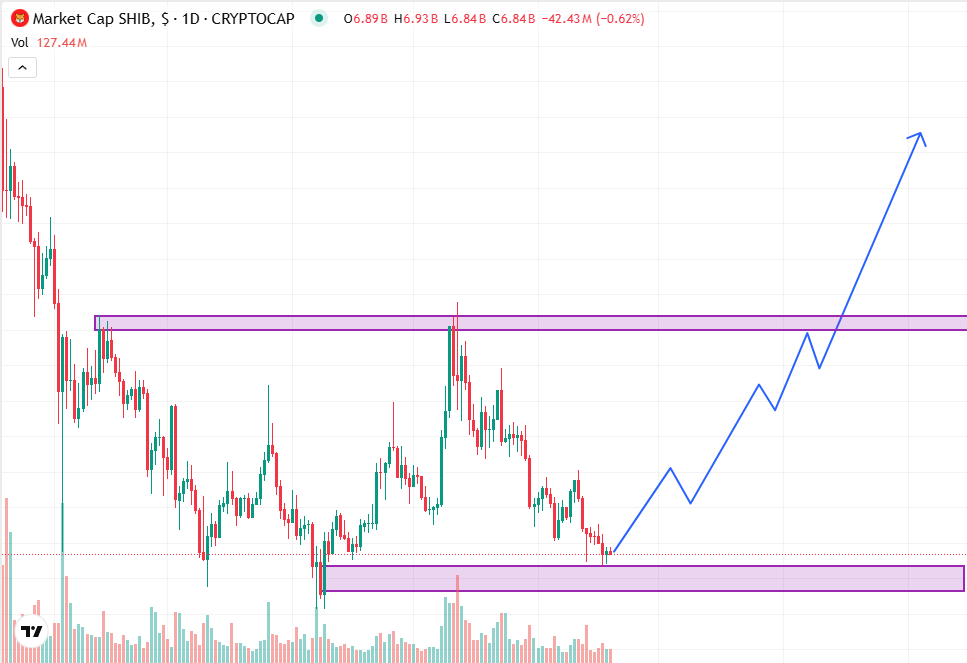
According to his analysis of SHIB’s market cap, Shiba Inu is seeing a series of lower highs and lower lows, indicating an ongoing downtrend. He points to a critical support zone that could offer a potential floor for the price. This support zone, marked by a market cap range around $6.7 billion, has historically acted as a stable price level. 

Image

For instance, in April 2024, when Shiba Inu fell below the $6.08 billion market cap, the bears failed to maintain downward pressure, resulting in a price rebound. If SHIB reaches this support zone again, “Pepe is friend” expects the price to consolidate before any future growth phase.

On the other side, Shiba Inu faces a significant resistance zone around the $10 billion market cap. This level has historically stalled upward momentum. For example, in mid-May 2024, SHIB struggled to break above the $10 billion cap and subsequently retraced to about $7 billion. If SHIB manages to surpass this resistance level, it could signal the beginning of an upward trend toward new highs.

“Pepe is friend” encourages investors to “stay confident and keep holding or even buy more SHIB,” suggesting that the current price level may not last long. He expresses certainty that SHIB’s price will rise from its current levels, implying that. According to him, those who hold will not regret it, as Shiba Inu will not remain at this level for long.

Notably, if Shiba Inu reaches the $10 billion market cap resistance, the price would be approximately $0.00001696.

Two Scenarios for Shiba Inu Price Movement

Elsewhere, another analyst examined SHIB’s potential price movement, with two scenarios outlined for the coin’s future. According to the analysis, if Shiba Inu bounces off the current support range, a bullish scenario could unfold. 

In this case, Shiba Inu might target the descending trendline that has acted as resistance in recent months. This could lead to a price increase to the resistance range between $0.00002174 and $0.00002418, offering potential gains of 80% to 100% from current levels.

Alternatively, if SHIB falls below the $0.00001054 mark, this will invalidate the bullish outlook. In this bearish scenario, the price could continue to decline, with the next major support zone found around $0.00000630.