Home Blog Page 796

Pundit Urges India to Allocate $10B of Forex Reserve to XRP and Bitcoin

0

A top financial expert urges the Reserve Bank of India (RBI) to establish a strategic crypto reserve featuring major assets like Bitcoin and XRP.  

Aravind made the recommendation today, calling on India to immediately create a strategic crypto reserve that the Reserve Bank of India will run. He suggested India start the initiative with four major crypto assets: XRP, BTC, SOL, and ETH. 

He said India could mirror the United States’ crypto reserve structure to establish its digital asset stockpile. This indicates that India does not have to invent its crypto reserve from scratch. Instead, it can develop one using the structure the U.S. has already established. 

Not a Big Deal

Interestingly, he recommends that India start its reserve with a minimum allocation of $10 billion. Many might consider the minimum allocation for India’s crypto reserve as a modest bet compared to the country’s foreign exchange (Forex) reserve. 

India’s Forex reserve is currently above $650 billion, according to data from Trading Economics. Therefore, Aravind believes establishing a crypto reserve with a minimum allocation of $10 billion is not a big deal for India. 

Furthermore, he suggested that the Indian government could raise the funds by exchanging some of its foreign-exchange reserve, which is primarily held in ‘soon to be weak’ fiat currencies.

U.S. Crypto Reserve Initiative  

It is noteworthy that Aravind has been advocating for the creation of a strategic crypto reserve in India. His advocacy peaked last month after U.S. President Donald Trump ordered the creation of one.  

The executive order mandated the creation of a crypto reserve that will hold only Bitcoin and a digital asset stockpile for altcoins. Before the directive, Trump named five cryptocurrencies, including XRP, SOL, ETH, and ADA, as potential candidates of the reserve.

While Aravind urges the Indian government to convert some foreign exchange reserves to crypto, the U.S. aims to create one using digital assets obtained through civil and criminal forfeitures. 

At press time, the blockchain wallet holding the U.S. government’s forfeited crypto assets is worth $17.11 billion, with Bitcoin accounting for $16.73 billion of this valuation. According to the executive order, the U.S. will not raise funds to grow its digital asset stockpile. However, it will only grow the country’s Bitcoin reserve by raising funds through ways outside the country’s budget. 

Since the U.S. ordered the creation of its crypto reserve, other countries have been debating whether to follow its lead. While countries like South Korea and Japan dismissed the notion of holding Bitcoin as a reserve asset, others like Brazil believe the premier cryptocurrency is a crucial tool for national prosperity. 

Trump Urges the Fed to Follow Suit After ECB Slashes Interest Rate by 25 Bps: Here’s How Bitcoin Could React

Bitcoin could benefit as President Trump urges the Federal Reserve to take a similar approach following the ECB’s recent interest rate cut.

Notably, the European Central Bank has slashed interest rate by 25 bps, bringing it down to 2.25%. For context, this marks its seventh consecutive cut since June 2024. The cumulative reduction, amounting to 1.75 basis points from a peak of 4%, represents the ECB’s most aggressive easing cycle among major central banks.

Specifically, the decision was due to concerns over the eurozone’s economic outlook, which has been negatively impacted by escalating U.S. tariffs, including a 20% levy on EU imports.

These trade tensions have introduced uncertainty, leading to weakened growth prospects and inflation falling to 2.2% in March 2025, close to the ECB’s 2% target. The ECB’s rate cuts aim to stimulate spending, borrowing, and investment amid these challenges.

Trump Urges Federal Reserve to Follow Suit

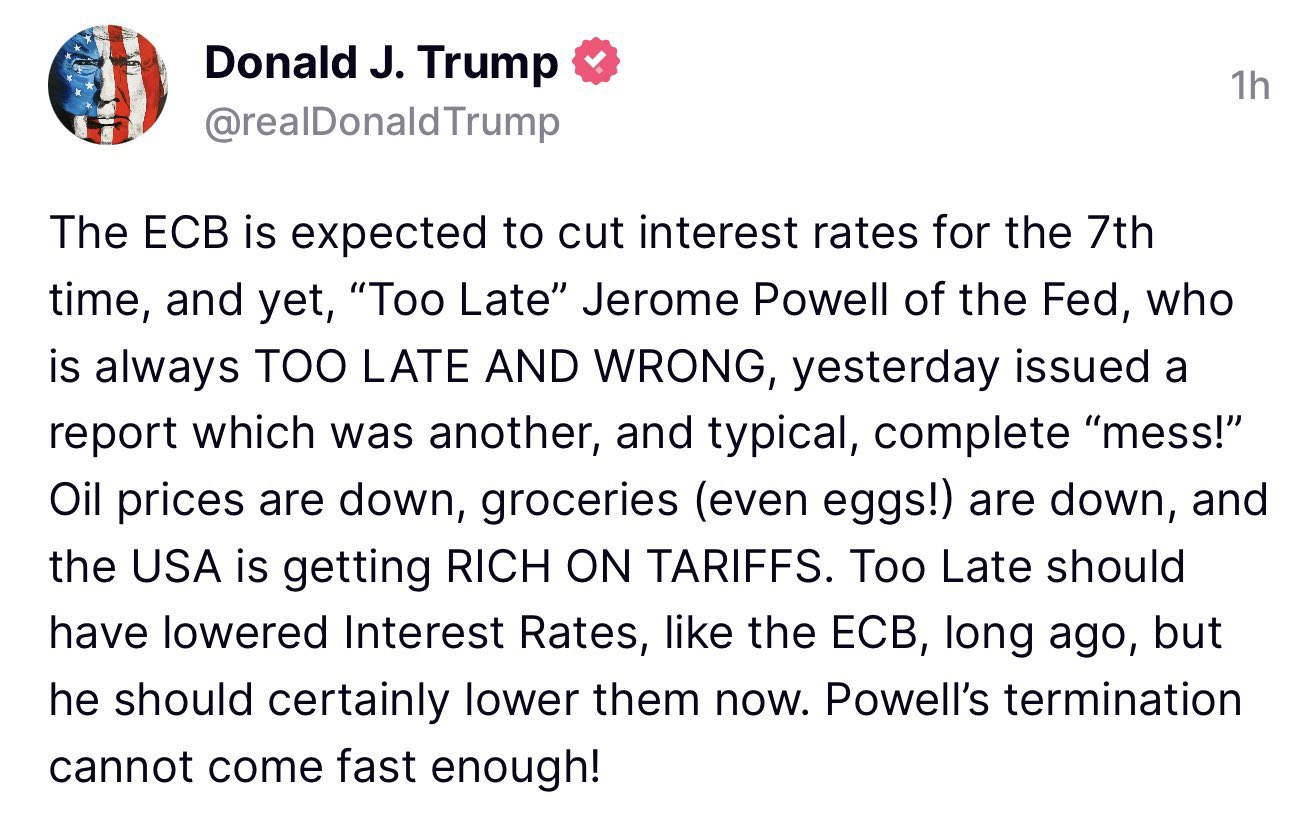
Reacting to the ECB’s latest move, President Donald Trump criticized the U.S. Federal Reserve’s comparatively cautious approach. He expressed his dissatisfaction via Truth Social, lambasting Federal Reserve Chair Jerome Powell for being too slow and often mistaken in his policy decisions.

President Trump on Truth Social

Further, Trump stressed that while global prices such as oil and groceries are decreasing, and tariffs are benefiting the U.S. economy, the Fed still hasn’t acted decisively to support further growth.

Notably, he called for immediate rate cuts and even suggested Powell’s removal from office, indicating a growing political push for looser monetary policy in the United States.

While the ECB is racing ahead with monetary easing, the Federal Reserve has been hesitant. Since September 2024, the Fed has implemented only three rate cuts, totaling 75 basis points, placing the current federal funds rate between 4.25% and 4.50%.

Federal Reserve officials, including Powell, have signaled a wait-and-see approach. They continue to stress the importance of evaluating incoming economic data before making further decisions. This tone looks to maintain financial stability, yet it also places the Fed out of sync with more aggressive central banks like the ECB.

How Could Bitcoin React?

Significantly, these monetary policies could have meaningful implications for risk assets, particularly crypto assets like Bitcoin. The ECB’s rate cuts typically encourage investors to seek higher-yielding alternatives, driving interest in speculative assets, including Bitcoin and crypto.

In contrast, the Fed’s reluctance to cut rates could strengthen the U.S. dollar, placing downward pressure on dollar-denominated assets like Bitcoin by making them less attractive to international investors.

Bitcoin has already shown signs of reacting to these macroeconomic headwinds. After a steep correction that saw the cryptocurrency fall below the $80,000 level, it has since regained ground, currently trading around $84,052.

However, it remains in a struggle between bullish optimism and bearish pressure near the $85,000 resistance zone. The uncertainty surrounding the Fed’s next policy move is adding to this volatility, leaving Bitcoin traders cautious.

Market participants, particularly in the crypto scene, are now looking at the Federal Reserve’s next rate decision early next month, which will likely contribute to the next price direction.

Should the Fed pivot towards a more dovish stance and announce further rate cuts, Bitcoin could experience renewed buying momentum as liquidity returns. Conversely, continued restraint by the Fed could suppress investor appetite for high-risk assets, prolonging Bitcoin’s sideways or downward trajectory.

Another Market Raid? Strategy Chairman Michael Saylor Says “Bitcoin Is Calling”

0

Strategy chairman Michael Saylor has raised eyebrows within the crypto community after teasing “Bitcoin is calling” in his latest post.

The staunch Bitcoin advocate has a history of audacious Bitcoin claims. Interestingly, he has backed his belief in the pioneering crypto asset with incessant acquisitions through the self-acclaimed Bitcoin Treasury firm, Strategy.

While he has made several quotes about Bitcoin this week, such as comments that Bitcoin is like chess and 21 million (Bitcoin’s maximum supply) is the most important number in finance, his tweet today is sparking curiosity in the crypto community.

“Bitcoin is Calling,” Saylor’s cryptic Thursday tweet said.

Another Market Raid?

While Saylor did not provide further context for the tweet, some reactions suggest he was referring to stacking more sats. Notably, the Strategy (formerly MicroStrategy) executive chairman has been big on incessantly buying Bitcoin for the foreseeable future.

Strategy recently bought 3,459 BTC ($285.8 million) on Monday, resuming its weekly acquisition after a one-week pause. This continued acquisition has persisted despite Bitcoin’s market uncertainty, which has resulted in all but two of its purchases since November 18 being in the red.

Nonetheless, some believe Saylor’s recent tweet suggests they could buy more, as the Strategy Chairman often makes such teasing remarks before another purchase.

Furthermore, his tweet also called on his 4.2 million followers to answer the Bitcoin call and secure the asset, which he described as the future of money.

Strategy Reaps from Bitcoin Bet

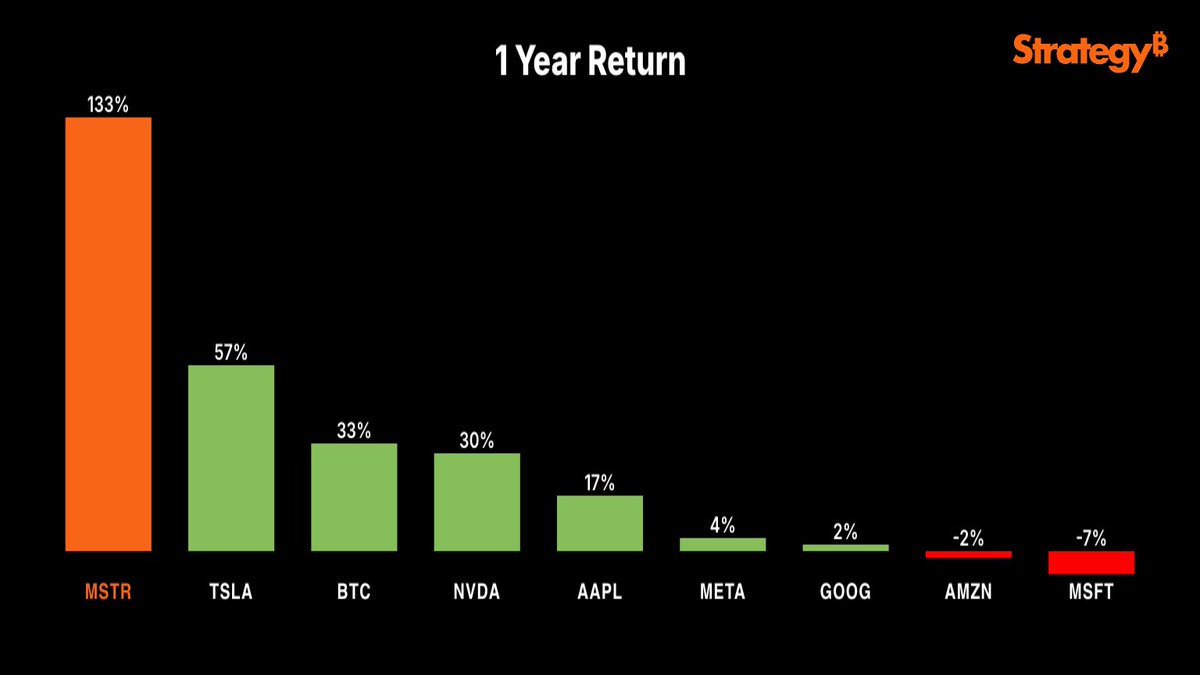
Meanwhile, this post follows a Wednesday disclosure revealing Strategy’s stock performance compared to companies he described as the “Magnificent 7.” He noted that Bitcoin is the strategy to outperform them, evident in MSTR’s impressive 133% one-year returns.

This figure trounces that of Elon Musk’s Tesla (57%) and chipmaker NVIDIA (30%). MSTR has also outperformed Apple (17%), Meta (4%), and Alphabet (2%).

Notably, other prominent firms like Amazon and Microsoft have incurred 2% and 7% declines in the same timeframe, establishing the reward of Strategy’s potent bet on Bitcoin.

Strategy’s 1-Year Performance Compared to Major Assets

Other Bullish Saylor Bitcoin Comments

The Strategy executive chairman has recently been in the news for other pro-Bitcoin comments. Two weeks ago, he stated that Bitcoin’s volatility reflects its usefulness.

In response to a reference to Bitcoin’s correlation with risk-on assets, Saylor noted that it is because it is the most liquid, salable, and accessible asset on the planet.

Moreover, a day before the comment, Saylor had reinforced Bitcoin’s uniqueness among other commodities by stating there is no tariff on the asset. The statement highlighted Bitcoin’s digital and liquid features as a major part of its decentralized nature.

Can Shiba Inu Surge 8,233% to 83,233%, Here Are the Facts

0

Shiba Inu has been the subject of multiple bullish predictions recently, but its potential to claim some of these targets remains uncertain.

Notably, most of these targets have sprung up now that the market is grappling with widespread uncertainty among investors. Particularly, the global crypto market cap has slumped 17.3% year-to-date, now standing at $2.63 trillion. Following this trajectory, SHIB has collapsed 43.17% within the same timeframe.

Shiba Inu Investors Remain Confident

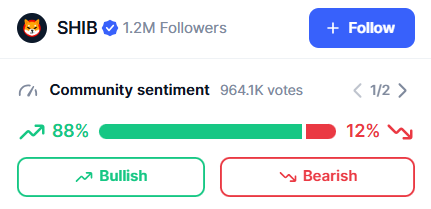
However, this bearish turn of events has not completely dampened investor sentiment. Interestingly, according to CoinMarketCap data, Shiba Inu community sentiment is currently 88% bullish and just 12% bearish. This is from over 964,000 community votes, covering a large audience.

Shiba Inu Community Sentiment CoinMarketCap
Shiba Inu Community Sentiment | CoinMarketCap

These bullish sentiments are mostly due to confidence in Shiba Inu’s resurgence. Recently, The Crypto Basic confirmed that a panel of industry leaders surveyed by leading fintech platform Finder believes Shiba Inu will recover to trade at a much higher price by the end of the year. 

Besides promises of a resurgence, several analysts have teased loftier price targets for Shiba Inu, with the $0.001 and $0.01 goals being some of the most discussed. For instance, last September, analyst Krao suggested that a Shiba Inu descending trendline breakout could eventually lead to the $0.001 price target.

In addition, market commentator Luis Delgado argued in July 2024 that Shiba Inu to $0.01 is a certainty, citing Dogecoin’s meteoric run from $0.0001 in August 2014 to $0.01 in December 2017. Also, Shiba Inu ecosystem marketer Lucie believes the $0.01 target is achievable, but insists it could take some time.

Can SHIB Rise 8,233% to $0.001 or 83,233% to $0.01?

However, it is important to assess how feasible these targets actually are. Notably, Shiba Inu currently trades for $0.000012 at press time, holding above the $0.00001 level despite the ongoing correction. 

From this position, SHIB would have to rally by a massive 8,233% to reach the $0.001 target. Meanwhile, a run to the more ambitious $0.01 mark would demand a massive 83,233% from current levels. While the $0.001 price might be within reach in the coming years, a $0.01 target seems largely speculative.

Notably, an assessment of these targets’ market impact shows that Shiba Inu will boast a $589 billion valuation if it reaches $0.001, considering its 589 trillion supply. This would represent an additional $582 billion in market valuation, as SHIB currently has a market cap of $7 billion.

At this $7 billion valuation, SHIB has a market dominance of 0.266%, as the global crypto market is valued at $2.63 trillion. If Shiba Inu’s market dominance increases to 1% and the crypto market expands to $58.9 trillion, then SHIB’s market cap can technically rise to $589 billion. However, this depends on the extent of the broader market growth.

Meanwhile, the $0.01 target translates to a market cap of $5.89 trillion for Shiba Inu. This is considerably larger than the current global crypto market cap. Also, for Shiba Inu to hold this valuation at a 1% market dominance, the broader crypto market cap would have to rise to $589 trillion. 

Notably, this figure is larger than the estimates for total money supply globally, currently at $583 trillion. As a result, for Shiba Inu to claim a $5.89 trillion market cap, it would have to dominate a much larger share of the broader crypto market. For now, this valuation remains technically improbable.

Top Analyst Identifies 3 Favorable Zones to Go Long on Bitcoin Price

0

Analyst Castillo Trading identifies key Bitcoin entry zones, highlighting levels for potential long positions ahead of a projected correction.

Bitcoin has seen notable volatility recently, dipping below $80,000 multiple times last week before rebounding to a peak of $86,000. Meanwhile, it is now trading around $84,295, up 0.53% on the day and 3.41% over the week.

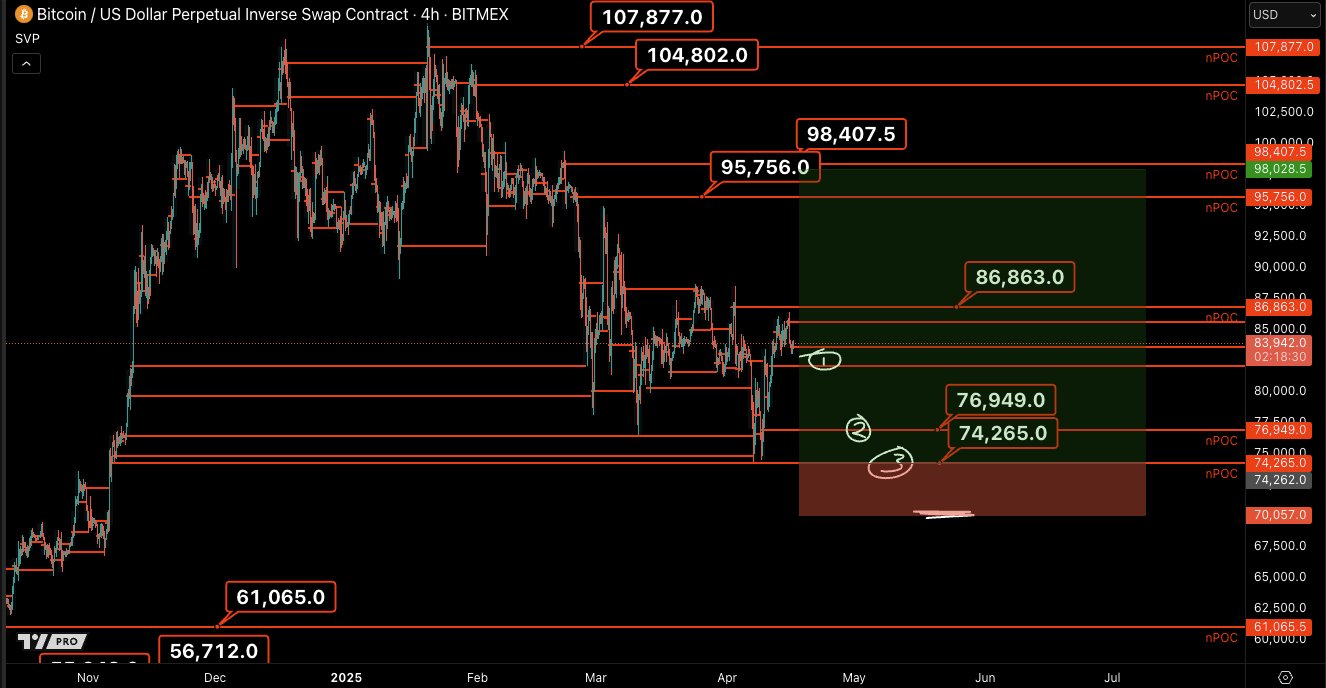
Notably, Bitcoin’s recent volatility has brought several critical resistance levels into focus. According to a chart shared by analyst Castillo Trading, several Naked Point of Control (nPOC) levels act as potential price barriers for Bitcoin’s uptrend.

These nPOC zones represent significant areas of historical volume and price interest, where reversals or consolidations often occur. The key levels include $107,877, $104,802, $98,407, and $95,756. Each is acting as a potential resistance zone where price action could reverse if Bitcoin moves upward.

Image
A Bitcoin chart by Castillo Trading

For context, an nPOC is a high-volume price level from a prior session that hasn’t been revisited in subsequent days. Like price gaps, nPOCs are often eventually tested and tend to act like magnets, drawing the price back to them.

Long Entry Zones for Bitcoin

In the analysis, Castillo Trading highlighted key entry zones where he considers long positions. The analyst suggests that the most favorable entry points lie between the $82,000 and $75,000 price range. He also identifies areas around $82,000, $76,949, and $74,265. 

Notably, the analyst has chosen these levels based on nPOC, as they can offer support if Bitcoin sees a price correction. Essentially, he is expecting a major rebound for BTC after a correction by setting long positions from those points.

Large Holder Behavior and Staking Developments

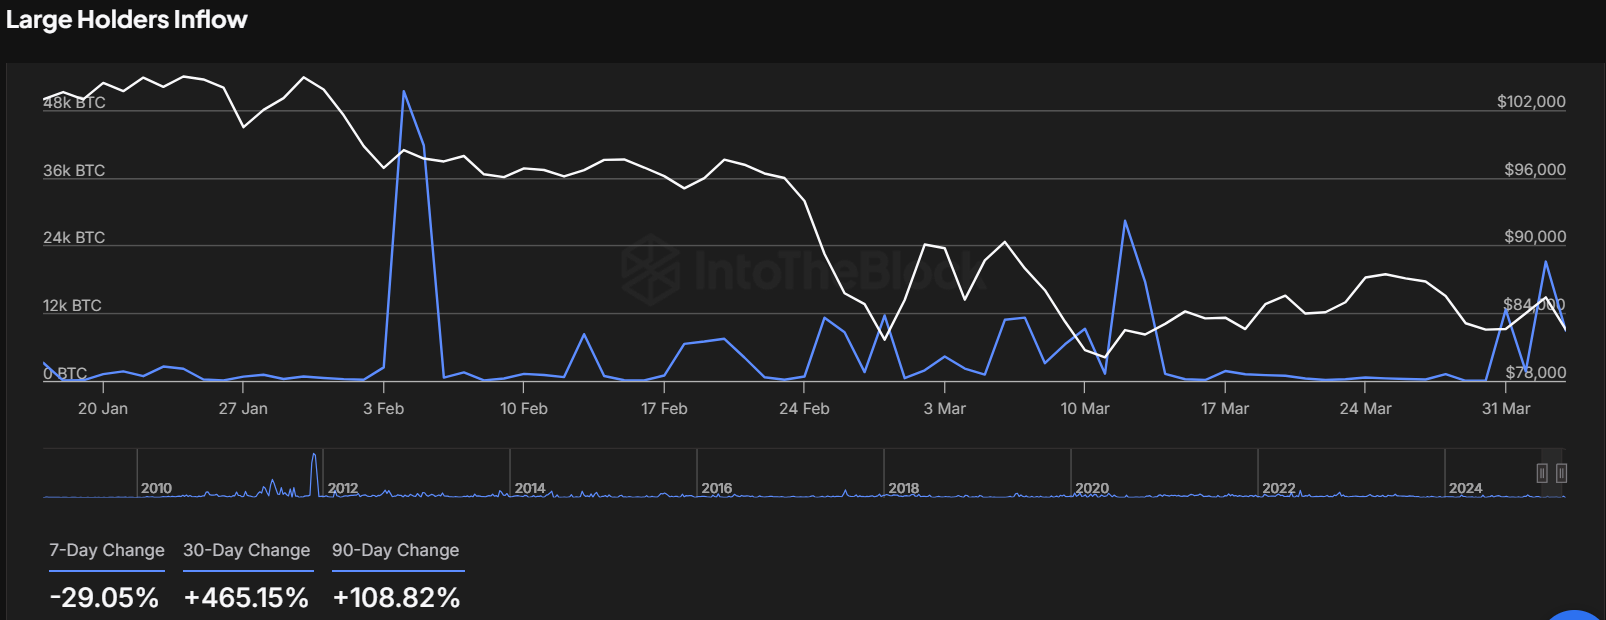
Meanwhile, an analysis by IntoTheBlock reveals a decline in large holder inflows, which supports the bearish sentiment in the short term. Specifically, large holders’ inflows have decreased by 29.05% over the past week. This suggests that the larger market players are less active.

Bitcoin Large Holder Inflows

On the other hand, over the past month, large holder inflows have surged by 465%, reflecting a significant increase in Bitcoin accumulation during this period. Over the past 90 days, the trend has also been positive, with a 108% increase in large holder inflows.

Adding to the recent market dynamics, $1.26 billion worth of Bitcoin (14,929 BTC) was recently unstaked from the Babylon decentralized staking platform. The event coincided with a brief price dip from $85,164 to $83,500, highlighting the impact of large-scale transactions on Bitcoin’s price.

User Turned $15 into $700,000 on Dogecoin and then Lost It

0

A user reminisces about missing a staggering 4,666,566% return on investment from his lost Dogecoin holding, which he had acquired for just $15.

The crypto space is filled with mind-blowing stories of significant losses and gains. The volatility common in the crypto market has seen users turn peanuts into life-changing returns, as well as lose fortunes in the pursuit of elusive gains.

One user, on a lucky streak, threw in a mere $15 on Dogecoin, the largest meme coin by market capitalization. At the time of his purchase, the amount could buy a whopping 1 million DOGE, culminating in an average price of $0.000015 per coin.

Unfortunate User Misses Gains

Meanwhile, little did he know that his $15 investment would appreciate by 4,666,566% one day. The X user, with the username “Simulated Fleshnamics,” narrated his ill-fated story in a recent thread about how he missed Dogecoin’s impressive run despite buying the asset early enough.

According to the user, he lost his 1 million Dogecoin in 2015, when the original meme coin was struggling to gain traction. However, the asset rose to $0.0186 in January 2018, consolidated for two years, and then surged again to its all-time high of $0.7488 in 2021.

While other early buyers basked in profit, the user bemoaned his lost DOGE. At around the asset’s all-time high, his $15 initial investment has surged multiple times to $700,000, marking a 4,666,566% return on investment.

Even at the current price, which is 79% off the 2021 high, the stash would also be worth thousands of dollars. For perspective, at $0.1567 today, the 1 million DOGE is worth $156,700, a 1,044,566% uptick from $15.

A Similar Story on Bitcoin

Meanwhile, Simulated Fleshnamics’ narration comes on the heels of a similar plight for an early Bitcoin whale. Another user, Griffin McShane, revealed he lost his seed phrase to a Bitcoin goldmine worth $163 million.

He noted in a tweet that he bought Bitcoin in 2015 at a bargain price, accumulating 1,914 BTC at an undisclosed price in a decentralized wallet. The accompanying screenshot shows that the asset has surged extensively since then to a valuation of $162.8 million, possibly acquired with a meager capital.

Screenshot of User’s Wallet

However, he has lost his seed phrase, making the asset inaccessible. Notably, these events highlight a major drawback of blockchain technology: the difficulty users face in recovering their lost wallet keys.

While this has its advantages, millions of dollars’ worth of cryptocurrencies lie dormant and inaccessible due to misplaced passphrases or wallet addresses.

Nonetheless, the event also echoes the profitability of holding cryptocurrencies. Although very volatile, the sector has a long history of creating life-changing wealth for patient market users.

Bitcoin Eyes $86k Breakout: Will BTC Price Breakout Run Top $95k?

Bitcoin is eyeing an $86k breakout, with bullish patterns and strong ETF inflows hinting at a potential rally toward the $95k mark.

At $84,883, Bitcoin is signaling a potential recovery with an intraday surge of nearly 1%. The BTC price action suggests forming a new sharp pattern that could drive a rally.

However, the recovery is gradually approaching crucial resistance at $86,000, which has kept the bulls in check over the past week. Will Bitcoin manage to break through and reach the $95,000 mark?

Bitcoin Price Analysis Teases Breakout Run to $95k

On the daily chart, Bitcoin’s price action shows a breakout rally from a falling wedge pattern, although it struggles to gain momentum. The recent recovery in Bitcoin started from the $76,000 demand zone, overcoming the local resistance trendline.

Bitcoin Price Chart
Bitcoin Price Chart

However, the bullish reversal fails to surpass the 61.80% Fibonacci retracement near $86,150. This crucial resistance has led to multiple higher price projections this week. 

Nevertheless, with the intraday recovery followed by Doji formation yesterday, Bitcoin hints at a morning star pattern. This is a trend reversal pattern hinting at a post-retest reversal. 

The MACD and signal lines are maintaining a positive flow, supporting the chances of an extended recovery. The average lines are on the verge of entering positive territory with a new cycle of bullish histograms. 

Furthermore, the daily RSI line witnesses an uptick after maintaining a sideways shift near the halfway level. This reflects a growth in bullish momentum. 

Based on the Fibonacci levels, if Bitcoin surpasses the 61.80% retracement level near $86,150, the uptrend could hit the 78.60% Fibonacci level. 

This crucial Fibonacci resistance is close to the $95,000 mark. On the flip side, the crucial support below the trend line remains at a 50% level near the $80,000 mark.

Bitcoin ETFs

As Bitcoin projects a potential extended recovery, Eric Balchunas, a Bloomberg ETF specialist, highlights significant positive inflows in Bitcoin ETFs. The analyst noted that BlackRock’s Bitcoin ETF, IBIT, has seen a year-to-date inflow of nearly $2.4 billion.

In the 15 months since Bitcoin ETFs’ inception, they’ve faced several selling pressures, including FTX refugees, GBTC discounters, legal unlocks, government confiscations, and macroeconomic turmoil. Despite these challenges, the underlying strength of Bitcoin ETFs remains, increasing the possibility of larger future inflows.


Analyst Identifies Source of BTC Selling Pressure

As Bitcoin ETFs remain strong, a recent technical insight from Crazzyblockk, an analyst on Cryptoquant, sheds light on real selling pressure in Bitcoin. According to the post, short-term holders are the primary sellers, dumping an average of nearly 930 BTC per day.

In comparison, long-term holders moved 529 BTC per day. This indicates significant supply growth from short-term holders, fueling the current selling pressure.

Furthermore, the analyst highlights that shrimps, fish, and sharks are the biggest sellers based on Wallet Cohort data. Shrimps, holding less than 1 BTC, dump 480 BTC per day, while the fish category, holding 10-200 BTC, dumps 341 BTC daily.

Interestingly, sharks, holding 100-1,000 BTC, drop 402 BTC daily into the market. This suggests that the real selling pressure is coming from smaller and mid-sized investors rather than large whales and long-term holders.

In conclusion, the short-term pullback is a classic example of a short-term holder shakeout.

On-Chain Data Reveals Bitcoin at a Crucial Crossroad

As Bitcoin prepares for a breakout rally, Ali Martinez, a crypto analyst, points out that the BTC price is at a crossroads. Based on the In/Out of the Money indicator, Ali highlights that Bitcoin is stuck between two major supply zones.

The demand zone extends from $81,411.38 to $83,868.67, holding 709.3k BTC in 953.84k addresses. On the other hand, the overhead supply zone, extending from $83,975.51 to $86,432.81, holds 718.68k BTC in 1.35 million addresses.

While the volume is similar, the number of addresses on the bearish side is significantly larger. However, if Bitcoin surpasses the $86,000 mark, an uptrend could reach the $93,911.54 to $96,475.68 supply zone, which holds 745.8k BTC in 1.19 million addresses.

SUI Price Targets $3 Amid Wedge Breakout Rally Chances

SUI holds firm at $2 as wedge breakout nears. Traders eye a bullish reversal toward $3 amid rising stablecoin supply and Greek partnership news.

As Bitcoin fluctuates near the $84,000 mark, altcoins like SUI struggle to regain bullish momentum. Currently, the SUI token trades at a market price of $2.0921, struggling to hold ground over the $2 psychological level. 

Despite the SUI network witnessing a record-high stablecoin supply and an optimistic outlook from analysts, the altcoin is down 7.38% this month. Will the prevailing downtrend continue toward the $1.68 support level?

SUI Price Holds Above $2, Nearing Potential Breakout

On the daily chart, the SUI token’s price action reveals a wedge pattern at play. Within this declining pattern, the bearish trend in SUI accounts for a pullback of nearly 60%.

SUI Price Chart
SUI Price Chart

Furthermore, the price has dropped below the 38.20% Fibonacci retracement level at $2.20. In late January, the decline also breached the bullish line of the super trend indicator, triggering a bearish trend.

Currently, the super trend indicator’s bearish line remains at $2.6593. To restore a new bullish trend, the price must exceed $2.65.

At press time, SUI is holding above the $2.00 psychological level despite a bearish reversal from the overhead resistance trendline. After forming four consecutive bearish candles, accounting for a price drop of 12.43%, SUI has created a minor bullish candle.

With an intraday recovery of 2%, bulls aim to rechallenge the overhead trendline. As the SUI price approaches the apex of the wedge pattern, traders are anticipating a high-momentum rally on either side.

The daily RSI line hints at a potential bullish recovery, as it bounces back toward the midpoint after hovering above the oversold boundary. Based on the Fibonacci levels, a potential breakout could reclaim the $3.00 psychological level at the 23.60% Fibonacci retracement. On the downside, the key support remains at the 50% Fibonacci level at $1.68.

SUI Gets Major Partnership in Greece

The potential for a bullish comeback in SUI is further supported by the recent partnership in Greece. Greece’s National Stock Exchange has teamed up with the SUI blockchain to deliver a fully on-chain fundraising platform.

This partnership, built on the SUI blockchain, is a key milestone in its roadmap.

Further Support for SUI Price Growth

Additionally, the SUI network’s stablecoin supply has reached a new all-time high. According to a recent tweet by Torero Romero, the SUI stablecoin supply has reached $746.81 million, reflecting a year-to-date change of 99.82%. With increased liquidity on the SUI blockchain, network activity could see a surge.

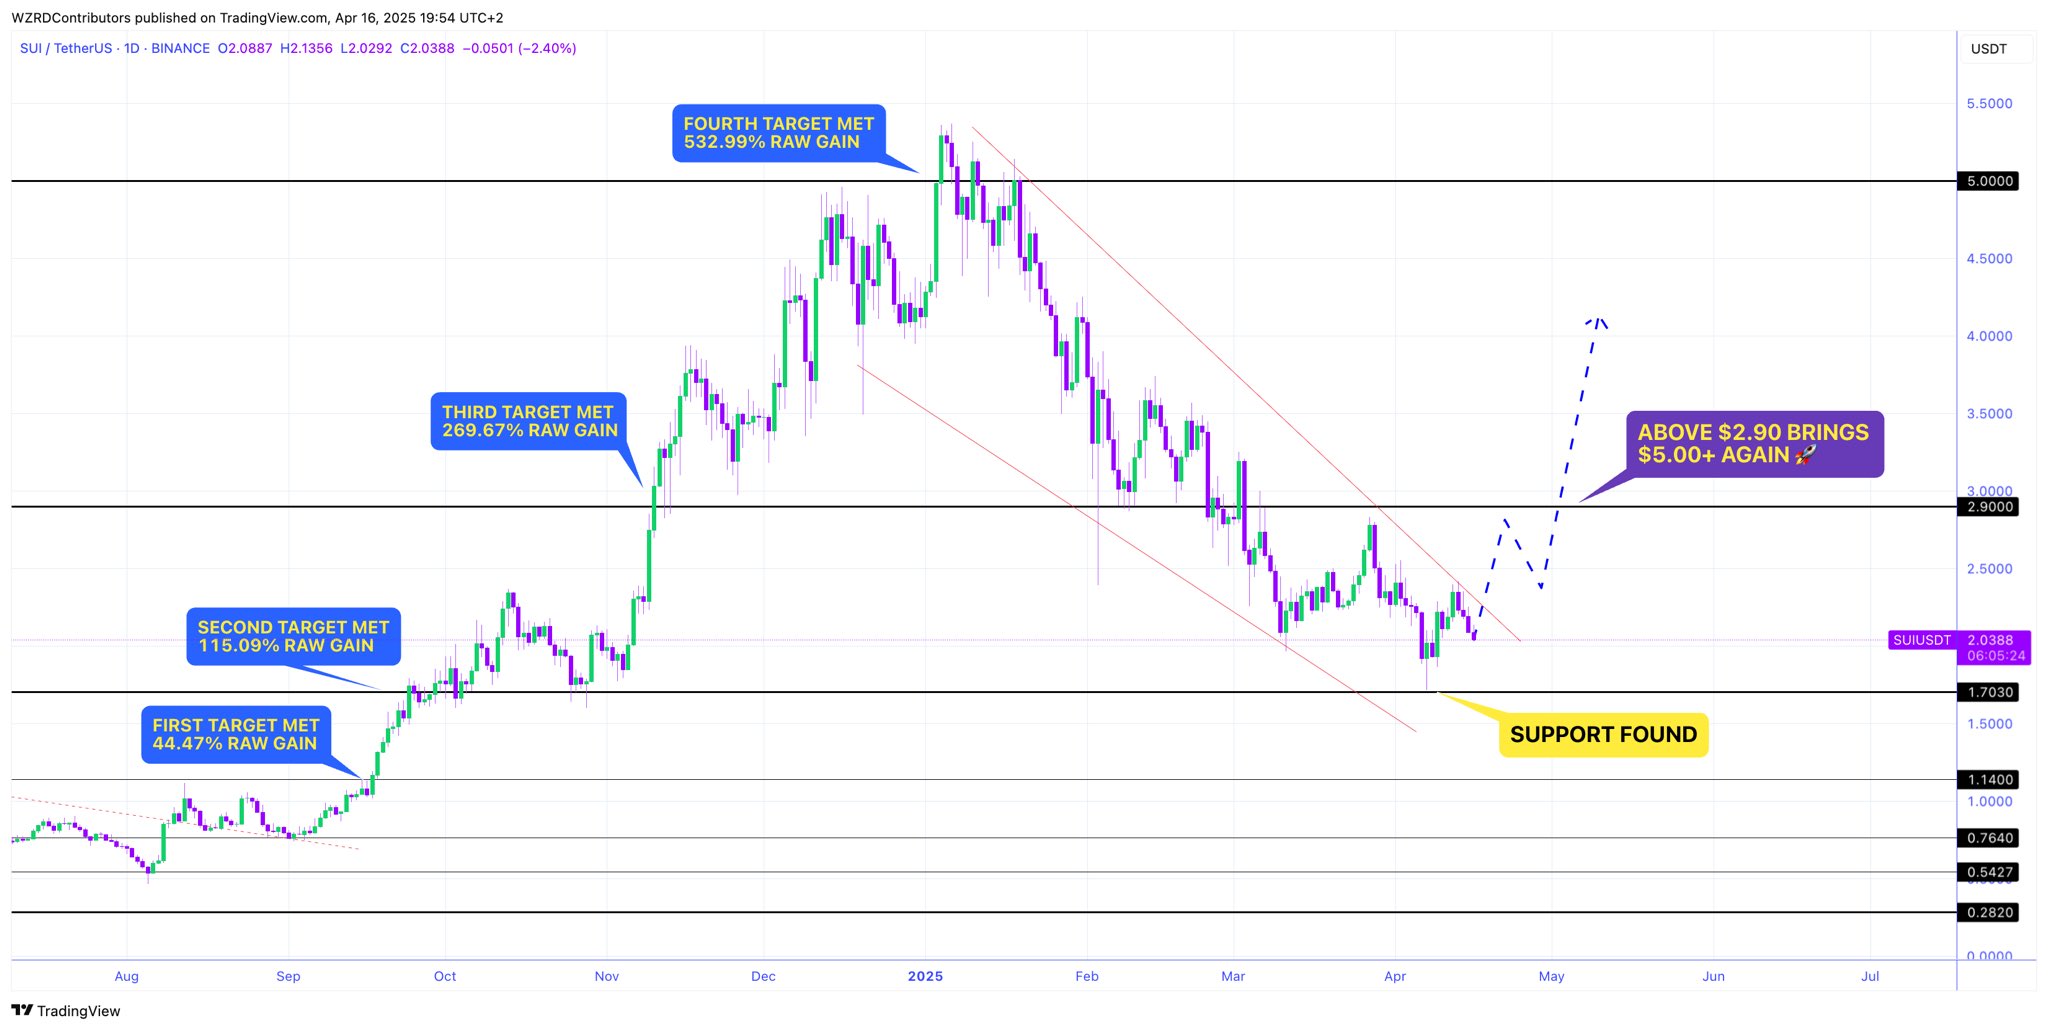
Furthermore, analyst CryptoWZRD signals a potential 560% surge for SUI. The analyst highlights that SUI mirrors the BTC price trend and aims for a falling wedge breakout rally. Based on this analysis, a surge beyond the $2.90 mark could push SUI prices to $5.

Image

Analyst Says Patience Most Important Ingredient for Cardano, Targets $10 Amid Cup n Handle Pattern

Analysts suggest patience is key for Cardano recovery, with a bullish Cup-and-Handle formation and a long-term resistance level pointing to potential growth.

The price of Cardano (ADA) has experienced fluctuations in recent days, notably aligning with the broader market. After an initial recovery between April 11 and 12, the cryptocurrency saw its price retrace again to a range of $0.63 to $0.66 from April 13 to 15. 

By April 15, the downtrend intensified, with the price hitting lows around $0.60 before slightly recovering to $0.62. As of today, ADA stands at $0.6152, marking a 1.04% increase over the last 24 hours, but a 0.76% decline in the past week. Despite these struggles, analysts remain cautiously optimistic about Cardano’s potential.

Analyst Suggests Patience Amid Fluctuations

For instance, analyst Dan Gambardello has emphasized the importance of patience for Cardano holders. Gambardello, known for his insights on the crypto market, shared a chart on X showing a potential recovery phase for ADA. 

Cardano Price Prediction | Dan Gambardello

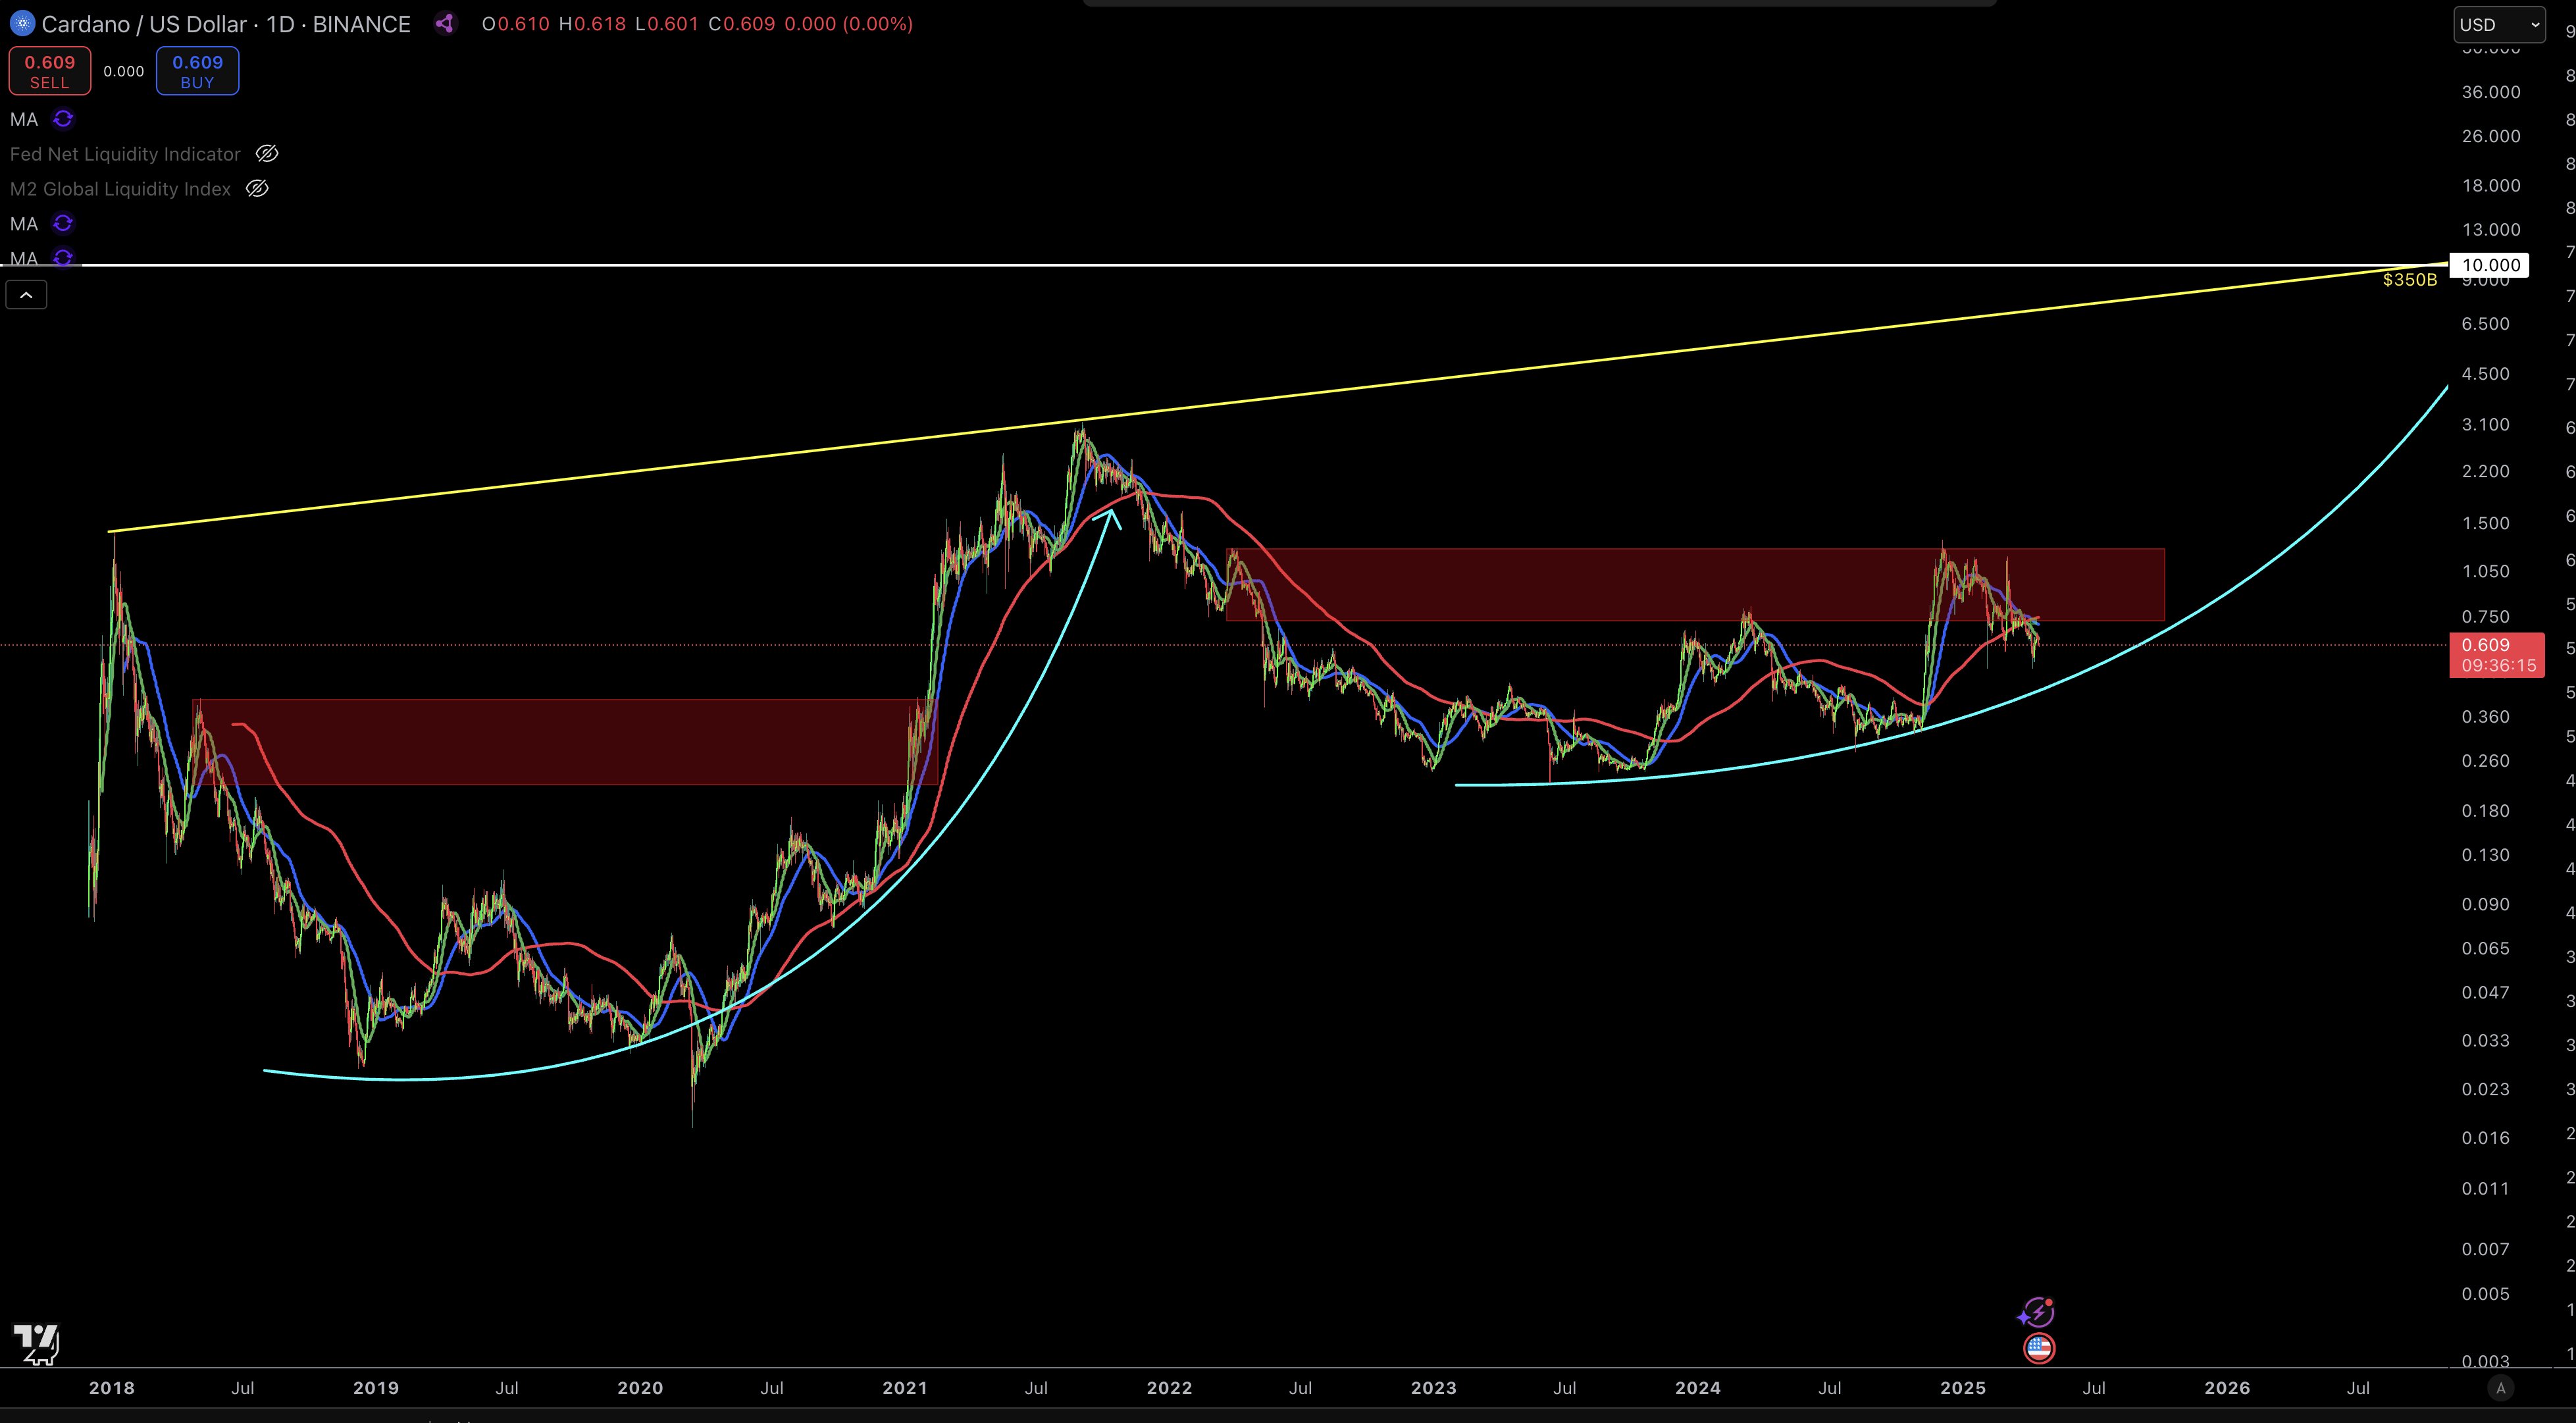
The chart suggests that Cardano could be in the early stages of a rebound, similar to the one it experienced amid the major bull run in 2021. Gambardello pointed out that the coin’s price patterns from 2018 to 2025 resemble a Cup-and-Handle formation, a bullish technical pattern that signals potential long-term growth.

The Cup-and-Handle Pattern

Notably, the formation Gambardello highlighted includes both the “cup” and the “handle” components, which have been key indicators of previous bullish trends.

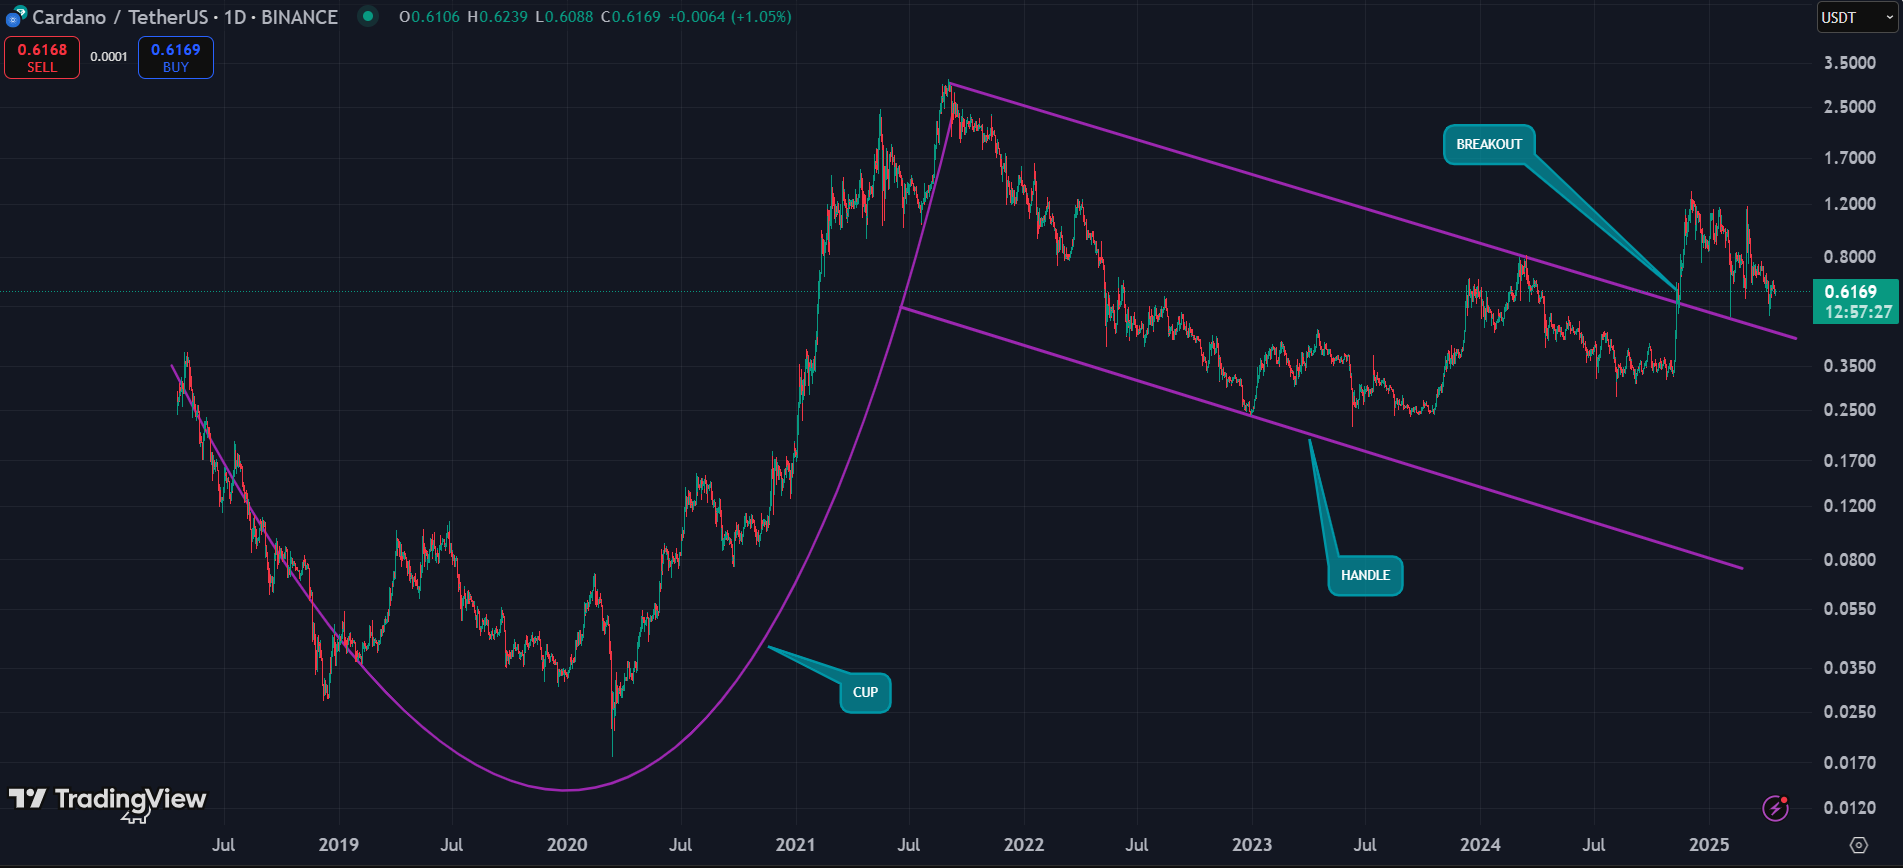
For context, the “cup” part of the pattern, seen between 2018 and 2021, shows Cardano’s price starting from a low point, peaking around $1, and then experiencing a downward correction. The price then reached a bottom near $0.023, followed by another upward move that peaked at nearly $3.10.

Cardano Cup and Handle Pattern

Meanwhile, the “handle,” which typically represents a smaller pullback, formed between September 2021 and 2024. Cardano recently broke above the handle during the November 2024 upsurge and is currently retesting this breakout. This phase could be setting the stage for a larger price surge once the retest completes, and Cardano maintains the support at the handle.

Resistance Levels and Future Projections

In addition, Gambardello’s chart shows that the trendline in Cardano’s price movement serves as a long-term resistance level, currently pointing towards $10. This resistance stems from the highs observed in 2018, and ADA’s current price movement suggests it may attempt to touch this level once again. 

In March, the price also reached $1.14, completing a formation similar to the one that triggered the price run to its all-time high in early 2021. 

Further Belief in Cardano’s Potential

Meanwhile, Cardano has continued to draw attention from other influential figures in the crypto space. Alex Becker, a crypto investor Cardano critic, recently acknowledged his confidence in ADA’s potential, despite previous criticism of its community. Becker identified Cardano as one of the standout altcoins for the current bull market, with price targets as high as $4 to $5. 

His assessment highlights the coin’s untapped potential compared to other top-layer projects, such as Solana, which has already seen significant price increases. According to Becker, Cardano’s relative lack of upward movement positions it well for potential gains.

Ethereum Whales Exit, Derivatives Inflow Surges: Will ETH Crash to $1,000?

Ethereum struggles near $1,600 as whales offload 143K ETH and derivatives inflows spike. Will ETH crash below $1,400?

With Bitcoin stagnating near $84k, Ethereum fails to trigger a trendline breakout rally. ETH is currently trading at $1,581, following the formation of a daily Doji candle.

As Ethereum continues to underperform, whales have begun offloading this week, and the network has recorded a new low. Can Ethereum manage to hold the $1,400 support level amidst these conditions?

Ethereum Stuck at a Crossroads: Will Bears Take Control?

Ethereum fails to bounce back within the falling channel pattern in the daily chart. Facing opposition from a newly formed resistance trendline within the channel, the ETH price fails to float above $1,600. 

Ethereum Price Chart

The higher price rejection in the recent daily candle with long wicks warns of a potential drop ahead. However, technical indicators suggest an optimistic chance. 

The daily RSI line shows a sideways movement, hovering just above the oversold boundary after a slight uptick. Additionally, the MACD and signal lines have given a positive crossover, albeit still within negative territory.

These technical signals indicate the possibility of a new bullish wave within the ongoing decline.

Based on Fibonacci levels, a breakout rally could first target the 23.60% Fibonacci level near $2,000. If bulls manage to break above the upper boundary, the 38.20% level near $2,400 becomes the next likely price target.

Conversely, Ethereum shows strong support around $1,400. A daily close below this level could trigger a potential drop toward $1,000.

Ethereum Offloading Season Begins?

Over the past week, Ethereum experienced a minor surge followed by stagnation, prompting whales to exit. According to a recent tweet by crypto analyst Ali Martinez, Ethereum whales have offloaded 143,000 ETH, valued at over $226 million.

This significant offloading has reduced the balance of wallets holding 100–1,000 ETH from 9.4325 million to 9.2894 million. One notable case stands out.


One standout case: a long-dormant whale returned to the market after two years and deposited 1,161.77 ETH (worth $1.84 million) into Kraken.

The entity realized a profit of $ 480 K. Initially, the whale withdrew 943 ETH (then worth $1.11 million) from Binance and later swapped 253.73K USDC for 146.59 stETH for staking.

By staking Ethereum, the whale earned an additional 72 ETH.

Lowest Ethereum Transaction Costs in Five Years

Amid falling ETH prices, the network has hit a five-year low in transaction fees. According to Santiment, Ethereum’s average network fee has dropped below $0.17 for the first time since May 2020. Currently, the average transaction costs just $0.168.

Declining fees suggest weakening demand and reduced user activity, both potential precursors to a lower ETH market valuation.

Inflow Spike in Derivatives Market Warns Major Crash Ahead

As Ethereum struggles at a crossroads with the shaken confidence of whales, the derivatives market records a massive inflow. Historically, major inflow spikes in Ethereum derivatives have resulted in major crashes. 

On March 26, an inflow of nearly 65K ETH led to a 13% drop over four days. A similar spike last week resulted in a nearly 20% decline.

On April 16, the largest spike yet — over 77K ETH — triggered fears of a deeper correction.

As Ethereum struggles to hold bullish ground, the increased inflow spike could lead to a leverage-driven downfall to $1,000. 

quicktake-image

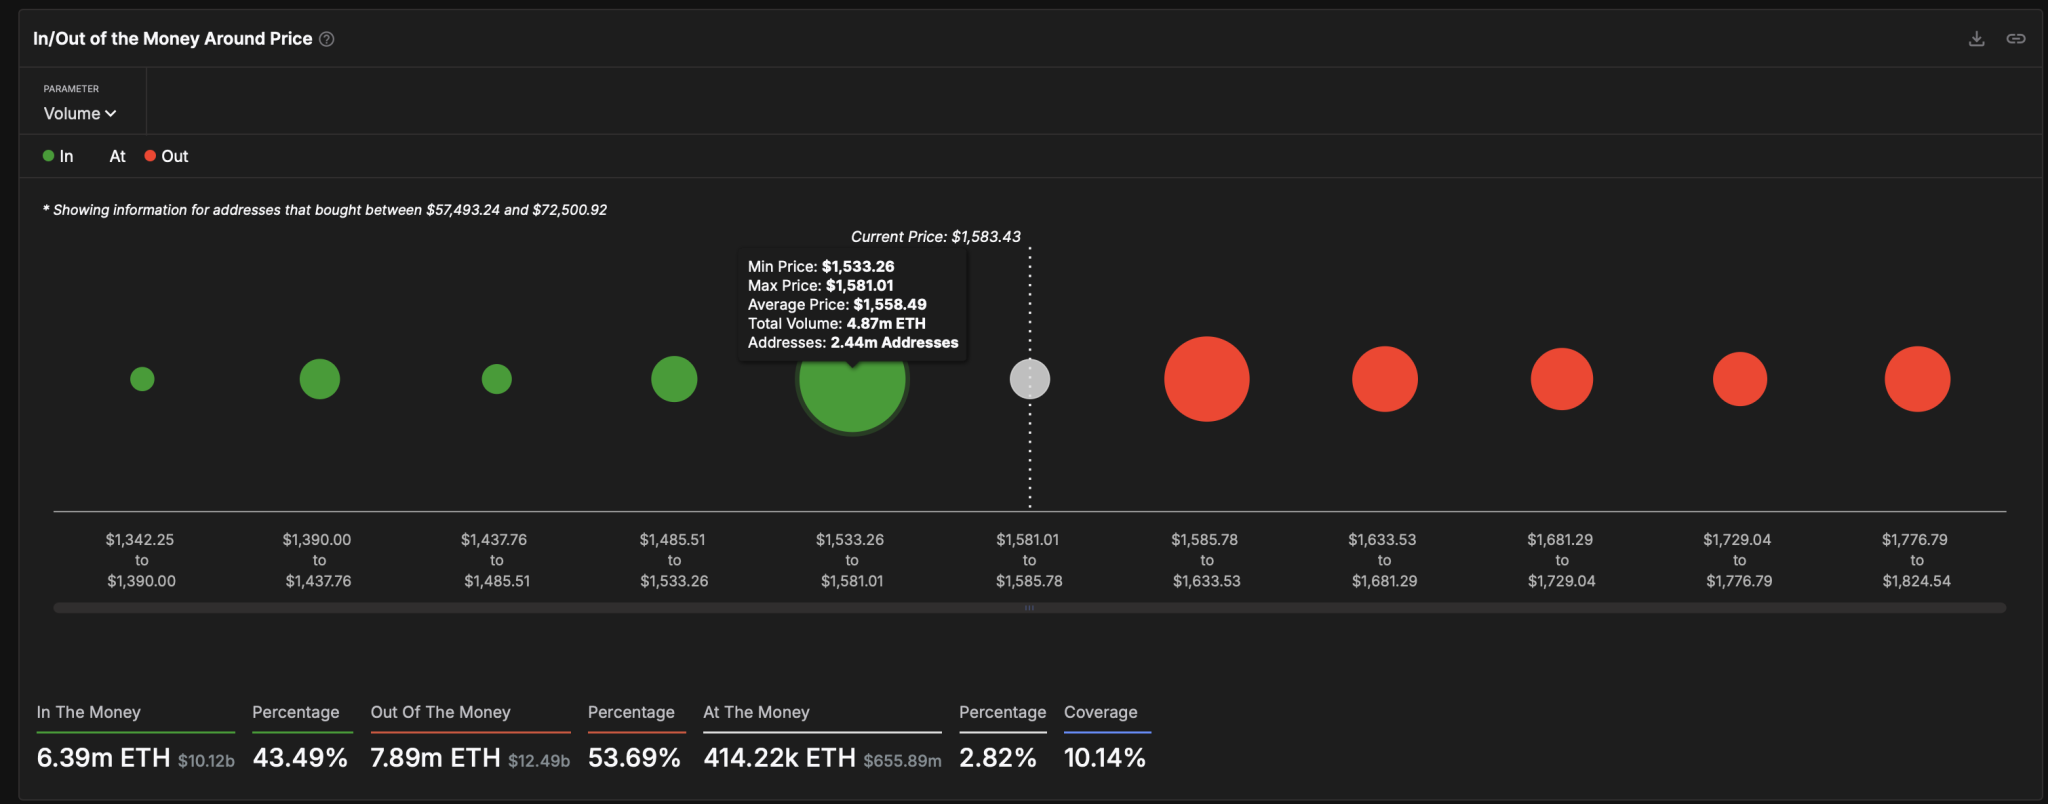
Based on the In/Out of Money Indicator from IntotheBlock, the support zone between $1,533 and $1,581 is the final defense line. This demand zone holds 4.82 million ETH in 2.44 million addresses. If the price drops below this range, the next support lies between $1,390 and $1,437.

Ethereum GIOM Indicator

Conversely, the key resistance remains the supply zone between $1,585.78 and $1,633.53, which holds 2.89 million ETH across 3.62 million addresses.

A successful breakout could see ETH rise toward the $1,700 level.