Home Blog Page 89

Latest XRP Drop Wasn’t Driven by Spot Selling: Market Data Reveals the Real Cause

0

Market data suggests that the latest XRP decline had more to do with activity in the derivatives market than with investors selling their XRP on the spot market. 

After climbing to around $1.29 earlier this week, XRP has lost more than 13% of its value and slipped to roughly $1.12. While most traders would attribute this drop to spot selling, the data shows that the leveraged traders had the bigger contribution.

XRP Open Interest and CVD See Sharp Declines

One of the indicators suggesting this is the Binance Open Interest (OI). For context, open interest measures the total value of active futures and perpetual contracts, and traders often use it to track the level of speculative activity in the market.

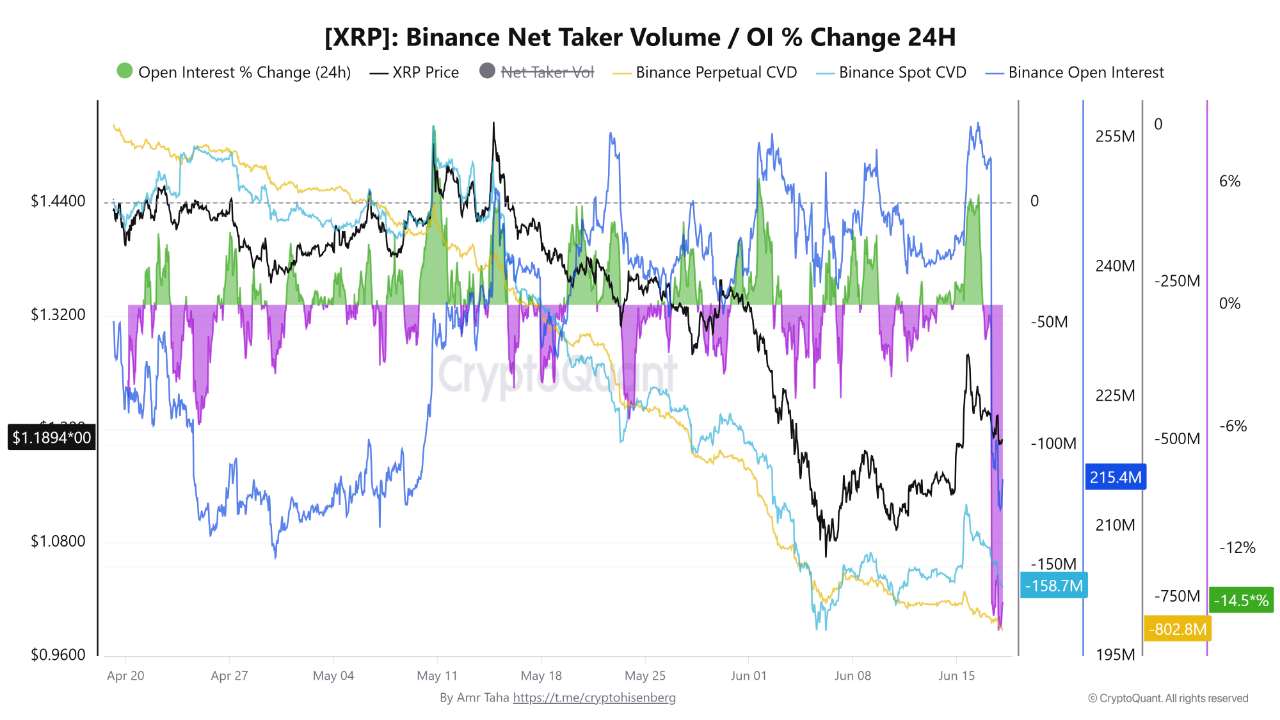
According to the data sourced from CryptoQuant, Binance OI fell from about 255 million to 215.4 million within 24 hours, marking a decline of 14.5%. 

When open interest drops alongside price, it usually means traders are closing positions either by choice or through forced liquidations in a process called deleveraging or leverage unwinding. This suggests that many leveraged long positions were pushed out of the market as XRP moved lower. 

Further evidence comes from Binance Perpetual CVD (Cumulative Volume Delta). Notably, this indicator measures the difference between aggressive buying and aggressive selling in the perpetual futures market.

During XRP’s decline, the metric dropped to -802.8 million, showing that sellers heavily outweighed buyers in futures trading. The move indicates that leveraged traders aggressively sold into the market as prices weakened.
XRP Spot and Futures Metrics CryptoQuant
XRP Spot and Futures Metrics | CryptoQuant

As a result, much of the downward pressure seems to have come from futures traders closing positions rather than from long-term investors exiting XRP.

XRP Spot Market Selling Relatively Light

Meanwhile, the Binance Spot CVD did not experience as much decline as the futures CVD and OI. Specifically, the indicator declined to around -158.7 million, a much smaller drop than the one recorded in the perpetual futures market.

Notably, if investors had been rushing to sell their XRP holdings, spot-market selling would likely have been much closer to the scale of the futures-market activity. However, the data shows that spot selling remained relatively limited while derivatives traders drove most of the decline.

When spot-market selling drives a decline, it can indicate that investors are losing confidence and distributing their holdings. Such conditions often lead to more extended downtrends.

However, a decline caused mainly by liquidations and falling open interest can look very different. Once leveraged traders have been forced out, much of the selling pressure may disappear because the forced sellers are no longer active.

This does not necessarily mean XRP has already found a bottom. However, it does suggest that the market may be moving toward a healthier structure after clearing out excessive leverage.

Signals to Watch Going Forward

Right now, the first thing to monitor is whether open interest stabilizes around the current level. 

If OI stops falling while XRP maintains support, it could indicate that the liquidation phase is nearing its end. On the other hand, continued declines in OI may suggest that more leveraged positions still need to be cleared out.

Further, the Spot CVD is extremely important. So far, the decline in Spot CVD is much smaller than the move seen in futures markets. 

If this metric stays relatively stable, it confirms that leverage unwinding caused the drop. However, a sharp increase in spot selling would point to broader investor selling and could create additional downside risks.

Investors should also watch Perpetual CVD after its fall to -802.8 million. A recovery in this indicator would show that aggressive futures buyers are returning to the market.
XRP Price Target of Massive Multi-Year Accumulation Range

0

XRP could repeat a bullish pattern on higher timeframes, potentially taking its price to $10, but may endure further downside from the current level.

XRP continues to trade on top of a long-term ascending support trendline, according to an analysis from Black Swan Capitalist founder Versan Aljarrah. On multiple occasions, the asset’s price has repeatedly found support along this trendline before rebounding to higher prices.

In his X post, Aljarrah mentioned that the current correction closely resembles previous ones where eventually XRP forms a bottom near the rising support. With the prospect of the coin retesting the support emerging, he highlighted an accumulation zone to watch where it would likely start rebounding to unprecedented prices.

A Critical XRP Accumulation Zone Comes into Focus

An accompanying chart shows that the XRP price has steadily declined from its all-time high of $3.66 in July 2025. It has recorded 8 red candles in the past 9 months and is on course for another huge decline in June.

XRP Accumulation Zone/Versan Aljarrah

Amid the downtrend, analysts have now turned their attention to where XRP could find a durable bottom. According to Aljarrah, a multi-year accumulation range has now come into focus. The altcoin broke out from the zone in November 2024, after trending in it for four months.

After its July 2025 ATH, massive selling pressure kicked in, pushing XRP back to retest key support levels. Aljarrah sees the coin finally finding support at the accumulation zone near the strong ascending support trendline.

He also noted that XRP has been forming higher lows on both the weekly and monthly timeframes, as it continues to hold above the multi-year support trendline. Beyond the downtrend, he also sees a classic bullish breakout pattern forming, where XRP is expected to rebound aggressively from the accumulation zone.

Aljarrah further sees trading volume rising as XRP’s utility and adoption expand, aiding the rebound cause. Currently, the coin has returned to a major horizontal resistance level near $1.19.

Familiar Capitulation Targets $10

The chart shows a possible capitulation from XRP’s recent peak in July 2025 to the accumulation zone near $0.50. This is a familiar pattern in previous cycles, each preceding a strong rebound higher.

For context, XRP dropped 96.7% from the January 2018 high of $3.35 to the March 2020 low of $0.104, aligning with the ascending trendline. A similar scenario occurred when it crashed 85% from its April 2021 peak of $1.96 to $0.28 in June 2022.

Currently, XRP is 55% away from the accumulation zone’s lower band at $0.55. Aljarrah noted that the longer this consolidation phase lasts, the stronger the expansion phase will be. This suggests he expects a massive rebound when XRP finally bottoms from this prolonged downtrend.

The shared chart highlights the possibility of a rally towards $10, marking a new all-time high for XRP. From the current market price of $1.12, this represents a 792% growth.

Nonetheless, this explosive move hinges on XRP holding the ascending trendline if it revisits it. The bullish prospect will weaken if it closes below this support zone on higher timeframes.

ADA at 2020 Levels: Could Cardano Be Preparing for Another Historic Rally?

While Cardano (ADA) remains under heavy selling pressure, analysts are seeing promising signs of recovery. 

Notably, ADA has dropped out of the top 10 by market capitalization and now ranks 16th among digital assets. It is currently trading around $0.16. Cardano is down 4% in the past 24 hours, 35% over the last month, 53% year-to-date, and 73% over the past year.

The token is now trading at levels last seen in December 2020. Meanwhile, that was just before Cardano began a major bull run that eventually pushed ADA to its all-time high of $3.10 in September 2021. The rally from $0.16 to $3.10 represented a gain of roughly 1,838%.

Key Support Zone

Amid the steep decline, some analysts believe ADA has reached a critical long-term support area. Market analysts noted that Cardano has returned to a price zone where buyers previously stepped in, which is between $0.15 and $0.16. The analyst described it as one of the most important levels on the weekly chart.

A strong reaction from this support area could trigger a recovery toward higher resistance levels at $0.2243, $0.3136, and $0.4488.

However, caution remains. Losing the current support could accelerate selling pressure. In that scenario, ADA may continue falling in search of lower liquidity zones.

Cardano Historical chart | TradingView

ADA Targets on Further Downside

Analyst Ali Martinez said ADA recently broke down from a bearish flag pattern that had been forming since the start of the month.

According to Martinez, ADA’s nearly 30% drop between June 3 and June 16 created the flagpole. The subsequent period of consolidation formed the flag portion of the pattern.

After breaking below the $0.17 support level, Martinez believes the risk of a deeper correction has increased. His downside target is $0.13.

Martinez had previously warned on June 4 that ADA could eventually fall to $0.11 or even $0.051. He made those comments shortly after Hoskinson announced he was taking a break.

Hoskinson Focuses on Cardano Long-Term Growth

As ADA struggles, Cardano founder Charles Hoskinson has urged investors to look beyond short-term price action.

A post from @MinswapIntern highlighted Hoskinson’s recent comments about Cardano’s next phase of development. The founder said the network is preparing for future growth, including the launch of the Leios testnet.

Hoskinson also argued that Cardano’s greatest strength is its community, not its current technology stack or token price. He said the ecosystem has repeatedly shown its ability to evolve and reinvent itself.

He further pointed to projects such as Midnight as evidence that Cardano is expanding beyond traditional crypto use cases and building for long-term adoption.

Community Figure Predicts Return to $3

Meanwhile, Cardano stake pool operator Sssebi pointed to ADA’s strong rally last year. The token doubled from $0.60 to $1.20 after U.S. President Donald Trump announced plans for a strategic crypto reserve that included Cardano.

Sssebi argued that a market recovery could once again drive strong momentum for ADA. He believes the asset could post several consecutive weeks of gains if sentiment improves. According to him, a return to the $3 level could happen much sooner than many investors expect.

“ADA can get to $3 faster than you think,” Sssebi said.

Jake Claver: XRP Biggest Opportunity Isn’t International Payments

XRP community figures Eri and Jake Claver recently argued that XRP value goes far beyond cross-border payments.

In a post on X, Eri shared a clip from a recent livestream by Digital Ascension Group chairman Jake Claver. The discussion focused on the so-called “stablecoin sandwich” model.

Eri said she agreed with two of Claver’s key points. One of them is that Ripple has already used stablecoins such as USDT and USDC as bridge assets in its On-Demand Liquidity (ODL) service.

Ripple Already Used Stablecoins in ODL

According to Eri, Ripple’s payment infrastructure has previously incorporated Tether and USDC as bridge assets. These transactions were facilitated through the XRP Ledger’s decentralized exchange (DEX), helping reduce costs and improve transaction speed.

Meanwhile, Eri added that Ripple’s RLUSD stablecoin is being positioned in a similar way. She pointed to comments from Ripple’s UK and Europe Managing Director, Cassie Craddock, who recently said Ripple Payments has been built around a stablecoin bridge.

The community commentator said investors should pay close attention to new high-quality trading pairs added to the XRPL DEX and focus on transaction volume and liquidity metrics rather than narratives circulating online.

XRP Role Beyond International Payments

In the livestream clip, Claver addressed ongoing talks about XRP’s future value. Specifically, he discussed whether XRP can reach high valuations without becoming the primary bridge asset for global payments.

He explained that a stablecoin sandwich involves converting fiat currency into stablecoins such as USDC. Those stablecoins are then transferred across blockchain networks before being converted back into local currencies. This allows international money movement without direct exposure to cryptocurrencies.

However, Claver argued that financial institutions will ultimately choose the most efficient settlement option available.

“If there is a faster, cheaper way to settle payments, it will route through XRP,” he said.

Claver also rejected the notion that XRP’s success depends entirely on replacing SWIFT or dominating cross-border payments. In his view, international payments represent only one of many use cases for the asset.

XRP’s Potential in Collateral and Market Infrastructure

Claver said he sees XRP’s long-term role extending into market settlement infrastructure and serving as collateral for derivatives markets.

Similarly, Eri noted that XRP has numerous applications outside payments, including collateral and decentralized finance. She also referenced comments from Evernode CEO Asheesh Birla, who has previously spoken about new financial products on the XRP Ledger that have yet to be imagined.

According to Claver, XRP could become more efficient than stablecoins if it reaches sufficient liquidity and value. Combined with the XRP Ledger’s built-in DEX and interoperability features, it would offer a cheaper and faster settlement option.

He argued that institutions seeking low-cost settlement and seamless asset swapping may ultimately prefer a highly liquid bridge asset like XRP over stablecoin-based transfers.

XRP Flips $1.3 From Support to Resistance: Here’s the Next Key Support if $1 Fails

0

XRP has flipped the pivotal $1.3 range from support to resistance, with bears now eyeing the psychological $1 level as the next area to conquer.

The XRP price remains under selling pressure after losing a key support zone around $1.3 earlier this month. Recent price action now shows that this zone, which was once a support area, has become a major resistance level. 

This change in market structure suggests sellers still have the upper hand as XRP moves closer to a support region that could determine its next direction.

$1.3 Range Turns into Resistance

On June 1, XRP fell below the $1.27 to $1.31 range, a level that had previously served as an important support area. 

For context, following the market crash in early February 2026, XRP managed to hold above this zone for several months, defending against any crash below it. However, this changed at the beginning of June when the asset finally lost this support.

After breaking below the range, XRP continued its decline and dropped to around $1.05 by June 6. This level marked a new low for the year and sits close to the important psychological support at $1, which makes it one of the most watched areas on the chart.

The market later confirmed the change in trend when XRP attempted a recovery earlier this week. The asset climbed to $1.29 but failed to push higher, facing rejection right within the former support zone. This reaction confirmed that the $1.27 to $1.31 area has now turned into resistance.

Since reaching $1.29 on Monday, XRP has lost more than 12% of its value and now trades around $1.13. The asset has also recorded three straight intraday declines and appears set for a fourth consecutive loss. As a result, XRP now looks to be moving back toward the critical $1.05 support region.

Bollinger Bands and DMI Show Strong Bearish Pressure

Several indicators confirm the current bearish outlook. Notably, the lower Bollinger Band stands at $1.05236, placing it almost exactly at the $1.05 support level. This shows the importance of the area.

The Directional Moving Index (DMI) also shows that sellers continue to control the market. The positive directional indicator (+DI) has fallen to 20.4, while the negative directional indicator (-DI) has risen to 27.45 and continues to move higher.

XRP Seeing Bearish Pressure

Meanwhile, the Average Directional Index (ADX) has reached 27.9. Since the ADX measures trend strength, this reading indicates that the current downtrend remains strong. For XRP to begin a recovery, both the ADX and the -DI would need to start weakening, indicating a loss of bearish momentum.

What Happens if XRP Loses the $1 Support?

If the current downward trend continues, buyers will likely try to defend the $1.05 support area. However, losing this level could create further problems for XRP. As the support aligns with the lower Bollinger Band, a break below it could open the door to a much deeper decline.

The next major support sits near the 1.618 Fibonacci extension level around $0.83. A drop to this area would put XRP in a difficult position, as the asset would first need to reclaim the $1 psychological level before attempting another move toward the $1.30 region.

However, this task may not be easy. Notably, once a major psychological support level breaks, it often turns into strong resistance. If XRP loses $1, buyers could face another challenge when trying to push the asset back above that mark.

Key Levels XRP Must Reclaim to Recover

To avoid a larger decline, XRP needs to rebound quickly and regain the $1.143 level. This price aligns with the 0.786 Fibonacci retracement and represents the first major hurdle for a recovery.

A move above $1.143 could give buyers enough strength to reclaim the middle Bollinger Band, which currently sits at $1.17. If this happens, XRP could then target the 0.618 Fibonacci retracement level at $1.21 before making another attempt at the upper Bollinger Band near $1.29.

XRP Levels to Watch
XRP Levels to Watch

However, even if the asset moves higher, the resistance between $1.27 and $1.31 could once again stop the rally if buying momentum remains weak. Also, reclaiming this range alone would not fully change the broader market outlook.

For XRP to move out of bearish territory, it must secure a strong close above $1.6. This level stopped the asset’s recovery attempt in mid-March and has remained a major obstacle ever since. Since losing $1.6 during the early February decline, XRP has repeatedly failed to regain it.

Top Portfolio Manager Sparks XRP Speculation With Cryptic One-Word Post

0

Portfolio manager of The Free Markets ETF, Michael Gayed, has once again captured the attention of the XRP community with a cryptic social media post.

Taking to X, Gayed shared a single-word message: “XRP.” The post contained no analysis, commentary, or price prediction, prompting many users to speculate about its meaning. However, Gayed did not explain, leaving followers to interpret the message on their own.

Nonetheless, the post continues Gayed’s recent pattern of referencing XRP and engaging with its highly active community.

XRP Community Welcomes Another Show of Support

Over the years, Gayed has earned a reputation among XRP supporters for his consistently bullish commentary. Regardless of market conditions, he has frequently rallied the “XRP Army” through posts such as “Where the XRP Army at?”

In addition, Gayed has demonstrated his enthusiasm for the token by creating and sharing multiple XRP-themed songs with the community. Given this history, many market participants viewed the latest post as another indication of his interest in XRP rather than a detailed investment thesis.

As expected, XRP supporters responded positively. Many interpreted the mention as a form of recognition, or even endorsement, from the well-known market commentator.

However, not everyone shared that enthusiasm. Some cryptocurrency advocates questioned the basis of Gayed’s continued support for XRP, arguing that he rarely provides detailed explanations for his optimistic outlook.

Gayed Bullish on Global XRP Adoption

Meanwhile, several users pointed to Gayed’s broader thesis regarding XRP’s long-term adoption prospects. According to Gayed, XRP adoption could expand globally, with Japan potentially leading the way through its banking sector. 

He believes three key factors could drive this growth: Japan’s clear digital-asset regulations, strong demand for cross-border payment solutions, and the country’s long-standing connection to the yen carry trade.

Last year, Gayed argued that Japanese financial institutions are already advancing XRP adoption through real-world payment use cases. He highlighted SBI Remit as a notable example.

According to him, SBI began using XRP in 2021 to facilitate remittances between Japan and the Philippines. The company later expanded the service in 2023, enabling direct bank-account payouts in the Philippines, Vietnam, and Indonesia.

XRP Declines Alongside Broader Crypto Market

Gayed’s latest commentary comes at a time when XRP and the broader cryptocurrency market are facing renewed selling pressure.

Over the past 24 hours, the total crypto market cap has declined by 1.24% to $2.15 trillion, leading to the liquidation of $453 million over the past day. XRP has also recorded losses during the same period, falling 3.07% to trade at $1.12 at press time. The token recorded $6.77 million in liquidations, with long positions making up $6.3 million of the total. 

XRP Liquidations
XRP Liquidations

Dogecoin Back at Historical Accumulation Zone: A Bounce Could Target $1

0

Dogecoin continues to slide lower, but has now reached price levels that hold historical significance.

The Dogecoin (DOGE) price struggles mirror a broader market downtrend. With Bitcoin sliding below $63,000 amid Strategy’s STRC preferred stock’s drop to $84 on Thursday, the crypto sector has followed suit.

The meme coin is down 1.3% already at the time of writing, building on its nearly 3% drop on Thursday. Since this week, DOGE has dropped 7%, as bears remain in full control of the market. Meanwhile, the meme coin is now approaching a zone that once sparked a price recovery.

Dogecoin at Historical Accumulation Zone

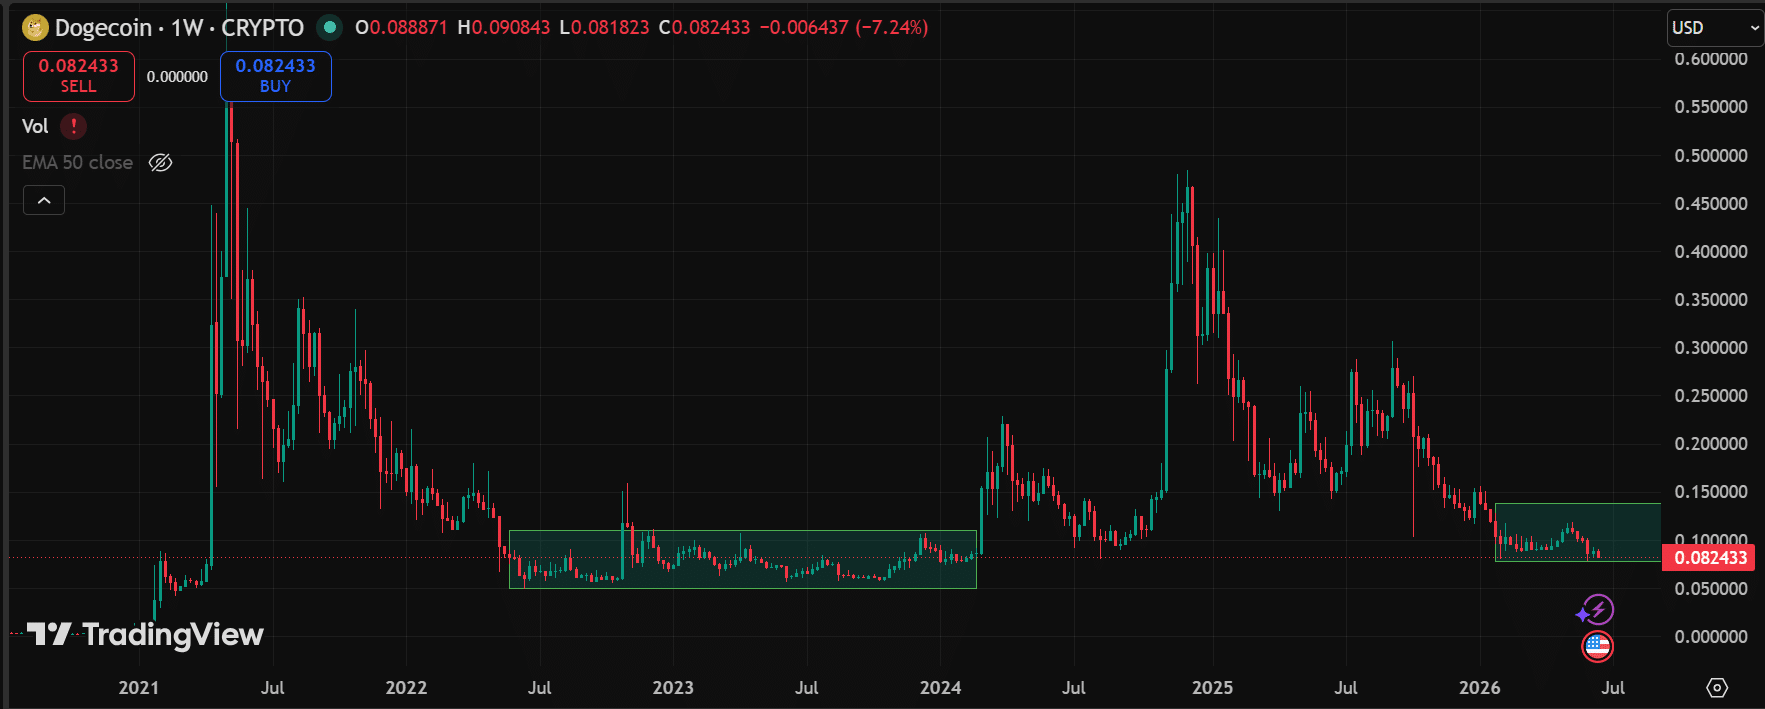
On the weekly chart, Dogecoin has drifted back into a price region that once acted as a foundation for a major price move. Since dropping to $0.080 in early February, the token appears to have started forming a price range.

Dogecoin 1W Chart/TradingView

Its price rebounded to $0.118 in May, but faced selling pressure there, forcing a retracement. Now, Dogecoin has retested the support level near the February lows. In the first week of June, DOGE slumped to $0.077 before bulls stepped in to prevent further downside.

Currently, it trades at $0.082, still around this key weekly support. This places the meme coin at a critical point in its long-term structure.

Notably, the current setup resembles a previous period when DOGE spent months consolidating near a multi-year support before eventually breaking into a stronger upward trend.

For context, between May 2022 and February 2024, prices remained close to the lower boundary of a broad accumulation range. Dogecoin hovered around the $0.050 support before eventually breaking out to December 2024’s high of $0.484.

Long-Term Support Remains Intact

What stands out is that Dogecoin continues to respect the current support around $0.080. Despite the current price weakness, every downtrend has ultimately found relief near this zone, preventing a deeper structural breakdown.

DOGE broke above the current support in February 2024 and has since not fallen below it. Notably, a quick pullback in August 2024 ended in a lower-price rejection. The asset is again testing an area that has historically attracted long-term accumulation. 

Interestingly, similar conditions occurred before the recovery in the previous cycle. The extended periods of weakness gradually gave way to renewed momentum because Dogecoin did not lose key support levels.

Dogecoin Breakout Targets Higher Prices

If this $0.080 support area continues to hold, the focus will shift toward whether DOGE can reclaim higher resistance levels and establish a new upward trend. A decisive move away from the current range to reclaim key moving averages is a good start.

One of the important resistance levels to watch for long-term recoveries is the March 2024 high of $0.228, a 178% growth from here. Another one is the September 2025 high of $0.306, representing a 273% increase from the current price.

An 802% price surge to the current all-time high of $0.74 is a possibility if bullish momentum sustains. Meanwhile, the $1 dream could still come true. If the broader market enters a prolonged uptrend and the 2021 market conditions repeat, DOGE could explode by 1,120% to the long-anticipated price level.

Introducing The Crypto Basic Updates: Faster Crypto News, Whale Moves and Market Alerts in One Place

The Crypto Basic has introduced a new Updates section on its web app, giving readers a faster way to follow important crypto market developments as they happen.

The new feature is designed for users who want quick access to the latest crypto updates without waiting for longer-form articles. From Bitcoin whale activity and major exchange developments to regulatory news, market-moving token trends, institutional commentary, and unusual on-chain transactions, the Updates section brings timely crypto stories into one simple destination.

Crypto markets move fast. A whale transaction, regulatory comment, ETF-related statement, exchange update, or sudden sector rotation can quickly become the story of the day. With The Crypto Basic Updates, users can now track these developments in a shorter and faster format while still staying connected to the broader market context.

A Faster Way to Follow Crypto Market News

The Updates section is built for speed and clarity. Instead of only relying on full-length news articles, readers can now visit the Updates page to find concise market updates covering the stories currently shaping the crypto conversation.

Recent updates have included developments such as reports around Binance’s EU licensing process, Strategy’s STRC hitting a new all-time low, tokenized stocks emerging as one of crypto’s fastest-growing sectors, Bitcoin whale accumulation, Bitwise CIO commentary on Bitcoin’s long-term potential, and large Bitcoin movements linked to Bhutan-associated wallets.

These are the types of stories that active crypto users often want to see quickly. The Updates feature makes that easier by creating a dedicated section for timely developments across the market.

What Users Can Find in The Crypto Basic Updates

The new Updates section covers a wide range of crypto market activity, including:

Bitcoin and major coin updates

Users can follow key movements around Bitcoin, Ethereum, XRP, Solana, Cardano, Shiba Inu, and other major digital assets.

Whale moves and on-chain activity

Large wallet transfers, whale accumulation, exchange inflows, and unusual blockchain movements can often influence market sentiment. The Updates section highlights notable activity that may deserve attention.

Exchange developments

From Binance and Coinbase to other major trading platforms, the section tracks important exchange-related stories, including licensing, listings, regulatory matters, and market structure updates.

Crypto regulation and policy news

Regulatory comments, licensing decisions, MiCA-related updates, SEC developments, and policy changes can all affect the direction of the crypto industry. The Updates section helps readers keep track of these developments in a simpler format.

Market trends and fast-growing sectors

Crypto narratives can change quickly. Tokenized stocks, real-world assets, meme coins, DeFi, AI tokens, and Bitcoin-related equities can all become major areas of interest. Updates will help users follow these shifts more easily.

Built for Readers Who Want Speed Without Noise

The Crypto Basic has always focused on delivering crypto news, analysis, market coverage, and educational content to a global audience. The Updates feature expands that mission by giving readers a quicker way to follow short, important developments that may not always need a full-length article immediately.

This does not replace our main crypto news coverage. Instead, it adds another layer to the reader experience.

Full news articles remain important for deeper reporting, broader analysis, and detailed market context. Updates are designed for faster awareness, helping readers see what is happening now and decide which stories they want to follow more closely.

Part of The Crypto Basic Web App Expansion

The Updates feature is part of the broader expansion of The Crypto Basic web app, which already includes several crypto market tools for users.

Through the app, users can access crypto market data, top gainers and losers, market dominance, the Fear and Greed Index, coin comparison tools, portfolio features, whale alerts, and other resources designed to help users follow the market more efficiently.

The goal is to make The Crypto Basic app more than a news destination. We want it to become a daily crypto market companion where users can check prices, compare assets, follow trends, monitor sentiment, and stay updated on the latest market-moving stories.

Visit The Crypto Basic Updates

Readers can now visit the Updates section on The Crypto Basic app to follow the latest crypto news, Bitcoin developments, whale moves, exchange stories, regulatory updates, and market trends in a faster format.

As crypto continues to move at high speed, The Crypto Basic Updates is built to help users stay informed with less friction and more clarity.

Whether you are tracking Bitcoin, watching whale wallets, following exchange developments, monitoring regulation, or simply trying to keep up with the latest crypto market stories, the new Updates section gives you a faster way to stay connected.

Flare CEO Just Spelled Out the Endgame for XRP Holders

0

Flare CEO Hugo Philion recently appeared on the Onchain Economy, where he explained how Flare is working to expand XRP utility through FXRP. 

Commenting, XRP community figure Bank suggested that the Flare co-founder had essentially described what he believes is the “endgame” for XRP holders.

Flare’s Plan to Expand XRP Utility 

In the discussion, Philion said his focus is particularly on increasing XRP’s utility through Flare’s work, further encouraging more developers to build new applications around XRP to bring in value.

He explained that Flare adds smart contract capability to the XRP Ledger and improves interoperability between blockchains. According to him, Flare is a Layer 1 network built mainly around data. 

The Flare CEO noted that data infrastructure was the key innovation behind the network, noting that they designed Flare to support better communication and interaction between different systems.

To make this possible, Flare created FXRP, which connects the XRP Ledger to the Flare network. This bridge allows XRP to move into a smart contract environment where it can be used in decentralized applications instead of remaining only on its native ledger.

FXRP and New Uses for XRP in DeFi

Philion shared how FXRP generates new financial uses for XRP holders. Notably, once XRP is moved into the Flare ecosystem, users can use it as collateral in lending and borrowing systems. This includes borrowing stablecoins and, in some cases, other assets such as commodities like gold.

He also explained that users can take the borrowed assets and deploy them into other markets that generate yield. This means XRP holders can earn income while still keeping exposure to their original XRP holdings.

Philion added that Flare has also built wallet integrations that let users manage XRP on Flare directly from the XRP Ledger, allowing market participants to move and control assets more smoothly across both systems without giving up custody of their original XRP.

Confidential Computing and Focus on Institutions

Speaking further, the Flare CEO also discussed future upgrades, especially Flare Confidential Compute. He called it an extra layer that sits outside the main Flare blockchain but relies on Trusted Execution Environments to confirm what happens inside it.

They designed the system to support heavy applications that blockchains normally struggle with, such as AI models. He also mentioned that Flare is working on continuous AI monitoring and risk tools that can detect problems and respond when needed.

According to him, large institutions will only fully enter decentralized finance if strong privacy features exist. As a result, privacy and secure computation are basic requirements for institutional participation.

Philion further said that Flare increases what Ripple and the XRP Ledger can do with tokenized real-world assets once they are issued on-chain. To him, this creates a major growth area that benefits both Flare and the XRP ecosystem.

FXRP Launch and Early Growth

FXRP officially launched on Flare mainnet last September as the first FAsset under version 1.2. 

Notably, demand was very strong from the start. The first cap of 5 million FXRP was filled in three hours. After that, the limit was increased to 15 million FXRP, and this second allocation also filled quickly.

Shortly after launch, the Xaman wallet added support for FXRP. This allowed users to mint FXRP directly from XRP Ledger wallets and marked the first stage of Flare’s plan for smoother cross-chain access.

FXRP continued to grow in the months after launch. By late October 2025, about $86.2 million worth of XRP had been bridged after more than 15 million XRP was moved over a single weekend. This pushed Flare to become the largest EVM-based DeFi ecosystem for XRP.

Flare’s liquid staking platform, Firelight, launched its first phase in December 2025. Its initial cap of 25 million FXRP filled quickly, and by around April 2026, staked XRP (stXRP) passed 50 million.

At press time, Flare hosts about 153.8 million XRP worth $180 million in its FXRP ecosystem, with up to $73.43 million staked in Firelight.

Dogecoin 3.5-Year Cycle Theory Highlights Where and When DOGE Will Peak Next Bull Cycle

0

A fresh analysis has predicted when Dogecoin will start to recover, when it will peak in the next bull market cycle, and its possible price target.

Market analyst KrissPax highlighted what he described as a 3.5-year Dogecoin cycle in his recent post on X. The analysis identified how the meme coin has historically trended according to the prevailing theory and how it will shape its price action in the coming market cycle.

Dogecoin Nears Lower Boundary of Its Long-Term Channel

This analysis comes as Dogecoin (DOGE) trends near a region that has played a critical role throughout its market history. The asset trades near the lower boundary of a series of ascending trend lines that have guided its price action for more than a decade.

Throughout previous cycles, major market bottoms formed near the lower boundaries of this rising channel before substantial upside moves followed. An example is in March 2020 when Dogecoin bottomed at $0.00134 after falling from the channel’s upper band at $0.018 in January 2018.

This level was just below the lower trendline, with DOGE finding support and subsequently rebounding to higher prices. A similar scenario occurred in 2015.

Now, DOGE is trading at $0.084, exactly at the channel’s lower boundary. The analyst noted that the token is “scraping the bottom” based on a logarithmic chart but does not rule out the possibility of further price weakness.

According to him, DOGE could briefly move below this trendline support as the ongoing bear market persists before establishing a durable bottom.

History Suggests Momentum Could Return Before 2027

Notably, the accompanying chart highlights three major bull cycles in 2017, 2021, and 2024. Each phase appears to follow a similar rhythm, with extended periods of consolidation and declining sentiment eventually giving way to renewed upward momentum.

Dogecoin Lower Support Band/KrissPax

Following the explosive rally to the current ATH of $0.74 in 2021, Dogecoin entered a prolonged corrective phase that has now lasted for over three years. Bullish momentum returned in late 2024, when DOGE bounced from a support trendline in August 2024 to this cycle’s high of $0.484.

The same thing happened in the previous cycle, when Dogecoin gained momentum in November 2020 and pumped aggressively in the first few months of 2021. If the historical pattern continues to play out, KrissPax suggests that stronger upward momentum could start later in 2026 and continue throughout 2027.

Dogecoin to Hit Peak in Spring of 2028

Using the 3.5-year Dogecoin cycle theory, the analyst projected that Dogecoin will likely peak in the spring of 2028, which is around March of that year. While there is no guarantee to it and cyclical trends do not perfectly rhyme, history shows a consistency in the timing of past bottoms and peaks.

For the target, the chart shows that Dogecoin will at least eye the upper boundary of the ascending channel, as it has unfailingly done in previous cycles. This would see the token potentially reach levels around $2.10, representing a staggering 2,400% increase from the current price of $0.084.