Home Blog Page 897

How Low Will Bitcoin Go This Year? Here’s What Crypto Bettors Think

0

Kalshi betting market attempts to pinpoint the Bitcoin 2025 bottom.

From endless predictions of just how high Bitcoin can fly in 2025 to growing speculation of a bear market, crypto market sentiment has changed significantly with the turn of the new year.

Following this week’s correction, which has seen the asset drop nearly 30% below its all-time high, the big question has been how low will Bitcoin go.

Per a bet that has attracted nearly $300,000 on the blockchain-based betting site Kalshi at the time of writing, the answer to this question might be $60,000, as the market shows a 74% chance of the asset falling below $70,000.

Screenshot 20250228 152736 Chrome
Kalshi betting market on how low Bitcoin will fall in 2025. Source: Kalshi

These odds had notably favored $80,000 as Bitcoin’s base at the start of this week. The steep drop in only a few shows how much the recent market correction has impacted sentiment.

Prediction markets like Kalshi have become popular over the past year following the rise of market leader Polymarket during the 2024 U.S. elections. Odds on Polymarket were closely watched even by mainstream media in the buildup to the election and they eventually proved correct.

What Experts Are Saying

While Kalshi bettors see Bitcoin dipping as low as $60,000 in 2025, leading market analysts appear less pessimistic, at least in the short term.

In an X post on Friday, February 28, CryptoQuant CEO Ki Young Ju asserted that Bitcoin could fall to $75,000 and consolidate between $75,000 and $100,000 in the short term amid a lack of immediate positives and fresh liquidity.

On the other hand, Standard Chartered’s head of digital asset research, Geoffrey Kendrick, has suggested a drop to the $69,000 to $76,500 price range is likely. He tipped the asset to continue showing weakness during the weekend as markets anticipate President Donald Trump’s tariffs on Canada, China, and Mexico on March 4.

Bitcoin, meanwhile, has recouped some of its recent losses, trading at over $82,000 at press time.

Bitcoin Dip Below $80K Triggers $685 Million in Realized Losses, What’s Next?

0

The Bitcoin dip below $80K today led to $685 million in realized losses, with recent buyers seeing over $2.16 billion in losses over the past three days.

Bitcoin’s price has touched $78K today, with a 17.3% loss over the last seven days and a nearly 19.9% decline in the past month. After reaching the $78,940 support level, Bitcoin showed a slight recovery, but volatility remains high.

Amid this, Glassnode data reveals that Bitcoin’s drop below $80,000 triggered an additional $685 million in realized losses on February 28 alone. The losses primarily come from recent market entrants, with over $2.16 billion realized between February 25 and 27.

Bitcoin Holders Realizing Losses

Those who entered the market less than a week ago recorded the highest losses at $238.8 million, followed by those who entered between a week and a month ago at $187.6 million.

Notably, the one to three-month group saw $132.4 million in losses, while the 24-hour cohort lost $104.9 million. Meanwhile, Bitcoin holders from the past 3 to 6 months have seen their losses accelerate, reporting $12.7 million in losses, marking a 95.4% increase from the previous day.

Since the start of February 28, Bitcoin has realized losses at a rate of $57.1 million per hour. The 1-day to 1-week cohort remains the dominant force behind liquidation pressure, realizing losses at $19.9 million per hour, nearly twice as fast as the next largest group.

The 1-week to 1-month and 1-month to 3-month cohorts are also significant, realizing losses at $13.9 million and $14.2 million per hour, respectively. Loss realization from the 6-month to 12-month cohort remains minimal.

Crypto Whales Move Large BTC Holdings

On the other hand, crypto whales have been moving significant amounts of Bitcoin over the past four days, offloading 40,000 BTC. This movement coincides with a notable drop in whale holdings, which fell from 4.53 million BTC to 4.49 million BTC.

Amid the ongoing market condition, market observers suggest Bitcoin may enter an extended consolidation phase. CryptoQuant’s Ki Young Ju indicates that BTC could dip further to the $75,000 level before stabilizing. This phase mirrors early 2024, where Bitcoin fluctuated within a defined range before making further moves.

Bitcoin Cycle Trend

Elsewhere, analyst CryptoCon highlights that Bitcoin’s current cycle resembles the 2015-2018 market cycle. According to his projections, Bitcoin is about a month away from reaching the first cycle top date based on Fibonacci Halving models. 

Notably, Bitcoin’s performance in February has been weaker than usual. Historically, February is a bullish month, even during bear markets. Despite this unusual downturn, the analyst emphasizes that market cycles often exhibit unique patterns to keep market participants uncertain.

Bitcoin Dips to $78K: Analyst Predicts Rebound to $170K in Coming Weeks

0

A notable market analyst believes Bitcoin could consolidate for the next few weeks before recovering to a new all-time high.

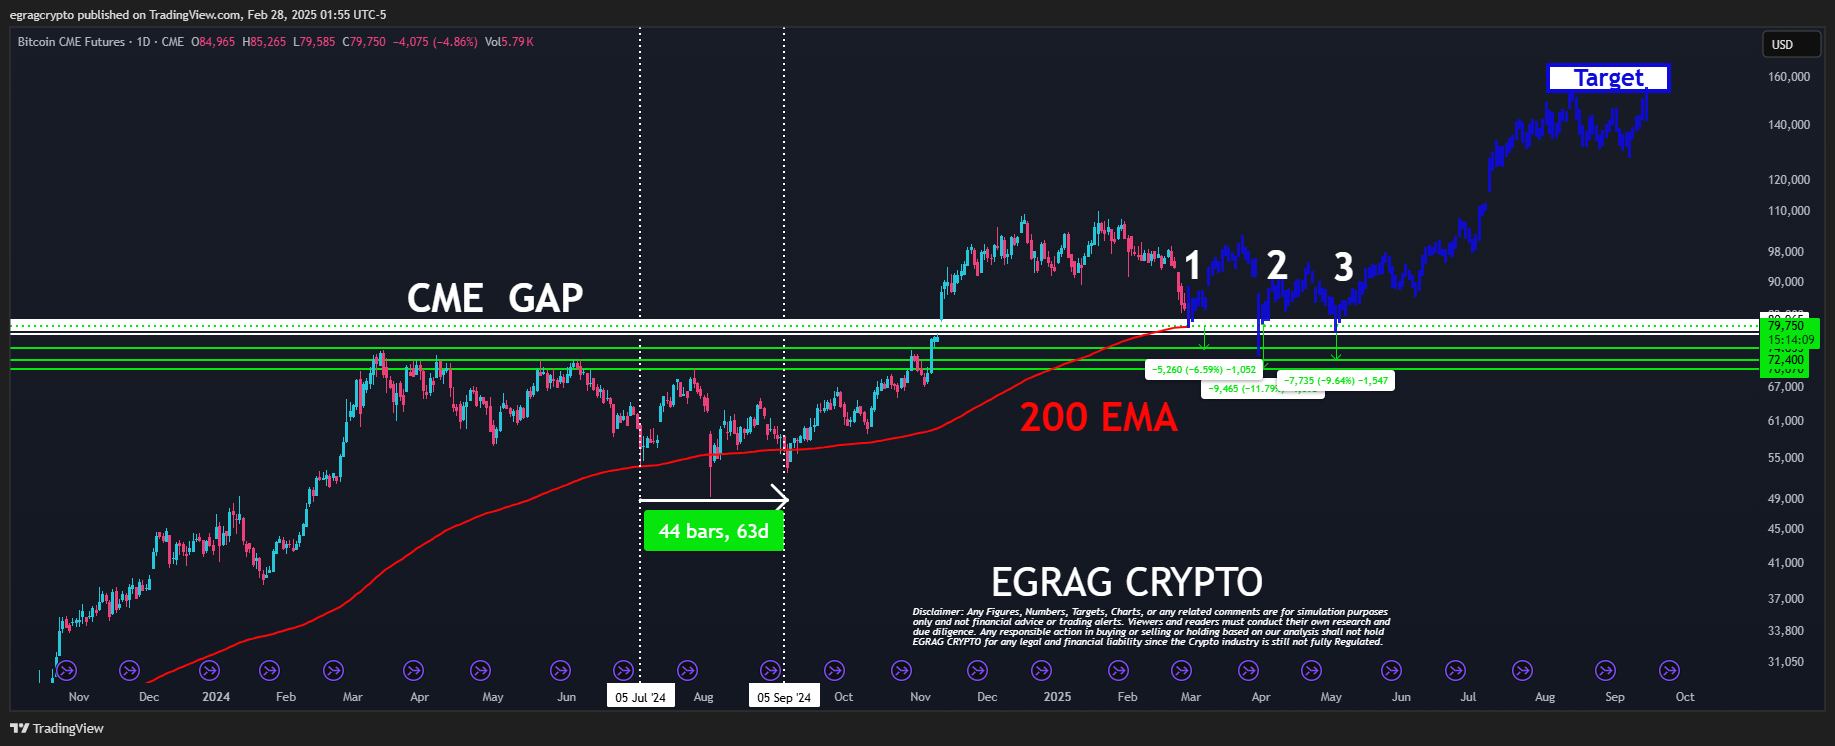
Analyst Egrag shared this outlook in a post on X today. The disclosure came as an update to his analysis in which he speculated on two possible scenarios for Bitcoin ahead of President Donald Trump’s inauguration.

At that time, he suggested Bitcoin could rise to $120K before experiencing a major price dump, specifically targeting the CME Gap before resuming the bull run. His second scenario anticipated a significant dip to the CME Gap, precisely the $70,000 to $75,000 price range, before Bitcoin resumed its upward trajectory.

Now, the second scenario has played out, and Egrag took to X to take pride in his accurate prediction. For context, Bitcoin dipped to as low as $78,200 today, the lowest price since this year, a development that has significantly impacted the altcoin market.

With the $70K range materializing, Egrag shared an updated outlook on where Bitcoin could be headed in the next few weeks.

Short-Term Volatility Before the Next Leg Up

First, Egrag highlighted that the $70K to $75K key level aligns with the 200-day Exponential Moving Average (EMA). According to him, this range is now acting as a critical support zone.

He also noted that Bitcoin’s price action is following a familiar fractal seen between July and September 2024. This suggests that the market could experience a bumpy ride through March and April 2025, with price fluctuations around the 200 EMA before resuming its uptrend.

Egrag predicts that this consolidation phase will eventually lead to a significant breakout, similar to past cycles.

Bitcoin Next Target: $150K–$170K?

Using Fibonacci 1.618 extensions and fractal analysis, Egrag projects that Bitcoin could reach $150K–$170K as the cycle’s peak. This aligns with predictions he has maintained since 2021. However, according to him, many have overlooked this outlook in favor of more ambitious targets.

Image
Bitcoin chart by Egrag

Notably, at press time, Bitcoin is trading at $82,300, showing slight recovery from the $78K dip. Rebounding to $170K from today’s low would result in an impressive 118% gain for current holders.

Bitcoin and Ethereum Options Worth $5.78B Set to Expire with Max Pain at $96K and $3K Prices

0

The crypto market may be gearing up for more volatility, with Bitcoin and Ethereum options worth a combined $5.78 billion set to expire today.

Since the start of the week, the cryptocurrency market has seen intense and rapid price actions, especially towards the downside. Bitcoin and Ethereum, the two largest cryptocurrencies by market cap, have led this charge, capitulating 18% and 24%, respectively.

Meanwhile, the market could see more swift price developments, with options worth a staggering $5.78 billion set to expire. This is particularly interesting, as the max pain point for these expiring options contracts is opposite the predominant market direction.

Bitcoin Options Worth $4.66B Running Its Course

Data from Greeks.live shows that 59,000 BTC options worth $4.66 billion are expiring today. The contracts have a put-call ratio of 0.7, a somewhat neutral market disposition, and a max pain point of $96,000.

Interestingly, the max pain, which highlights the price at which most options expire worthless, of $96,000 indicates that most options calls were accurately betting on lower prices. Notably, the pain price mark is over 17% away from the current market price, a gap market makers could be looking to close to reduce cashouts.

Ethereum Options Worth $1.12B Expiring Likewise

Concurrently, 529,000 ETH options with a notional value of $1.12 billion would expire alongside the Bitcoin contracts. With a relatively bullish put-call ratio of 0.52, the options contracts’ max pain stands at $3,000, 36% away from Ethereum’s current price.

It remains to be seen if market makers can defy the predominant bearishness and push prices closer to the options’ pain point. Nonetheless, Greeks.live stated that options majors have increasingly sold short and intermediate since the past month, with smart money traders winning the bets again.

Market Panic Spikes Volatility

Further, the Greeks.live analysis shows extensive market volatility amid a strong downturn in US stocks and bonds. Notably, a major catalyst for this panic sprung from US President Donald Trump’s renewed tariff rate hike on major countries such as China, Canada, and Mexico.

Following the market crash, implied volatility (IV) spiked for Bitcoin and Ethereum. Bitcoin’s short-term volatility surged to 90% at one point in the week, and Ethereum’s short-term volatility exceeded 100%.

Nonetheless, the market seems to have stabilized, with Bitcoin reclaiming $82,000 and Ethereum $2,170. The duo are up 5% from their intraday lows of $78,179 and $2,073.

VanEck’s Sigel Shows Current Bitcoin Pullback is Natural, Says He Continues to Accumulate

0

VanEck’s Matthew Sigel shows how the ongoing Bitcoin pullback is a natural part of its cycle, confirming that he has continued to accumulate.

Bitcoin’s recent dip below $80,000, followed by a swift recovery above $81,000, has triggered concerns among investors that the crypto market’s bull run might be losing steam. 

Sigel Shows Current Bitcoin Pullback Natural

However, Matthew Sigel, VanEck’s Head of Digital Assets Research, recently stepped in to calm these fears, suggesting that the current 25% drop from its all-time high of $109,600 aligns with historical patterns. 

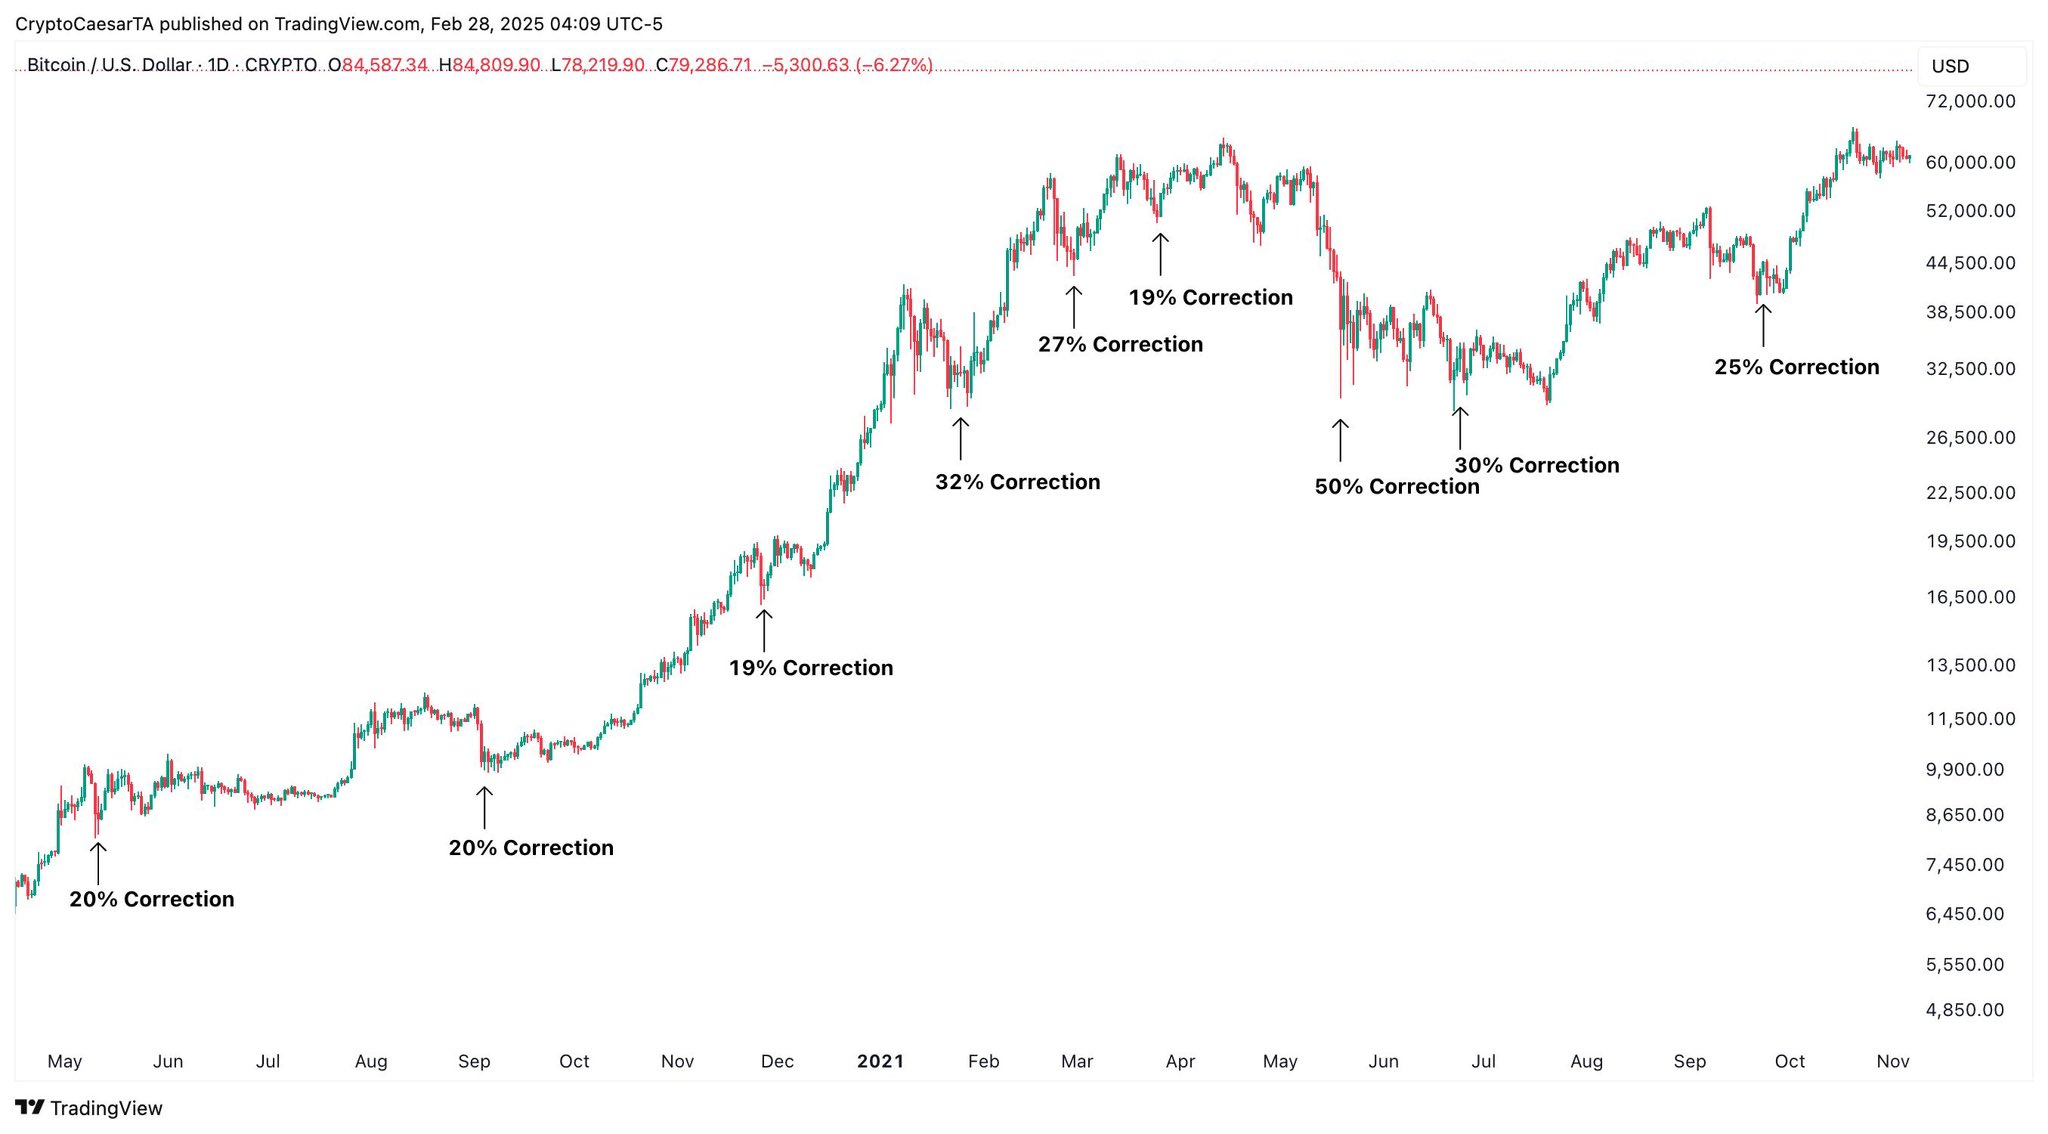
In a casual disclosure on X, Sigel pointed to past bull cycles, revealing that massive corrections occur regularly before Bitcoin reaches new peaks.

The analyst called attention to Bitcoin’s performance during previous rallies. In 2017, as Bitcoin climbed to $20,000, it endured seven corrections ranging from 27% to 41%. Similarly, in 2021, on its way to $69,000, the cryptocurrency faced six pullbacks between 17% and a staggering 55%. 

The current 25% correction is similar to these past dips, suggesting that volatility remains a natural part of Bitcoin’s growth trajectory. When asked if this indicates that he is not concerned, Sigel confirmed that he’s constantly accumulating assets while others sell.

Several Analysts Agree

Interestingly, in a separate commentary, analyst Rekt Capital echoed Sigel’s disclosure, spotlighting Bitcoin’s first “Price Discovery Corrections” across cycles. In 2013, Bitcoin plummeted 75% over 13 weeks, while 2017 saw a 34% drop in just 3 weeks. Further, the 2021 cycle experienced a 31% decline over 4 weeks. 

Now, in 2025, Bitcoin’s 25% correction has unfolded over 11 weeks, shallower than most historical precedents but closer in duration to 2013. Rekt Capital noted that while this pullback nears the typical 30% threshold, its extended timeline shows the market is maturing.

Meanwhile, Crypto Caesar also confirmed that corrections like this one fit comfortably within bull market patterns. Notably, he acknowledged that Bitcoin could still dip below this level, a sentiment shared by Standard Chartered, but is confident that Bitcoin’s upward trajectory continues. 

Bitcoin Pullback Crypto Caesar
Bitcoin Pullback | Crypto Caesar

More Bitcoin Dip before Uptrend

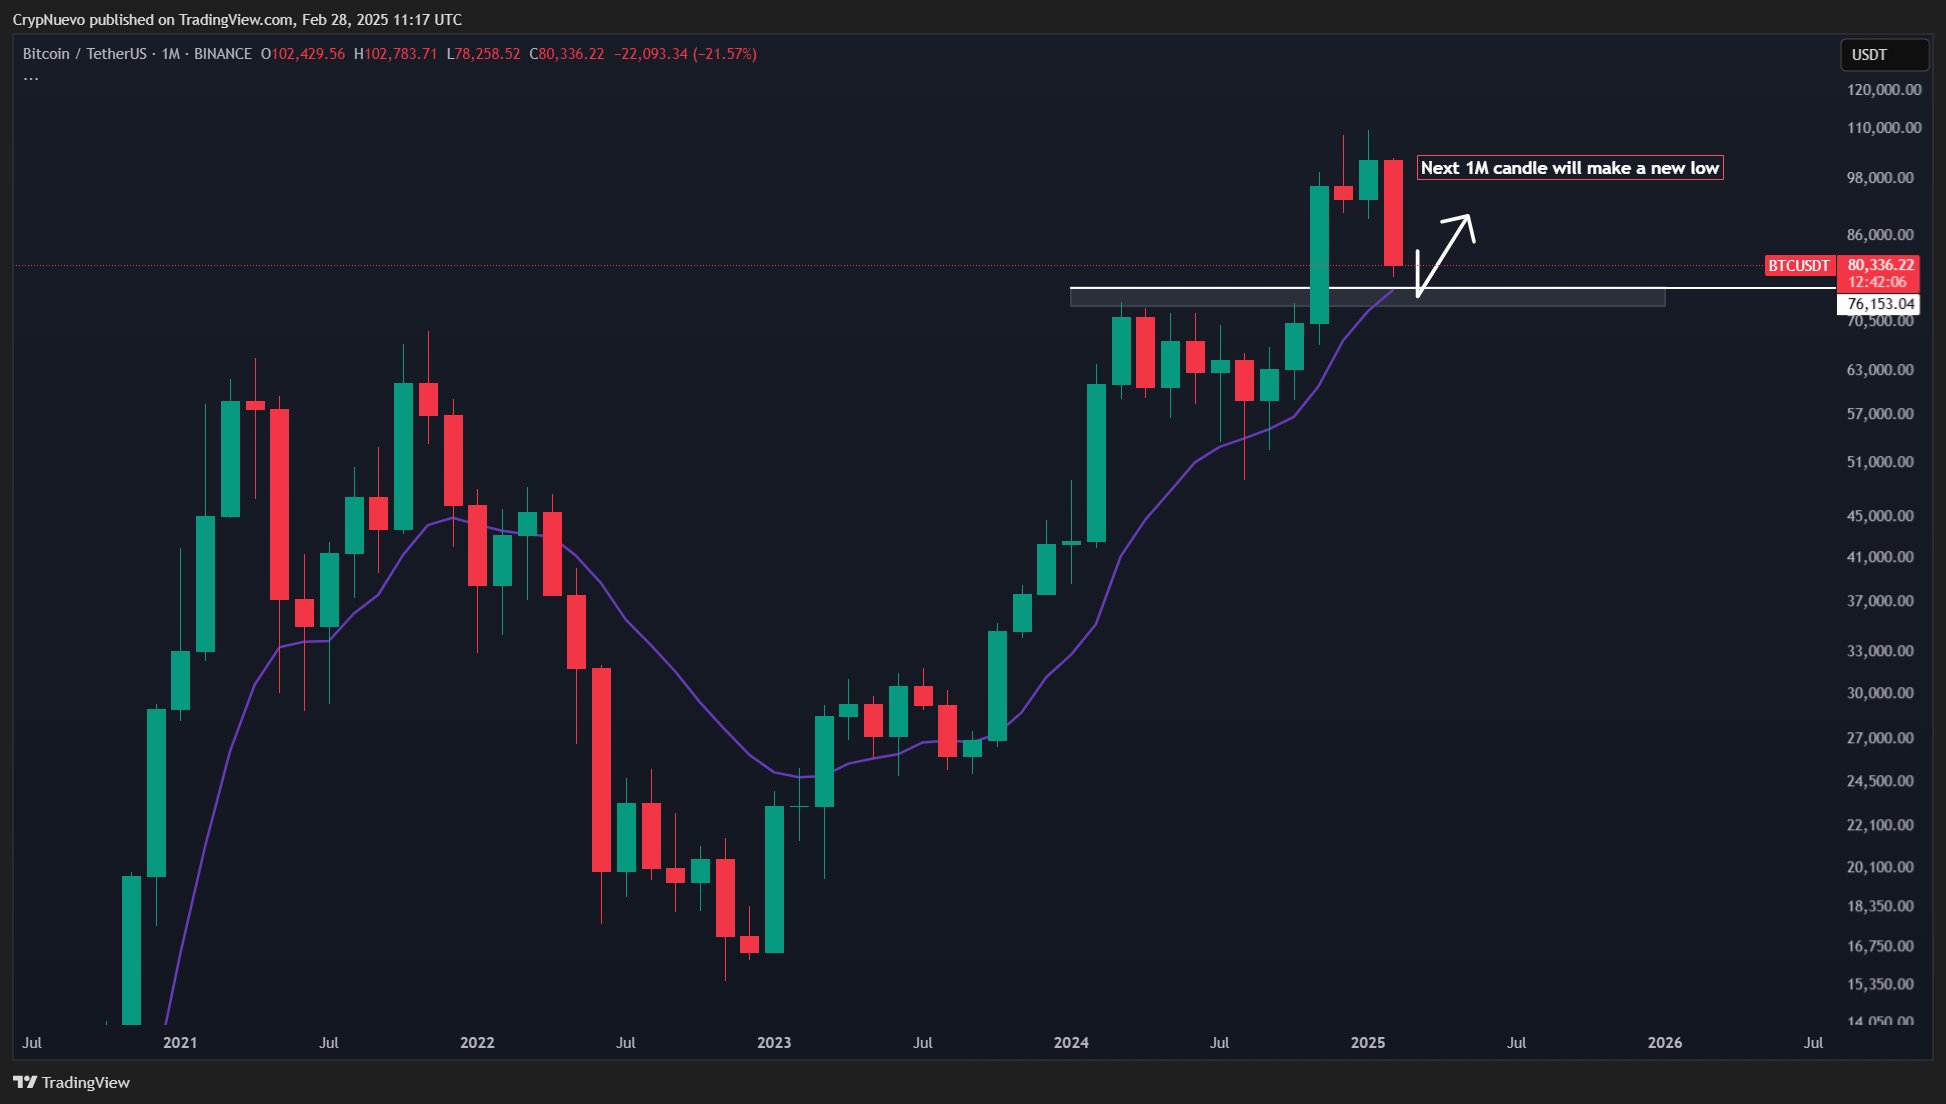
However, CrypNuevo, another analyst, forecasted that Bitcoin’s next monthly candle in March will likely dip lower, possibly retesting today’s February lows. 

According to him, this move could fill a gap in the CME futures market and test the 50-week exponential moving average—a key support level where a bounce might occur. CrypNuevo suggests the market sits on the cusp of a pivotal moment, urging patience as Bitcoin finds its footing.

Bitcoin 1M Chart CrypNuevo
Bitcoin 1M Chart | CrypNuevo

Market veteran Michaël van de Poppe ties the current Bitcoin volatility to broader economic factors, calling attention to massive long liquidations today—the highest since October 2021—triggered the crash below $80,000 today. 

Van de Poppe also connects the correction to external pressures, like tariff discussions and a Nasdaq tumble, predicting a potential rebound after the U.S. market opens. For him, this dip represents an exceptional buying opportunity.

Despite the ongoing pullback, analyst Wimar claims the biggest bull run in Bitcoin’s history is just days away. He ties this forecast to a historical pattern where Bitcoin surges 315 days post-halving, projecting a climb to $250,000 in 2025. Currently, BTC trades for $81,596, down 5.5% in the past 24 hours.

Analyst Expects Further Dogecoin Downside Before Massive Recovery, Cites Falling Wedge

0

Dogecoin, the original meme coin, faces a potential dip before a significant upward surge, according to market analyst Exocet. 

In a recent TradingView idea, the analyst identified a falling wedge pattern on the DOGE daily chart, signaling a bullish continuation but with a near-term correction on the horizon. This setup, alongside broader market uncertainty, suggests traders might need to brace for a temporary decline before the coin embarks on its next major rally.

Dogecoin Forms Falling Wedge

The chart reveals Dogecoin’s breakout last November, which propelled the price to a three-year peak of $0.48 by December, a 269% surge from the $0.13 mark fueled by high trading volume and market-wide optimism. However, this rally met resistance, with the new year introducing a sharp correction to $0.1961 on Wednesday, Feb. 26. 

This correction led to the formation of a falling wedge, a pattern featuring converging downward-sloping trendlines that often precede a bullish move to an uptrend. Currently trading at $0.2109, Dogecoin still sits within this falling wedge.

Dogecoin Falling Wedge
Dogecoin Falling Wedge | Exocet

Exocet noted that the falling wedge is a critical structure, with the upper trendline connecting lower highs at $0.4340, $0.2867, and potentially $0.2287. Further, the lower trendline appears to link lows around $0.32 and the recent $0.1961 mark.

DOGE Could Drop Further

Notably, the DOGE price currently hovers near the middle of this wedge after bouncing from the lower trendline, indicating buyer support at this level. However, Exocet warned that the broader crypto market may not have reached its bottom, which could delay Dogecoin’s breakout.

The analyst predicts that Dogecoin will soon test the upper trendline of the wedge, positioned around $0.2350, an important resistance level to watch. A rejection at this point appears likely, potentially driving the price back to an interim low near $0.1750, close to the recent bottom. 

This pullback aligns with the lower trendline of the wedge, presenting a potential entry point for those looking to capitalize on the expected recovery. Exocet stressed that investors should monitor $0.2350 for signs of a breakout but advises patience for a possible dip to $0.1750 if the price fails to break through resistance.

Breakout Targets $0.5434

Should Dogecoin overcome the $0.2350 barrier with strong volume, the falling wedge pattern could lead to a substantial upside. The height of the wedge, measured from the $0.4843 peak to the $0.17590 low, spans $0.3084. Adding this to the breakout point of $0.2350 projects a target of about $0.5434.

However, this bullish scenario hinges on favorable market conditions, as external factors, such as Bitcoin’s recovery, will play a major role in Dogecoin’s ability to sustain a breakout. Trading volume within the wedge has declined, a typical sign of consolidation, but a spike will confirm a breakout if it occurs.

Meanwhile, analytics resource NineDragonsVenture suggested that Dogecoin at the current position presents an attractive risk-to-reward ratio. According to them, with BTC dropping to the lower end of the $80K mark, investors are shifting capital to altcoins like Dogecoin.

DOGE 1D Chart
DOGE 1D Chart | NineDragonsVenture

Interestingly, they maintained that attractive opportunities like what Dogecoin currently presents appear once a month. From the current area, the analytical platform sets the first take-profit target at $0.31249 and the second target at $0.41533.

Top Trader Declares Massive XRP Short: Here are the Profit-Taking Targets

0

A crypto analyst, Mad Whale, has shared a daring prediction for XRP following a technical analysis of the asset’s price action.

According to the trader, XRP is facing a critical breakdown risk, with the potential for a major drop if key support levels fail to hold.

XRP in a Downtrend: Key Resistance and Support Levels

Mad Whale’s analysis highlights that XRP is currently trading within a descending channel. Notably, the price is approaching a critical resistance level near the psychological $2 mark. If XRP fails to break above this resistance, the analyst believes the asset will continue its descent.

For context, XRP dipped below $2 earlier today as its price plummeted by over 10%. The fall followed earlier declines this week amid the broader market dump. While XRP had firmly defended the $2 level earlier this week, it has ultimately given up the support.

Mad Whale, who identified this risk earlier, called for a short when XRP traded above the level. He pointed out that a key support level exists around $1.90, which marks the first downside target. Notably, XRP briefly dipped to $1.96 but has since recovered above $2 at press time.

The analyst emphasized that the $1.90 zone is crucial for XRP’s short-term stability. If the $1.90 support fails to hold, it could trigger another round of sell-off.

Potential for Another 35% Dip: Profit-Taking Targets for Shorts

Specifically, should XRP break below the $1.90 support, Mad Whale believes a 35% decline toward the $1.50 zone would be next. This level aligns with the lower boundary of the descending channel. 

Meanwhile, the analyst believes it could act as a point for price stabilization or even a reversal. Accordingly, traders who are short on XRP may look to take profits near the $1.50 level. 

XRP potential dip to $15

The analyst suggests this could be an ideal point for traders to exit, as it represents the next significant support and a potential market turnaround.

Mad Whale’s sentiment aligns with other analysts on TradingView who have similarly opened shorts on XRP. They agree that the $1.50 level would be an ideal point for a bull comeback.

Meanwhile, some other analysts have expressed caution as XRP hovers around $2, suggesting an unexpected rebound could unfold from this level.

Latest Congressional Hearing Proves Judge Torres Correctly Ruled XRP Is Not a Security

0

A recent United States congressional hearing further confirms that XRP is not a security in itself, aligning with Judge Torres’ reasoning. 

Senator Cynthia Lummis (R-WY), chairperson of the newly formed Senate Banking Committee on Digital Assets, provided insights into the panel’s latest hearing, which focused on the legislative framework of digital assets. 

Senate’s Latest Findings About Crypto

In an X post yesterday, Lummis outlined three major findings relating to digital assets. First, she emphasized that most cryptos do not meet the criteria of the longstanding securities test, Howey. This indicates that digital assets that do not satisfy Howey’s criteria should not be regulated as securities. 

Second, she acknowledged that the United States is behind other nations in creating crypto regulation. Several crypto stakeholders, including Ripple CEO Brad Garlinghouse, have previously echoed this sentiment. 

Lastly, Senator Lummis said the committee learned that stablecoins will bring the United States payment system into the 21st century. This suggests that stablecoins could refine the country’s outdated financial system by offering faster and cheaper payments than traditional alternatives.  

Judge Torres Correctly Ruled XRP Is Not a Security 

As expected, Senator Lummis’ tweet attracted the attention of crypto enthusiasts, with many focusing on the findings relating to the legal status of cryptos. 

Famous crypto lawyer Bill Morgan suggested that this finding confirms that Judge Analisa Torres correctly ruled that XRP is not a security. 

Recall that the judge issued this declaration in July 2023 during her landmark ruling in the SEC v. Ripple lawsuit. However, the judge held that XRP could be sold as part of a security. This was reflected in Ripple’s sale to institutional clients, prompting Judge Torres to label these transactions as investment contracts. 

Significance for XRP 

Essentially, the U.S. Senate findings on the security status of crypto assets further validate Judge Torres’s classification of XRP. 

Although the Ripple lawsuit is currently in appeal, the SEC is not challenging Judge Torres’s declaration about XRP’s non-security status. Instead, it aims to overturn her ruling on Ripple’s programmatic sales and other distributions of XRP, which she labeled non-investment contracts. 

Notably, the SEC is expected to end the Ripple case in the coming weeks, as it has done in other crypto-related lawsuits. If resolved, this would clear any regulatory uncertainty surrounding XRP, paving the way for the launch of multiple XRP ETFs in the United States. 

Here’s Where Shiba Inu Could Find Support After 30% Crash

0

Shiba Inu (SHIB) is hovering around lower price regions, with analysts pointing to key support levels that could determine its next move.

This week has been one of the worst periods for Shiba Inu this year. Today, the price of SHIB has plummeted by 10%, dipping to $0.00001302. This marks Shiba Inu’s lowest price since September 2024.

Today’s dip worsens its monthly performance, now standing at a 32% loss for holders. Meanwhile, looking at the three-month chart, SHIB holders are nursing over a 50% loss on their positions. Notably, Shiba Inu’s downturn comes as Bitcoin revisited 2024 lows below $90,000.

With the week-long market-wide crash showing no sign of cooling off, crypto analyst Ali Martinez has suggested key levels SHIB holders should watch for a possible re-entry during the next major uptrend.

Shiba Inu Critical Support to Watch

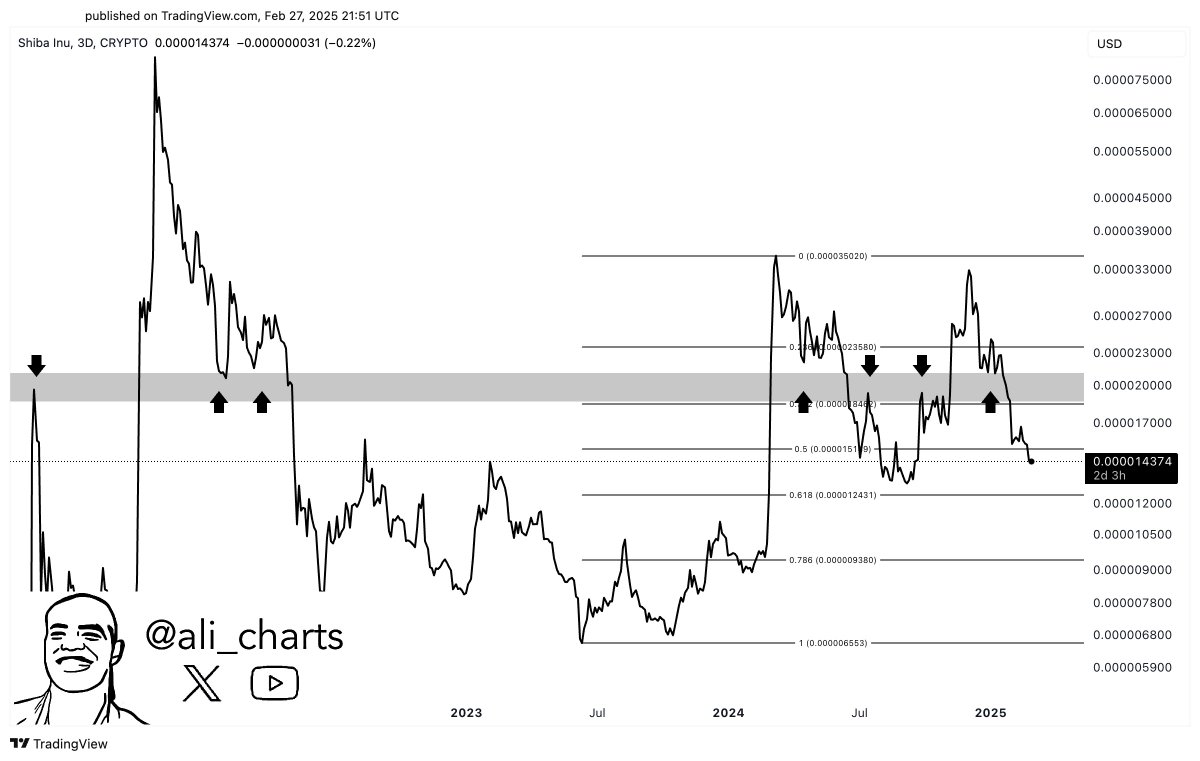
In a tweet today, Martinez highlighted that SHIB may find support at $0.000012 or $0.0000094, based on Fibonacci retracement levels. This suggests Shiba Inu could dip even further from its current position around $0.000013.

Martinez shared a chart illustrating how SHIB has struggled to break past the $0.000018 to $0.000023 resistance range.

Image
Shiba Inu chart Ali Martinez

If SHIB fails to hold above current levels, a deeper correction toward $0.000012 appears likely. This level aligns with the 0.618 Fibonacci retracement level.

Meanwhile, if the bears dominate further, another breakdown could push SHIB to $0.0000094, aligning with the 0.786 Fibonacci level.

From the current price, this would mean an additional loss of 28% for holders. Considering Shiba Inu’s 2025 high of $0.000025, this would also translate to an astonishing loss of 62% just ten weeks into the new year.

SHIB Rebound Prospects

SHIB previously experienced a strong rally in early 2024, but recent price action points to a cooling-off period as buyers lose momentum. Meanwhile, some analysts are feeding investors’ hope that the recent price action is merely noise.

Community figure Tanzeel urged enthusiasts to zoom out and look at Shiba Inu’s performance over a broader timeframe. She cited Shiba Inu’s historical chart showing that the coin has gained 1,035,415% since its inception and up about 181,520% against Bitcoin within the same timeframe, offering hope amid widespread pessimism.

In a separate commentary, analytical resource Rose Premium Signals highlighted Shiba Inu’s potential recovery path once bulls later regain control.

They suggested SHIB has a huge rebound potential from its current low, first targeting $0.00002941, then heading to $0.00003738, and ultimately reaching $0.00004401 before losing momentum. 

Notably, they hinge this promising prospect on SHIB quickly rebounding to $0.000022, dipping to $0.00001800, and then coming back with a much stronger wave to clear out major resistances.

Bitwise CIO Says Now is the Best Time to Buy Bitcoin as Standard Chartered Unveils $500K Target

0

Experts remain bullish on Bitcoin despite recent market panic.

Over the past few days, Bitcoin has tanked nearly 29% from its all-time high of about $109,600 to trade as low as the $78,300 level amid market uncertainty driven by geopolitical tension, among other bearish factors. While this price action has sparked market-wide panic and growing bear market speculation, industry leaders appear to be more bullish than ever.

“The Best Time Ever to Buy Bitcoin”

Bitwise CIO Matt Hougan has argued that recent market conditions may be creating the single best time to buy Bitcoin.

“Adjusted for risk, this is the best time in history to buy bitcoin,” the analyst wrote on Thursday, February 27.

Hougan expressed this in response to an X post from Variant CLO Jake Chervinsky, which asserted, “This is the moment of greatest opportunity for crypto,” citing favorable regulations, better technology, a growing push for decentralization, and traditional finance interest.

Meanwhile, Hougan is not the only leading analyst to sound bullish on the asset amid the recent market dip.

Bitcoin to $500K under Trump?

Speaking with CNBC International on Thursday, February 27, Standard Chartered’s Head of Digital Asset Research, Geoffrey Kendrick, asserted that he still expects Bitcoin to surge to $200,000 in 2025 and $500,000 before President Donald Trump leaves office.

According to Kendrick, the catalyst for this move will be regulatory clarity in the U.S. and increased institutionalization of the space, which will bring a sense of stability and safety.

In the short term, however, Kendrick continues to insist that the Bitcoin rout is not yet over. In a Friday note to investors, the analyst cautioned that he expects the crypto market sell-off to continue into the weekend, as markets anticipate the implementation of Trump tariffs on Canada, China, and Mexico on March 4.

Specifically, Kendrick anticipates that Bitcoin will experience a weekend slump similar to that of August 4 or November 6, where the asset dropped about 5%, citing the $69,000 to $76,500 price range as an attractive entry point.

At the time of writing, the asset has pared some of its losses to trade just above $80,000.